Mapletree Commercial Trust - Investor Presentation 22 June 2020
←
→
Page content transcription
If your browser does not render page correctly, please read the page content below
Mapletree Commercial Trust
           Investor Presentation
                   22 June 2020

                                   0
Important Notice
This presentation is for information only and does not constitute an offer or solicitation of an offer to sell or invitation to
subscribe for or acquire any units in Mapletree Commercial Trust (“MCT”, and the units in MCT, the “Units”).

The past performance of MCT and Mapletree Commercial Trust Management Ltd., in its capacity as manager of MCT (the
“Manager”), is not indicative of the future performance of MCT and the Manager. The value of the Units and the income
derived from them may fall as well as rise. Units are not obligations of, deposits in, or guaranteed by, the Manager or any
of its affiliates. An investment in Units is subject to investment risks, including the possible loss of the principal amount
invested. Investors have no right to request the Manager to redeem their Units while the Units are listed. It is intended that
unitholders may only deal in their Units through trading on the Singapore Exchange Securities Trading Limited (“SGX-
ST”). Listing of the Units on the SGX-ST does not guarantee a liquid market for the Units.

This presentation may also contain forward-looking statements that involve assumptions, risks and uncertainties. Actual
future performance, outcomes and results may differ materially from those expressed in forward-looking statements as a
result of a number of risks, uncertainties and assumptions. Representative examples of these risks, uncertainties and
assumptions include (without limitation) general industry and economic conditions, interest rate trends, cost of capital and
capital availability, competition from similar developments, shifts in expected levels of property rental income, changes in
operating expenses (including employee wages, benefits and training costs), governmental and public policy changes and
the continued availability of financing in the amounts and the terms necessary to support future business. You are
cautioned not to place undue reliance on these forward-looking statements, which are based on the Manager’s current
view of future events.

Nothing in this presentation should be construed as financial, investment, business, legal or tax advice and you should
consult your own independent professional advisors. Neither the Manager nor any of its affiliates, advisers or
representatives shall have any liability whatsoever (in negligence or otherwise) for any loss howsoever arising, whether
directly or indirectly, from any use, reliance or distribution of this presentation or its contents or otherwise arising in
connection with this presentation. This presentation shall be read in conjunction with MCT’s financial results for the Fourth
Quarter and Financial Period from 1 April 2019 to 31 March 2020 in the SGXNET announcement dated 22 April 2020.

                                                                                                                                  1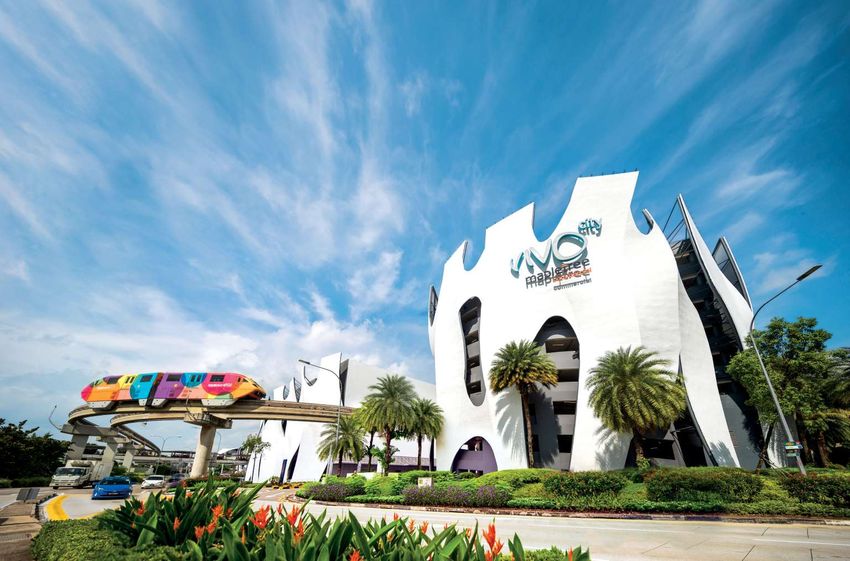
Content
Overview of SREITs Page 3
Overview of Mapletree Commercial Trust Page 6
Overcoming the COVID-19 Headwinds Page 24
Completed Acquisition of Page 30
Mapletree Business City II
Active Asset Management to Create Value Page 36
4Q and FY19/20 Financial Highlights Page 52
Other Information Page 66
2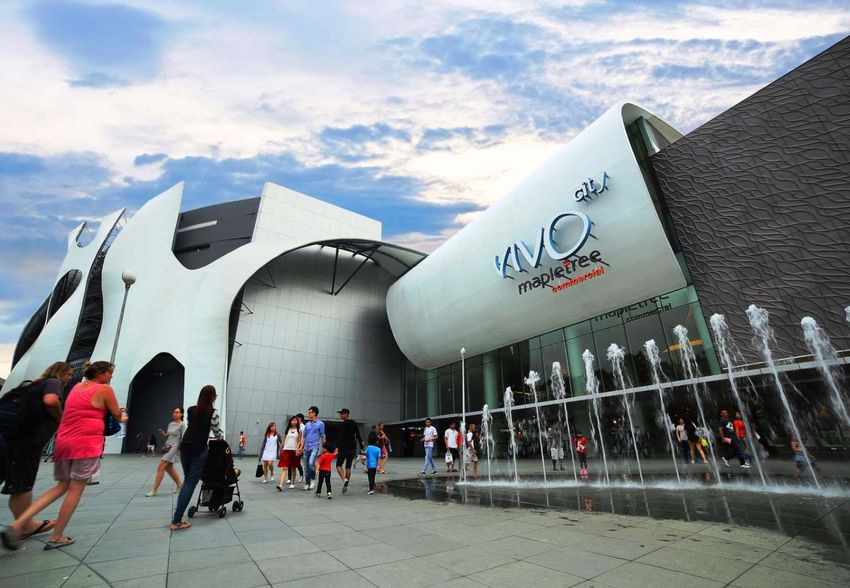
Overview of SREITs/Business Trusts
Total of 43 REITs and Business Trusts listed in Singapore
Combined market capitalisation of S$98.0 bil
Market Capitalisation by Sector
Healthcare, $2.8 bil, 3%
Retail, $15.9 bil, 16%
MCT
$6.6 bil, 6.8%
Industrial, $37.6 bil, 39%
Diversified, $16.1 bil,
17%
Office, $17.2 bil, 18%
Hospitality , $6.5 bil, 7%
Note: Based on data from Bloomberg as at 31 May 2020
3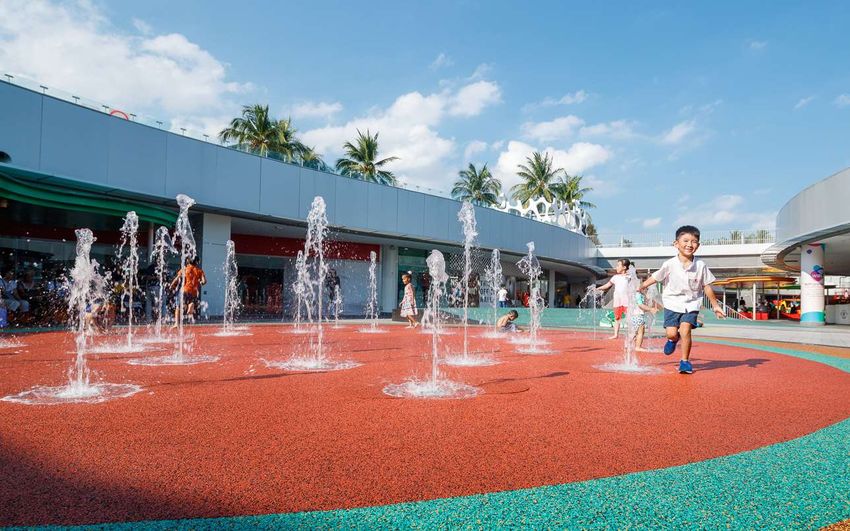
Overview of SREITs/Business Trusts

                              Market Capitalisation of the 15 Largest SREITs
                                                  (S$ bil)
12.00     11.32

10.00

                   7.80
 8.00                       7.49
                                     6.76     6.63
                                                       5.99
 6.00

                                                              4.20   4.14
 4.00                                                                       3.63
                                                                                   2.97   2.72   2.70   2.53   2.29   2.10
 2.00

   -

Note: Based on data from Bloomberg as at 31 May 2020
                                                                                                                             4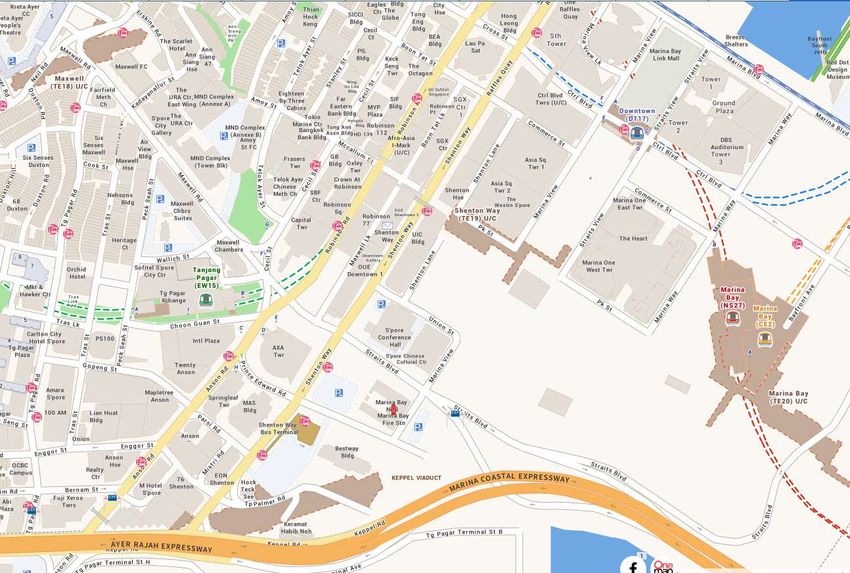
Overview of SREITs – Legislative Comparison
                        Malaysia                    South-Korea                South-Korea             Japan                 Singapore            Thailand              Hong Kong              Taiwan                  Philippines
                                                    (K-REITs)                  (CR-REITs)
Management              External                    Internal/External          Internal/External       External              External             External              Internal/External      Internal/External       External
Structure

Minimum Real            75%                         70%                        70%                     75%                   75%                  75%                   100%                   75%1                    75%
Estate
investments

Foreign Assets          OK                          OK                         OK                      OK                    OK                   OK                    OK                     OK(with Central         Up to 40%
                                                                                                                                                                                               Bank approval)          (with
                                                                                                                                                                                                                       approval)

Development             Up to 10% of total          Up to 30% of total         Prohibited              Prohibited            Up to 25% of         Up to 10% of          Up to 10% of           Up to 15% of net        Prohibited2
                        assets                      assets                                                                   deposited            net asset value       deposited              worth
                                                                                                                             property                                   property

Gearing Limit           50% of total asset          Maximum Debt               No gearing for          No restriction        50% of total         35% of total          45% of total           35% of total            35% of total
                        value                       equity ratio 2:1           investment                                    assets3              assets4               assets                 assets4                 assets4
                                                                               purpose

Payout                  If payout is > 90%,         > 90% of net               > 90% of net            > 90% of              90% of taxable       > 90% of net          > 90% of net           > 90% of taxable        > 90% of net
                        undistributed               income                     income                  taxable               income (no           profit                income after tax       income (post            profit
                        income is tax                                                                  income (post          depreciation)                                                     depreciation)
                        exempted                                                                       depreciation)

Tax                     Yes                         No                         No                      Yes                   Yes                  Yes                   Yes                    Yes                     Yes
Transparency

Tax Concession          Yes, final                  No                         No                      No                    10%                  Non resident          Yes6                   No                      No
for Investor5           withholding tax of                                                                                   withholding tax      individuals and
                        10% for individuals                                                                                  for non              companies are
                        and non-corporate                                                                                    resident             exempt from
                        investors, up to 31                                                                                  companies            Thai tax
                        Dec 2019                                                                                             until Dec 2025

Note 1: Includes cash, government bonds and ABS instruments. SREITs are required to invest 35% in real estate and at least 70% in real estate and real estate-related assets, such as shares of property companies
Note 2: Unless the REIT intends to hold such property post completion and provided that contract value/investment in such property development does not exceed 10% of property deposited
Note 3: MAS had on 16 Apr 2020 raised the leverage limit for REITs listed on SGX from 45% to 50% (up to 31 Dec 2021) and deferred to 1 Jan 2022, the requirement to have a minimum adjusted interest coverage ratio of 2.5 times
before the leverage limit can be increased from the then prevailing 45% limit (up to a maximum of 50%)
Note 4: May exceed 35% gearing cap if the REIT obtains and discloses a credit rating from a major rating agency
Note 5: Tax exemption at REIT level only applicable for distributed income to resident unitholders
Note 6: Exempt for all domestic unitholders, no specific exemption provided for foreign investors, but income from REIT distributions not taxed in practice

Source: UBS Global Research - Singapore Property Report and MAS Code on Collective Investment Schemes
                                                                                                                                                                                                                                     5
Overview of
Mapletree Commercial Trust

                             VivoCity
Mapletree Commercial Trust (“MCT”)
Public
Mapletree Commercial Trust Unitholders
MIPL
Mapletree Investments Pte Ltd
Sponsor
(“MIPL” or the “Sponsor”) 67.7% 32.3%1
Mapletree Commercial Trust Management Trustee –
Ltd. (“MCTM” or the “Manager”)
Manager DBS
— Wholly-owned subsidiary of the
Sponsor
Sponsor Stake 32.3%1
Manager –
Primarily retail and / or office assets MCTM
Investment Mandate
in Singapore
Portfolio
5 properties valued at S$8,920 mil Property
Portfolio
Approximately 5.0 mil square feet NLA VivoCity Manager –
Mapletree Business City (“MBC”) MCPM
Mapletree Commercial Property
Management Pte. Ltd. (“MCPM”) PSA Building
Property Manager
— Wholly-owned subsidiary of the Mapletree Anson
Sponsor
Bank of America Merrill Lynch HarbourFront
Trustee DBS Trustee Limited (the “Trustee”) (“MLHF”)
Credit Rating Moody’s – Baa1 (stable)
1. As at 31 March 2020
7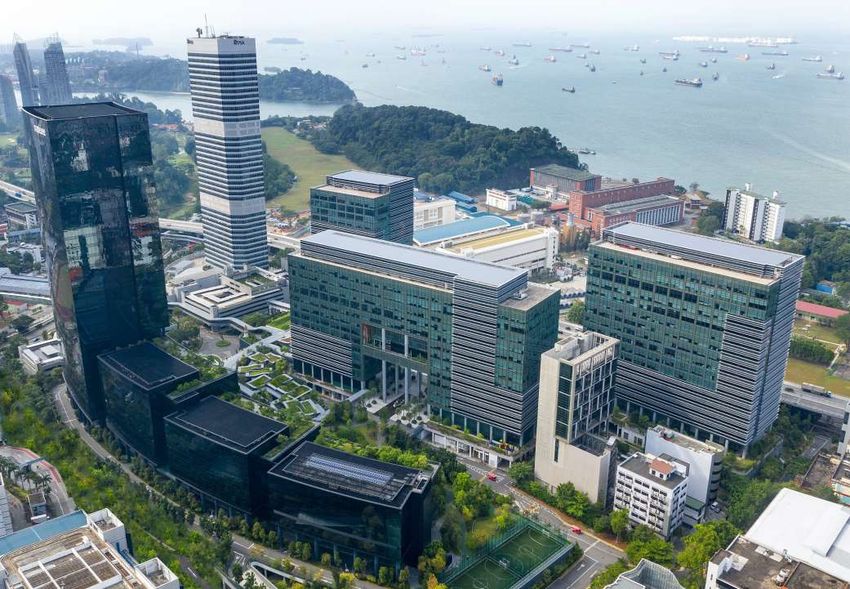
A Snapshot of MCT

           VivoCity                         MBC                        PSA Building                 Mapletree Anson                       MLHF

                  Key Indicators                                           At IPO                                      As at 31 March 2020

 NLA (‘000 sq ft)                                                          1,6681                                              5,033
                                                                                                     201.7%

 Investment Properties (S$ million)                                        2,822                                               8,920
                                                                                                    216.1%

 Net Asset Value Per Unit (S$)                                              0.91                                                1.75
                                                                                                     92.3%

 Market Capitalisation (S$ million)                                        1,6382                                              6,0533
                                                                                                    269.5%

 Free Float (S$ million)                                                    9494                                               4,0985
                                                                                                    331.9%

 Total returns since IPO (%)                                                  -                                                187.66

1.   Excluding PSA Building asset enhancement which was deemed to have an expected NLA of 102,505 square feet at the time of IPO
2.   Based on IPO Price of S$0.88 per unit and 1,861 million units in issue
3.   Based on Unit price of S$1.83 as at 31 March 2020 and 3,307.5 million units in issue
4.   Market capitalisation at IPO less the proportion deemed to be held by the Sponsor
5.   Market capitalisation on 31 March 2020 less the proportion deemed to be held by the Sponsor
6.   Comprises 108.0% in capital appreciation gains based on IPO Price of S$0.88 and Unit Price of S$1.83 at close of trading on 31 March 2020
     and 79.6% in distribution gains based on total distributions of 70.06 Singapore cents paid out/payable

                                                                                                                                                 8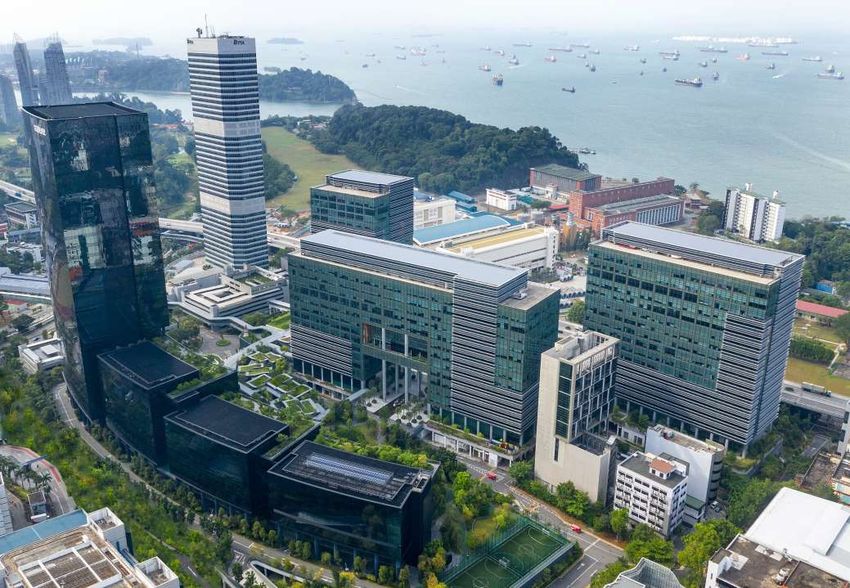
Quality Portfolio of
Best-In-Class Commercial
Properties

                           VivoCity
Portfolio Location
Includes some of the best-in-class assets
PSA
MBC BUILDING
10 mins drive
to CBD
Singapore Map Zoomed Out:
10Portfolio Details (IPO Assets)
VivoCity PSA Building MLHF
Integrated development comprising a
Singapore’s largest mall located in the
40-storey office building and a A 6-storey premium office building with
HarbourFront Precinct. A 3-storey
3-storey retail centre known as the basement carpark located in the
shopping complex with 2 basement levels
Alexandra Retail Centre, located in the HarbourFront Precinct
and a 8-storey annexe carpark
Alexandra Precinct
NLA: 1,072,296 square feet NLA: 523,840 square feet NLA: 215,734 square feet
Number of leases: 354 Number of leases: 118 Number of leases: 3
Title: 99 years commencing from 1 Title: 99 years commencing from 1 Title: 99 years commencing from 1
October 1997 October 1997 October 1997
Market valuation: S$3,262 million Market valuation: S$791 million Market valuation: S$347 million
Note: All information, except for NLA and the number of leases, are as at 31 March 2020
11Portfolio Details (Assets Acquired After IPO)
Mapletree Anson MBC
MBC I MBC II
A 19-storey building in the Central Business MBC, comprising MBC I and MBC II, is a large scale integrated office and business park
District with Grade A office building development with Grade A building specifications. It comprises one office tower and seven
specifications business park blocks, supported by ancillary retail space
Acquisition Date: 4 February 2013 Acquisition Date: 25 August 2016 Acquisition Date: 1 November 2019
NLA: 328,852 square feet NLA: 1,707,202 square feet NLA: 1,184,704 square feet
Number of leases: 22 Number of leases: 37 Number of leases: 32
Title: 99 years commencing from 22 Title: Strata Lease commencing from 25 Title: 99 years commencing from 1
October 2007 August 2016 to 29 September 2096 October 1997
Market valuation: S$762 million Market valuation: S$2,198 million Market valuation: S$1,560 million
Note: All information, except for NLA and the number of leases, are as at 31 March 2020
12Portfolio Valuation
Best-in-class assets constitute 79% of Enlarged Portfolio and NPI
Valuation as at Valuation as at
31 March 2020 31 August 2019 FY19/20 NPI
S$ per square feet (S$ million)
S$ million Capitalisation Rate S$ million
NLA
VivoCity 3,262.0 3,031 psf 4.625% 3,262.0 158.7
Office: 3.90%
MBC I 2,198.0 1,287 psf 2,193.0 110.1
Business Park: 4.95%
Office: 4.00%
PSA Building 791.0 1,505 psf 786.0 37.6
Retail: 4.85%
Mapletree Anson 762.0 2,317 psf 3.50% 762.0 25.1
MLHF 347.0 1,608 psf 3.90% 347.0 16.2
Existing Portfolio 7,360.0 7,350.0 347.7
Business Park: 4.90%
MBC II1 1,560.0 1,317 psf 1,550.02 30.2
Retail: 4.75%
Enlarged Portfolio 8,920.0 8,900.0 377.9
1. The acquisition of MBC II was completed on 1 November 2019
2. Refers to the Agreed Property Value
13Established & Trusted
Track Record
Mapletree Business CitySustained Earnings from Healthy Asset Performance
Gross Revenue (S$ million) Net Property Income (S$ million)
377.9
482.8 347.6
338.8
443.9
433.5
292.3
377.7
220.7
282.5 287.8 211.7
267.2 195.3
219.5 156.0
177.3
124.0
1
FY11/12 FY12/13 FY13/14 FY14/15 FY15/16 FY16/17 FY17/18 FY18/19 FY19/20 FY11/121 FY12/13 FY13/14 FY14/15 FY15/16 FY16/17 FY17/18 FY18/19 FY19/20
1. FY11/12 – For the period from Listing Date of 27 April 2011 to 31 March 2012
2. Refers to Compound Annual Growth Rate (“CAGR”) from FY11/12 (restated) to FY19/20. FY11/12 (restated) figures are restated from the period from Listing Date to 31 March
2012 to the full period of 1 April 2011 to 31 March 2012 for a comparable basis for CAGR calculation
15Long-term Sustainable Returns to Unitholders
Amount Available Distribution Per Unit
For Distribution (S$ million) (Singapore cents)
S$43.7 mil of S$43.7 mil of
distribution retained in distribution retained in
4Q FY19/20 to better 4Q FY19/20 to better
position for COVID-19 position for COVID-19
uncertainties ahead uncertainties ahead
9.04 9.14
260.4 264.0
3
8.62
243.2 8.00 8.13 8.00 3
227.2
7.372
6.487
168.3 172.5
153.0 5.271
123.5
98.2
FY11/121 FY12/13 FY13/14 FY14/15 FY15/16 FY16/17 FY17/18 FY18/19 FY19/20 FY11/12 1 FY12/13 FY13/14 FY14/15 FY15/16 FY16/17 FY17/18 FY18/19 FY19/20
1. FY11/12 – For the period from Listing Date of 27 April 2011 to 31 March 2012
2. Refers to Compound Annual Growth Rate (“CAGR”) from FY11/12 (restated) to FY19/20. FY11/12 (restated) figures are restated from the period from Listing Date to 31 March
2012 to the full period of 1 April 2011 to 31 March 2012 for a comparable basis for CAGR calculation
3. S$43.7 million of distribution was retained by way of capital allowance claims and capital distribution retention in 4Q FY19/20
16Solid Track Record of Creating Value
Investment Properties Net Asset Value per Unit
(S$ million) (S$) 1.75
3
8,920 1.6
1.49
1.38
7,039 1.30
6,682 1.24
2
6,337 1.16
1.06
0.95
4,199 4,342
1 4,034
3,831
2,945
FY11/12 FY12/13 FY13/14 FY14/15 FY15/16 FY16/17 FY17/18 FY18/19 FY19/20 FY11/12 FY12/13 FY13/14 FY14/15 FY15/16 FY16/17 FY17/18 FY18/19 FY19/20
1. Reflects acquisition of Mapletree Anson, completed on 4 February 2013
2. Reflects acquisition of MBC I, completed on 25 August 2016
3. Reflects acquisition of MBC II, completed on 1 November 2019
17Daily Closing price as a % of Closing Price on 27 April 2011
0.0%
50.0%
100.0%
150.0%
200.0%
250.0%
300.0%
Apr-11
Jun-11
Aug-11
Oct-11
Dec-11
Feb-12
S$0.88
at IPO:
Unit Price
Apr-12
Jun-12
Aug-12
Oct-12
Dec-12
Feb-13
Apr-13
MCT
Jun-13
Aug-13
Oct-13
Dec-13
Feb-14
Apr-14
Jun-14
Aug-14
Oct-14
Dec-14
MCT Unit Price Performance
Feb-15
Straits Times Index
Apr-15
Jun-15
Aug-15
Oct-15
Dec-15
Feb-16
Apr-16
Jun-16
Aug-16
Oct-16
FTSE Real Estate
Dec-16
Feb-17
Apr-17
Jun-17
Aug-17
Oct-17
Dec-17
Feb-18
Apr-18
FTSE ST REIT
Jun-18
Aug-18
(Relative Price Performance from MCT’s Listing on 27 April 2011 to 31 May 2020)
Oct-18
Dec-18
Feb-19
Apr-19
Jun-19
Aug-19
Oct-19
Dec-19
Feb-20
Apr-20
S$2.00
STI -21.1%
31 May 2020:
Unit Price on
MCT +127.3%
STI RE +6.1%
18
STI REIT +23.0%Benchmarking Investment Yields
4
4.00%
3
2.50%
2
0.83%
1
0.53%
Singapore Dollar 12-Months Singapore 10-year Bond Yield Singapore CPF Interest Rate Mapletree Commercial Trust
Deposit Rate (Ordinary Account)
Premium to 12-month Singapore Dollar Deposit Rate ~3.5%
Premium to Singapore 10-Year Bond Yield ~3.2%
Premium to Singapore CPF Interest Rate (Ordinary Account) ~1.5%
1. Source: MAS website, Bank fixed deposit rate (12 months) as at 31 May 2020
2. Source: MAS website, Average buying rates of government securities dealers (10-year bond yield) as at 31 May 2020
3. Source: CPF website, based on CPF interest rate for Ordinary Account (effective for the period 1 July 2020 to 30 September 2020)
4. Based on actual DPU (on a rolling basis for the period 1 January 2019 to 31 March 2020) and the Unit Price of S$2.00 at close of trading on 31 May 2020
19Disciplined Capital
Management Builds
Robust Balance Sheet
Mapletree Business City I 20Disciplined Capital Management Builds Robust Balance Sheet
S$ mil 31 Mar 12 31 Mar 13 31 Mar 14 31 Mar 15 31 Mar 16 31 Mar 17 31 Mar 18 31 Mar 19 31 Mar 20
Gross Debt 1,129 1,591 1,591 1,551 1,551 2,328 2,328 2,349 3,003
Cash 50 47 70 55 64 54 45 49 66
Net Debt 1,079 1,554 1,521 1,496 1,487 2,274 2,283 2,300 2,937
Aggregate
37.6% 40.9% 38.7% 36.4% 35.1% 36.3% 34.5% 33.1% 33.3%
Leverage1
Average Debt
2.4 3.3 2.5 3.6 3.4 4.0 3.9 3.6 4.2
Maturity (years)
% Fixed Debt 85.0% 70.4% 64.3% 68.2% 73.8% 81.2% 78.9% 85.0% 78.9%
All-in Average
Annualised
1.96% 2.18% 2.17% 2.28% 2.52% 2.66% 2.75% 2.97% 2.94%
Interest Cost
(p.a.)
Interest
Coverage Ratio 5.4X 5.4x 5.0x 5.3x 5.0x 4.9x 4.8x 4.5x 4.3x
(YTD)
1. Aggregate leverage is defined as total gross borrowings divided by total deposited property.
21Long-Term Focus on
Resilience & Stability
Bank of America Merrill Lynch HarbourFront
22Long-Term Focus on Resilience And Stability
September
2011 2015 2017 • Proposed acquisition of MBC II
• Moody’s affirmed MCT’s Baa1 rating
March July on the proposed acquisition of MBC II
April
• From Nov 2014 onwards till then, • Completed 3rd AEI at VivoCity to convert • MCT included in Straits Times Index
• Listed on Main Board of SGX-ST
issued aggregate S$250.0 mil 9,200 sq ft of Level 1 anchor space into
on 27 April 2011
MTNs due Nov 2019, Feb 2023 specialty space October
November and Mar 2023 to refinance • Secured first green loan of S$670.0 mil
August
• PSA Building enhancements were existing debt, and prepay debt
• Issued S$100.0 mil, 3.045% Fixed Rate November
completed. 15,000 sq ft of office
June Notes Due 2027 (rated Baa1) for • Raised S$918.5 mil through
space and 89,600 sq ft of retail
• Completed VivoCity’s 1st AEI to refinancing equity fund raising
space added to MCT portfolio
create 15,000 sq ft of retail space • Completed MBC II acquisition
on Basement 1 October • Issued S$250.0 mil, 3.05% Fixed Rate
December
• Announced 4th AEI to add Public Library Notes Due 2029 under the S$3.0 bil
• ARC was opened to public on 15
and extend Basement 1 in VivoCity Multicurrency MTN Programme for
December 2011 2016 refinancing
• MCT included in MSCI Singapore
2012 July 2018 Index
• Proposed acquisition of MBC I
August March 2020
August
• Set up S$1.0 bil multicurrency MTN • Issued S$120.0 mil, 3.28% Fixed
• Raised S$1.04 bil through equity
programme Rate Notes Due 2024 (rated Baa1)
fund raising. Completed MBC I February
• Issued Maiden S$160.0 mil 3.6% for refinancing
acquisition • Announced its 1st S$11.0 mil assistance
MTN due 2020
• Moody’s affirmed MCT’s Baa1 package to support retail partners amid
rating on MBC I acquisition June
the COVID-19 outbreak
December
• Issued S$175.0 mil, 3.11% Fixed • Increased MTN Programme limit
• Proposed acquisition of Mapletree from S$1 bil to S$3 bil
Rate Notes Due 2026 (rated Baa1) March and After
Anson
under the S$1 bil Multicurrency • Announced its 2nd COVID-19 support
MTN Programme for refinancing 2019 package worth S$18.0 mil
2013 • S$43.7 mil of distribution was retained
September by way of capital allowance claims and
January
• Completed VivoCity’s 2nd AEI to capital distribution retention in 4Q
February • Completed VivoCity’s 4th AEI to create
improve layout and widen F&B FY19/20
• Raised S$225.0 mil through private 24,000 sq ft of retail space on Basement 1
offerings at Basement 1 and Level 3
and a public library on Level 3 • Announced its 3rd COVID-19 support
equity placement. Completed Mapletree
package whereby fixed rent for April
Anson acquisition
November 2020 would be waived for eligible retail
May-September
• Issued S$85.0 mil, 2.795%, Fixed tenants. Property tax rebates from the
• 24,000 sq ft of recovered anchor space
2014 Rate Notes Due 2023 (rated Baa1) Government will also be fully passed on
progressively opened with new specialty
for refinancing to qualifying office and business park
stores. FairPrice Xtra officially launched its
largest outlet in Singapore on 6 August tenants.
November • Moody’s affirmed MCT’s Baa1 ratings,
• Moody’s upgraded MCT’s Issuer 2019. Completed VivoCity’s 5th AEI with
widened retail and F&B offerings at but changed outlook to negative
Rating to Baa1 (stable) • Announced its 4th COVID-19 support
Basement 2 and Level 1 in September
2019 package worth S$6.0 mil for eligible
retail tenants
23Overcoming the COVID-19 Headwinds
The Evolving COVID-19 Situation
     Date          Event
23 January 2020    Singapore reported its first COVID-19 case

31 January 2020    Visitors with recent travel history to mainland China not allowed to enter Singapore from 1 February 2020 (2359h)

7 February 2020    Disease Outbreak Response System Condition (“DORSCON”) level raised from yellow to orange

18 February 2020   S$6.4 billion Unity Budget announced

24 February 2020   MCT announced its 1st COVID-19 support package totaling S$11 million

 11 March 2020     World Health Organisation declared COVID-19 a global pandemic

 22 March 2020     No entry or transit through Singapore for all short-term visitors from 23 March 2020 (2359h)

 26 March 2020     S$48.4 billion Resilience Budget announced

                   MCT announced its 2nd COVID-19 support package worth S$18 million

                   Heightened social distancing measures announced, including limit on number of shoppers in shopping malls and maintenance of safe distances

  3 April 2020     Circuit breaker measures including mandatory closure of non-essential business and services from 7 April 2020

  6 April 2020     S$5.1 billion Solidarity Budget announced

  7 April 2020     COVID-19 (Temporary Measures) Act passed by Parliament – suspends certain contractual obligations for at least six months (up to 12 months) if inability to perform contractual
                   obligations is due to COVID-19

  16 April 2020    MAS implements measures to help REITs navigate COVID-19 challenges
                   • Extend permissible period for distribution of taxable income to qualify for tax transparency
                   • Raise leverage limit from 45% to 50% and deferral of interest coverage requirement (of 2.5x)

  21 April 2020    One-month extension of circuit breaker till 1 June 2020, with further trimming of essential businesses allowed to operate

  22 April 2020    MCT announced its 3rd COVID-19 support package – fixed rent for April 2020 waived for eligible retail tenants

  26 May 2020      S$33.0 billion Fortitude Budget announced

  2 June 2020      Easing of circuit breaker measures in three phases:
                   • Phase One: Safe Re-opening – Gradual re-opening of economic activities
                   • Phase Two: Safe Transition – More activities (e.g. retail, F&B, personal health and wellness) to resume operations with safe distancing measures and limits on group size and
                      capacity
                   • Phase Three: Safe Nation – Resume most gatherings and events with continued safe distancing measures and limits on group sizes

   5 Jun 2020      Amendments to COVID-19 (Temporary Measures) Act:
                   • Landlords to give 2 months of rental waiver to SME retail tenants with =>35% year-on-year drop in average monthly revenue in April to May
                   • Allow SME tenants to repay rental arrears in instalments of up to 9 months, and interest payable on arrears capped at 3%

                   MAS further extends permissible period for distribution of taxable income:
                   • For income derived in FY ending 2020, SREITs have until 31 December 2021 to distribute; and
                   • For income derived in FY ending 2021, SREITs have until 31 December 2021 or 3 months after end of FY2021, whichever is later, to distribute

 19 June 2020      Phase Two easing of circuit breaker measures – Most retail businesses allowed to re-open their physical outlets, subject to safe distancing measures, capacity limits and other
                   precautionary measures
                                                                                                                                                                                                     25
Overcoming the COVID-19 Headwinds
Exercising extra prudence while keeping focus on the long term
• Added boost of resilience from newly-acquired MBC II
Enlarged exposure to burgeoning technology sector from 5.1% to 18.5%
Diversification of income streams
Long-term
resilience • Well-diversified portfolio expected to continue to derive stable cashflows from
high quality tenants
Top ten tenants contribute ~27.9% of gross rental income
Best-in-class assets will continue to appeal well to high quality and reputable MNC tenants
• Managing costs proactively and responsibly
Re-prioritising capital expenditures and enhancement works
Proactive asset
Enhancing operational efficiencies
management
• Committed to the long-term health of the retail eco-system by rolling out one of the
most comprehensive tenant support packages
• Prioritising financial flexibility and liquidity
Enhanced S$321.0 million of cash and undrawn committed facilities in place as at 31 March 2020
financial
Further secured facilities for refinancing due in August 2020 and April 2021
flexibility
S$43.7 million of distribution by way of capital allowance claims and capital distribution retained in
4Q FY19/20 as additional reserve for rainy days
26Overcoming the COVID-19 Headwinds (cont’d)
Rental rebate for eligible retail tenants raised to 100% of fixed rent for the period
during Phase One: Safe Re-Opening when most retailers were still restricted from operating1
24 February 2020 26 March 2020 22 April 2020 22 June 2020
1st round: 2nd round: 3rd round: 4th round:
~S$11 million Support ~S$18 million Support Rental Waiver Support ~S$6 million Support Package
Package Package
Key Feature:
Key Feature: Key Feature: Key Feature: Raise rental rebate for eligible
Average rental rebate of ~0.5 Average rental rebate of ~2 Waiver of fixed rent for April tenants from 50% to 100% of fixed
months fixed rent for eligible months fixed rent for eligible 2020 for eligible tenants rent during Phase One: Safe Re-
tenants tenants opening period1
Eligible tenants would receive in total ~3.8 months2 of rental rebates to offset rent
from March to July 2020, allowing them to plan ahead
February March April May June July
7 February 2020 23 March 2020 7 April – 1 June 2020 2 June 2020 From 19 June 2020
Government raised No entry or transit Circuit breaker period Easing of circuit breaker Further easing of circuit breaker
DORSCON level through Singapore • All non-essential industries and retail Phase One: Phase Two: Safe Transition –
from yellow to for all short-term shall be closed Safe Re-opening – most businesses allowed to resume
orange visitors • The public is required to stay at home majority of business operations
unless for essential services continued to be closed (Phase Three easing of circuit
breaker to be announced)
1. Previously waiver of 50% of fixed rent for the month of June 2020 for eligible retail tenants as announced on 26 March 2020. The increase in rental rebate to 100% of fixed rent will be pro-rated
for the period during Phase One: Safe Re-opening.
2. Refers to assistance for eligible retail tenants granted and/or announced to date, and includes the passing on of property tax rebates from the government for qualifying commercial properties
(equivalent to approximately 1.1 months of fixed rent) as well as the additional cash grant to qualifying Small and Medium Enterprises (“Qualifying SMEs”) in accordance to the COVID-19
(Temporary Measures) Act, subject to notification by the Inland Revenue Authority of Singapore as to the eligibility of such qualifying SMEs, as well as fulfilment of such other criteria as may be
prescribed under the Act. MCT would also fully pass on the property tax rebates from the Government to qualifying office and business park tenants.
27Precautionary COVID-19 Measures at VivoCity
Stringent measures to safeguard the well-being
of our shoppers, tenants, staff and the local community
Our safe distancing measures focus on:
• Educating shoppers on safe distancing through
informational posters and notices
• Reminding shoppers on best practices via visual Reminder on media panels
markers and regular safety announcements over
the PA system
• Regulating flow of shoppers and dispersing
crowds Mall ambassadors to guide
Floor markers and remind shoppers
VivoCity is the first shopping mall in Singapore to deploy a
thermal scanner that can conduct temperature screening Informational posters to remind shoppers
efficiently, thus minimising potential bottlenecks on the importance of safe distancing
28Precautionary COVID-19 Measures at VivoCity (cont’d)
Precautionary and safe distancing measures in the mall
Queue management with floor markers Queue management at checkout
Queue management outside shop entrance Temperature screening at shop entrance
Note: With the government’s implementation of the “circuit breaker” measures nationwide from 7 April 2020, VivoCity has temporarily closed all non-essential retail stores and
services in accordance to regulations, until further notice
29Completed Acquisition of MBC II
Alexandra PrecinctMapletree Business City (Phase 2) and the Common Premises
Premium campus-style environment with
Grade A building specifications
Closest business park to the CBD
Attractive to modern and high quality
tenants
Stable cashflows with embedded rental
growth
Prime beneficiary of the Greater Southern
Waterfront Development
Completes MCT’s control over the entire
Alexandra Precinct
31Adds Another Best-In-Class Asset to MCT’s Portfolio
Property Overview
Mapletree Business City (Phase 2) located at
40, 50, 60, 70 and 80 Pasir Panjang Road, including the Year of 2016
common property (carpark, landscape areas, driveways Completion (Common Premises were completed in 2010)
and walkways)
The Property
Common Premises comprising the common carpark, multi-
purpose hall, retail area and common property (including Agreed Property
the landscape areas, driveways and walkways) located at S$1,550 million
Value
10, 20, 30 Pasir Panjang Road
Savills: S$1,552 million CBRE: S$1,560 million
Business Park: Business Park:
Valuation
S$1,520 million S$1,530 million
Retail: S$32 million Retail: S$30 million
99 years leasehold commencing
Land Tenure
1 October 1997
1,184,704 sq ft
Net Lettable Area
Business Park: 1,167,106 sq ft
(“NLA”)
Retail: 17,598 sq ft
Average Passing
S$6.15 psf per month1
Rent
Committed
99.4%1
Occupancy
Weighted
Average Lease 2.9 years2
Expiry (“WALE”)
Land Area of Mapletree Business Licensed Premises 1. As at 31 August 2019.
Mapletree Business City City (Phase 2) to MCT 2. By Gross Rental Income as at 31 August 2019.
32Successful Acquisition of MBC II
Acquisition was financially accretive and further strengthened MCT’s portfolio
NPI Yield NAV per Unit
(%) (S$)
1.8
4
1.75
2 1.75
5.1
3
1.71
4.7
1 1.7
1.65
1.6
1.55
3 1.5
Existing Properties MBC II Existing Properties Enlarged Portfolio
1. Based on NPI for the financial year ended 31 March 2019 over the value of the existing properties as at 31 August 2019
2. Based on the annualised NPI (for financial year ended 31 March 2020) without taking into account the effect of amortisation of rental income for fit-out periods and the agreed property value of
S$1,550.0 million
3. Based on the NAV as at 31 March 2019 and adjusted for the change in valuation of the existing properties from 31 March 2019 to 31 August 2019
4. As at 31 March 2020
33Successful Acquisition of MBC II (cont’d)
Equity Fund Raising of S$918.5 million garnered strong support from existing and new investors
Increased market capitalisation and free float
Agreed Property Increased investor demand MCT officially added into
S$1,550.0 million
Value from enhanced index MSCI Singapore Index on
representation 26 November 2019
Total Acquisition
Approx. S$1,575.7 million
Costs
Market Capitalisation and Free Float
9000 (S$ million)
Private placement of 200.9 million new units at 7,9023
S$2.28 per unit, 7.0x covered 8000
Equity Fund
Raising
Preferential offering of 205.6 million new units at 7000
S$2.24 per unit, 1.45x covered
6,0811
6000
Debt Funding S$670 million with 5/6/7-year average tenure
5000 5,352
Completion 1 November 2019
4000 3,998
3000
2000
2,550
1000 2,083
(32.3%)
(34.3%)
0 2
As at Latest Practicable Date As at 31 December 2019
Free Float Sponsor’s Stake
1. Based on 2,895.6 million Units in Issue as at the Latest Practicable Date and the illustrative issue price
of S$2.10 per Unit
2. As at 19 September 2019, referencing Circular dated 27 September 2019
3. Based on 3,306.5 million Units in Issue and Unit Price of $2.39 as at 31 December 2019
34Key Benefits of MBC II Acquisition
1 Adds another Best-in-Class Asset to MCT’s portfolio
2 Beneficiary of Decentralisation and Flight to Quality
3 Further Stabilises and Enhances MCT’s Income Streams
4 Financially Accretive
5 Increases Free Float and Liquidity, and Enhances Index Representation
35Active Asset Management to
Create Value
VivoCityVivoCity – Steady Track Record
VivoCity Annual Tenant Sales (S$ million)
Largely due to
COVID-19 impact
in 4Q FY19/20
1000.0 951.8 958.2
939.2 939.1
905.9 908.9 907.1
900.0 858.1
827.5
800.0 761.1
700.0 677.4
600.0
500.0
400.0
300.0
200.0
100.0
0.0
FY09/10 FY10/11 FY11/12 FY12/13 FY13/14 FY14/15 FY15/16 FY16/17 FY17/18 FY18/19 FY19/20
37VivoCity – Steady Track Record (cont’d)
VivoCity Annual Shopper Traffic (million)
Largely due to
COVID-19 impact in
4Q FY19/20
60.0
55.8 55.0 55.2
53.2 53.9 53.2 53.2
51.6 51.5
50.0
44.7
40.1
40.0
30.0
20.0
10.0
0.0
FY09/10 FY10/11 FY11/12 FY12/13 FY13/14 FY14/15 FY15/16 FY16/17 FY17/18 FY18/19 FY19/20
38Continued Enhancements at VivoCity
1st AEI : Created 15,000 sq ft of 4th AEI: Added a 32,000 sq ft library on L3 + 24,000 sq ft of
higher-yielding retail space on B1 NLA to extend B1 + new escalator connecting B1, B2 and L1
VivoCity’s Opening of and yielded ~25% ROI on S$5.5 + other M&E works. Yielded over 10% ROI on S$16.0 mil
Official Opening Resorts World Sentosa mil of capex1 capex1
2006 2007 2010 2011 2015 2016 2017 2018 2019
Opening of Sentosa Express Opening of Circle Line at 2nd AEI : Rejuvenated B2, 3rd AEI: Converted 9,200 sq ft 5th AEI: Changeover of
monorail on L3 HarbourFront Station increased F&B kiosks from 13 to 21 of lower to higher-yielding hypermarket and partial
and added popular steamboat spaces on L1 & 2 and yielded recovery of anchor space. To
restaurant on L3, yielding ~20% ~29% ROI on S$3.0 mil deliver >40% of ROI on currently
ROI on S$5.7 mil of capex1 capex1 estimated S$2.2 mil capex1 in
addition to positive rental uplift
1. Return on Investment (“ROI”) on capital expenditure (“capex”) on a stabilised basis.
39VivoCity – Latest Completed 5th AEI
Fully completed the changeover of hypermarket and recovery of anchored space in 2Q FY19/20
Entire exercise delivered positive rental uplift and ~40% ROI1
Singapore’s leading grocer and multi-format retailer, NTUC FairPrice, took up approximately 91,000
square feet of space spanning L1 and B2, and introduced its largest and most innovative FairPrice Xtra
hypermarket and Unity pharmacy, as well as Cheers convenience store
24,000 square feet of anchored space on L1 and B2 recovered to accommodate new/expanding
tenants
Delivered financial benefits, added a refreshed concept and widened VivoCity’s offerings
Level 1 Basement 2
Money
Changer
1
NTUC FairPrice’s opening ceremony on 6 August 2019
91,000 square feet 24,000 square feet
1. On a stabilised basis and based on approximately S$2.2 million of capital expenditure
40VivoCity – Latest Completed 5th AEI (cont’d)
Delivered financial benefits, added a refreshed concept and widened VivoCity’s offerings
FairPrice Xtra Recovered Anchored Space (L1 and B2)
Bright and spacious B2 entrance Farm-to-Table: Live Seafood Display
Wider F&B selections with halal as well as popular mid-ranged
family-oriented offerings
In-door Farming: Freshly Grown Vegetables
Existing tenant, Uniqlo, expanded from 10,700 sq ft to 19,000 sq ft
Specialty Coffee Corner Food Preparation Services at The Kitchen and was re-opened in Sep 2019
41VivoCity – Singapore’s Largest Shopping Mall Library –
library@harbourfront
Designed to suit all ages and integrated with interactive technology
Relevant and well-placed addition to complement VivoCity’s offerings
Modern design with a sweeping view of Sentosa
First-ever makerspace for Extensive collection of books
children in a public library Immersive storytelling space and electronic resources
42VivoCity – Rigorous Tenant Mix Management
Introduced a wide variety of well-loved offerings
updated
A new concept by Paradise Dynasty A tasty beef, vegan and vegetarian burger bar from Munich
A gourmet concept combining café and A leading retailer of home fragrance, Offering authentic and delicious
retail for fine foods body and bath products Chinese cuisine
Note: The above only represents a portion of tenants that were introduced in FY18/19.
43VivoCity – New And Larger Format Concept Stores
VivoCity has been a beneficiary of the retail consolidation trend
Several existing tenants have expanded to improve store efficiency
Uniqlo reopened at VivoCity with a bigger Largest store in Singapore reopened in May 2018,
flagship store on 12 September 2019 carrying its complete collections for women, men and kids
Reopened its flagship store with improved Expanded to include its first Superdry Introduced its full-scale concept store
product displays Sport product line in Singapore that includes its food hall and café
44VivoCity – Focusing on Families and Children
Enlarged entertainment offerings for all
Vibrant indoor and outdoor play area enjoyed by families with children
Timezone’s flagship gaming arcade spanning 11,800 square feet
Exciting family-oriented games Bowling Alleys Bumper Cars
20,000 square feet of outdoor Play Court on Level 2
Hide-and-seek Outdoor Play Court Outdoor Water Fountain
45VivoCity – Focusing on Families and Children (cont’d)
Specially for children aged 3 to 12 years old, VivoCity Kids Club members get to enjoy an
exclusive world of fun, excitement and great offers all year round
Launched in June 2017
Over 28,000 registered kids members as at 31 March 2020
Targeted at families with young children and gives shoppers more reasons to visit VivoCity
Kids Club 2nd Anniversary – Holiday Carnival
Attractive carnival games Thoroughly enjoyed by families
Halloween Party
Promotional Gift-with-Purchase Bubble Show by the Bubbly Witch Engaging performances
46VivoCity – Diverse Mix of Exciting and Large-Scale Events
Utilising VivoCity’s unique physical attributes to host iconic and
exciting shopper events to drive footfall and sales
Curious Alice In Wonderland-Themed Lantern Installation Exclusive LEGO Movie 2 Event
on Level 3 Sky Park to celebrate Mid-Autumn Festival 2019 at VivoCity’s Atrium VivoCity’s First Outdoor Skating Rink
10-metre tall Mickey Mouse and
Minnie Mouse installation: Largest
lantern sculpture in the Asian Book The world’s only full-scale model of Singapore Navy’s Golden Jubilee event
of Records Batman’s Knightcrawler attracted more than 115,000 visitors
47VivoCity – Enhancing Shoppers’ Experience
Convenience at shoppers’ fingertips
Free WiFi for visitors
Mobile-charging kiosks
@ Basement 2 and Level 1 Interactive e-Directories Interactive e-Directories
48VivoCity – VivoCity SG App & VivoRewards
A free one-stop mobile application that delivers convenience to shoppers
Check available parking spaces in advance,
manage membership statuses and earn
VivoRewards with minimum hassle
Get exclusive updates on VivoCity’s events,
promotions and other great deals
Unlimited WiFi access when you connect in-app
Simple and easy-to-use user interface
VivoCity SG App VivoRewards kiosk at B1
49Singapore’s Largest Multi-Dimensional Retail
and Lifestyle Destination
A multiple-award winning destination mall
Expat Living Reader’s Choice 2020 – Singapore Retail Association 2016 – Best Retail Event
Best Shopping Centre – Silver of the Year for “Star Wars: The Force Awakens” event –
Finalist
BCA Green Mark Certification – Platinum
AsiaOne’s People’s Choice Awards 2016 –
Marketing-Interactive PR Awards 2019 – Best Shopping Centre – Finalist
Best Event-Led PR Campaign for “Disney Tsum Tsum
Mid-Autumn Celebration of Love” event – Silver BCA Green Mark Certification 2016 – Gold
Expat Living Reader’s Choice 2019 – Her World x Nuyou Mall Awards 2016 – Best Mall
Best Shopping Centre – 2nd Place (South)/ Best Dining Mall (South)/ Best Lifestyle Mall
Trip Advisor 2017 – Certificate of Excellence Singapore Mother & Baby Award 2015 – Most Family-
Friendly Shopping Mall
50Resilient Office/Business Park Properties
Active management to create value
Proactive retention and early engagement of quality tenants to secure renewals with strong
emphasis on preserving cashflows
Active management to retain attractiveness of buildings
Completed upgrading of common areas and toilets at office floors
Upgrades at PSA Building:
Before: Lift Lobby After: Lift Lobby
Newly-installed
Before: Toilets After: Toilets Self Registration Kiosks
514Q and FY19/20
Results Highlights
VivoCityKey Highlights
Financial Performance
4Q FY19/20 gross revenue and net property income (“NPI”) up 12.8% and 12.6%
respectively from 4Q FY18/19, driven mostly by Mapletree Business City (“MBC”) II and in
spite of COVID-19 rental rebates
4Q FY19/20 DPU of 0.91 Singapore cents in anticipation of uncertainties arising from
COVID-19 pandemic
Acquisition of MBC II provided timely diversification and resilience, driving 8.8% and 8.7%
year-on-year growth in FY19/20 portfolio gross revenue and NPI
Full year DPU totalled 8.00 Singapore cents
Valuation of investment properties held steady at S$8.9 billion
Portfolio Performance
Full year shopper traffic and tenant sales at VivoCity lower by 6.8% and 3.4% respectively
largely due to COVID-19 impact in 4Q FY19/20
Portfolio maintained 98.7% committed occupancy
53Key Highlights
Mitigating Impact from COVID-19
To provide additional assistance, fixed rent for April 2020 will be waived for eligible retail
tenants1. This is on top of the S$29 million of relief packages that have been
granted/committed to support our retail tenants
To safeguard the well-being of our shoppers, tenants, staff and the local community,
measures have been implemented to educate, remind and regulate safe distancing within
our premises
Capital Management
Maintained strong balance sheet through prudent and active capital management
All term loans due in FY19/20 were refinanced in advance
Well-distributed debt maturity profile with no more than 17% of debt due for
refinancing in any financial year
Financial flexibility from S$321.0 million of cash and undrawn committed facilities
1. This rental waiver replaces the deferment of payment for the fixed rent of April 2020 that was announced on 26 March 2020
544Q FY19/20 Financial Scorecard
4Q FY19/20 gross revenue and NPI up 12.8% and 12.6% respectively
Driven mostly by MBC II and in spite of S$8.8 mil1 COVID-19 rental rebates to retail tenants
S$’000 unless otherwise stated 4Q FY19/20 4Q FY18/19 Variance
Gross Revenue 127,320 112,899 12.8%
Property Operating Expenses (28,749) (25,339) 13.5%2
Net Property Income 98,571 87,560 12.6%
Net Finance Costs (21,702) (17,465) 24.3%3
Distributable amount before capital
allowance claims and capital distribution 73,851 66,861 10.5%
retention
Amount available for distribution 30,0984 66,861 55.0%
Distribution per Unit (cents) 0.91 2.31 60.6%
1. Includes 15% property tax rebates for qualifying commercial properties from the Government
2. Mainly due to property operating expenses of MBC II, lower property maintenance expenses, property taxes and property management fees offset by higher
marketing and promotion expenses incurred by existing properties
3. Mainly due to the interest expenses of Mapletree Business City LLP (“MBC LLP”) and higher commitment fees incurred
4. S$43.7 million of distribution was retained by way of capital allowance claims and capital distribution retention in 4Q FY19/20
55FY19/20 Financial Scorecard
Acquisition of MBC II provided timely diversification and resilience
Supporting 8.8% and 8.7% year-on-year growth in FY19/20 gross revenue and NPI
S$’000 unless otherwise stated FY19/20 FY18/19 Variance
Gross Revenue 482,825 443,893 8.8%
Property Operating Expenses (104,885) (96,266) 9.0%1
Net Property Income 377,940 347,627 8.7%
Net Finance Costs (77,974) (69,348) 12.4%2
Distributable amount before capital
allowance claims and capital distribution 287,587 264,027 8.9%
retention
Amount available for distribution 243,2183 264,027 7.9%
Distribution per Unit (cents) 8.00 9.14 12.5%
1. Mainly due to property operating expenses of MBC II, higher staff costs, utilities expenses, property taxes and marketing and promotion expenses offset by
lower property maintenance expenses incurred by existing properties
2. Mainly due to the interest expenses of MBC LLP, interest expenses incurred on bridging loans drawn down to accelerate the completion of MBC II
Acquisition and additional loans drawn down for working capital requirements, as well as higher commitment fees incurred. This was partially offset by lower
interest costs from early refinancing of term loan facilities in FY18/19
3. S$43.7 million of distribution was retained by way of capital allowance claims and capital distribution retention in 4Q FY19/20
56Financial Scorecard of Existing Properties1
Existing properties registered modest performance in FY19/20
S$’000 unless 4Q 4Q
Variance FY19/20 FY18/19 Variance
otherwise stated FY19/20 FY18/19
Gross Revenue 104,665 112,899 7.3% 445,288 443,893 0.3%
Property Operating
(24,329) (25,339) 4.0% (97,586) (96,266) 1.4%
Expenses
Net Property Income 80,336 87,560 8.3% 347,702 347,627 -
1. Refers to VivoCity, MBC I, PSA Building, Mapletree Anson and MLHF
57Balance Sheet
Investment properties up 26.7% mainly due to acquisition of MBC II
NAV per Unit up 9.4% to S$1.75
As at As at
S$’000 unless otherwise stated
31 March 2020 31 March 2019
Investment Properties 8,920,000 7,039,000
Other Assets 87,073 61,765
Total Assets 9,007,073 7,100,765
Net Borrowings 3,008,020 2,350,137
Other Liabilities 212,105 134,649
Net Assets 5,786,948 4,615,979
Units in Issue (’000) 3,307,510 2,889,690
Net Asset Value (“NAV”) per Unit (S$) 1.75 1.60
58Key Financial Indicators
Strong balance sheet through prudent and active capital management
Every 25 bps change in Swap Offer Rate estimated to impact DPU by 0.05 cents p.a.
As at As at As at
31 March 2020 31 December 2019 31 March 2019
Total Debt Outstanding S$3,003.2 mil S$3,014.2 mil S$2,349.0 mil
% Fixed Rate Debt 78.9% 75.3% 85.0%
Gearing Ratio 33.3%1 33.4% 33.1%
Interest Coverage Ratio (YTD) 4.3 times 4.4 times 4.5 times
Average Term to Maturity of Debt 4.2 years 4.4 years 3.6 years
Weighted Average All-In Cost
2.94% 2.96%3 2.97%
of Debt (p.a.)2
Unencumbered Assets as %
100% 100% 100%
of Total Assets
MCT Corporate Rating
Baa1 Baa1 Baa1
(by Moody’s)
1. Based on total gross borrowings divided by total assets. Correspondingly, the ratio of total gross borrowings to total net assets is 51.9%
2. Including amortised transaction costs
3. Annualised based on YTD ended 31 December 2019
59Debt Maturity Profile (as at 31 March 2020)
Financial flexibility from S$321.0 mil of cash and undrawn committed facilities
Well-distributed debt maturity profile with no more than 17% of debt due in any financial year
Total gross debt: S$3,003.2 mil
All term loans due in FY19/20 have been refinanced in advance
600
Bank Debt
Medium term notes (“MTN”)
500
Refinanced Debt
400
All term
Gross Debt (S$ mil)
loans due 314.0
in FY20/21
have been
300
refinanced 325.0
in advance 369.3 170.0
125.9 419.0
200 245.9
250.0
100 200.0
160.0 175.0
120.0 100.0
70.0 85.0
0
FY19/20 FY20/21 FY21/22 FY22/23 FY23/24 FY24/25 FY25/26 FY26/27 FY27/28 FY28/29 FY29/30
% of
Total Debt - 5% 15% 17% 11% 15% 14% 12% 3% - 8%
60Portfolio Revenue and Net Property Income
COVID-19 impact on VivoCity cushioned by MBC and MLHF
Portfolio registered 8.8% and 8.7% growth in full year gross revenue and NPI
Gross Revenue Net Property Income
8.8% 8.7%
482.81 377.9
1
1 347.6 16.2
443.9 20.0 25.1
31.8 15.8
19.7 26.9 37.6
33.6 50.1
38.5 30.2
50.5 37.5
(S$ mil) (S$ mil)
127.1 132.9 104.2 110.1
212.9 210.4 162.3 158.7
FY18/19 FY19/20 FY18/19 FY19/20
VivoCity MBC I MBC II PSA Building Mapletree Anson MLHF
1. Total does not add up due to rounding differences
61Portfolio Occupancy
Portfolio committed occupancy remained high at 98.7%
Occupancy
As at As at as at 31 March 2020
31 March 2019 31 December 2019
Actual Committed
VivoCity 99.4% 99.2% 99.6% 99.7%
MBC I 97.8% 99.7% 96.4% 98.7%
MBC II - 99.4% 99.4% 100.0%
PSA Building 96.4% 89.1% 88.1% 92.7%
Mapletree Anson 96.8% 97.0% 97.8% 100.0%
MLHF 100.0% 100.0% 100.0% 100.0%
MCT Portfolio 98.1% 98.3% 97.1% 98.7%
62FY19/20 Leasing Update
Achieved 5.0% portfolio rental reversion
Number of Leases Retention Rate % Change in
1
Committed (by NLA) Fixed Rents
Retail 148 89.3% 6.7%2
Office/Business Park 23 62.6% 0.7%
MCT Portfolio 171 76.8% 5.0%
1. Based on the average of the fixed rents over the lease period of the new leases divided by the preceding fixed rents of the expiring leases. Rent reviews are
typically not included in the calculation of rental reversions
2. Includes the effect from trade mix changes and units subdivided and/or amalgamated
63Lease Expiry Profile (as at 31 March 2020)
Portfolio resilience supported by manageable lease expiries
WALE Committed Basis
Portfolio 2.6 years1
Retail 2.2 years
Office/Business Park 2.9 years
15.2%
13.9%
As % of Gross Rental Revenue
12.6% 13.1%
10.7%
9.3%
8.1%
6.1% 5.6%
5.5%
FY20/21 FY21/22 FY22/23 FY23/24 FY24/25…
FY24/25
& Beyond
Retail Office/Business Park
1. Portfolio WALE was 2.1 years based on the date of commencement of leases
64VivoCity – Shopper Traffic and Tenant Sales
Full year shopper traffic and tenant sales lower by 6.8% and 3.4% respectively
largely due to COVID-19 impact in 4Q FY19/20
Shopper Traffic (mil) Tenant Sales (S$ mil)1
6.8% 3.4%
60.0
59.0 1000.0 939.1
58.0
57.0 55.2 907.1
56.0
55.0
54.0 51.5 950.0
53.0
52.0
51.0 900.0
50.0
49.0
48.0 850.0
47.0
46.0
45.0 800.0
44.0
43.0
42.0 750.0
41.0
40.0
39.0 700.0
38.0
37.0
36.0 650.0
35.0
34.0
33.0 600.0
32.0
31.0
30.0 550.0
29.0
28.0
27.0
500.0
26.0
25.0
24.0
450.0
23.0
22.0
21.0
400.0
20.0
19.0
18.0
350.0
17.0
16.0
15.0
300.0
14.0
13.0
12.0
250.0
11.0
10.0
9.0
200.0
8.0
7.0
6.0
150.0
5.0
4.0
3.0
100.0
2.0
1.0 50.0
0.0 0.0
FY18/19 FY19/20 FY18/19 FY19/20
1. Includes estimates of tenant sales for a small portion of tenants
65Other Information
VivoCity 66Overall Top 10 Tenants (as at 31 March 2020)
Top tenants contributed 27.9%1 of gross rental income
Tenant % of Gross Rental Income
1 Google Asia Pacific Pte. Ltd. 10.1%
2 Merrill Lynch Global Services Pte. Ltd. 3.0%
3 The Hongkong and Shanghai Banking Corporation Limited 2.9%
4 (Undisclosed Tenant) -
5 PSA Corporation Limited 2.3%
6 Info-Communication Media Development Authority 2.3%
7 SAP Asia Pte. Ltd. 2.0%
8 Unilever Asia Private Limited 1.9%
9 Samsung Asia Pte. Ltd. 1.7%
10 NTUC Fairprice Co-operative Ltd 1.7%
Total 27.9%1
1. Excluding the undisclosed tenant
67Portfolio Tenant Trade Mix (as at 31 March 2020)
Trade Mix % of Gross Rental Income
1 IT Services & Consultancy 18.5%
2 F&B 13.7%
3 Banking & Financial Services 10.8%
4 Fashion 8.0%
5 Shipping Transport 5.8%
6 Government Related 5.5%
7 Fashion Related 4.2%
8 Hypermarket / Departmental Store 3.6%
9 Consumer Goods 3.4%
10 Real Estate 3.3%
11 Beauty 2.9%
12 Electronics1 2.8%
13 Pharmaceutical 2.6%
14 Lifestyle 2.4%
15 Sports 2.1%
16 Electronics2 2.1%
17 Others3 8.4%
Total MCT Portfolio 100%4
1. Refers to tenants in office/business park
2. Refers to tenants in retail
3. Others includes Trading, Energy, Entertainment, Retail Bank, Optical, Insurance, Education, Consumer Services, Medical, Services and Convenience
4. Total does not add up to 100% due to rounding differences
68Sentosa
HarbourFront
HarbourFront
Towers 1 & 2
Centre
VivoCity
St James
Power Station
MLHF
69PSA
Building
MBC
70Downtown MRT
Maxwell Station
MRT Station
(Expected
Completion 2021)
Shenton Way
MRT Station
(Expected
Completion 2021)
Tanjong Pagar
MRT Station
Mapletree Anson
Marina Bay
Station
Prince Edward
MRT Station
(Expected
Completion 2025)
71
Source: www.onemap.com.sg (as at Oct 2019)Pipeline of ROFR Properties
Kent Ridge Park
6 Hortpark
Chinatown
MBC
PSA
BUILDING Mount Downtown
Telok
Faber Outram Ayer
Alexandra
Park Central
Precinct
Pasir VIVOCITY Business
Panjang MLHF Tanjong
Marina District
Pagar
Labrador Bay
Park
MAPLETREE
Telok ANSON
Labrador Blangah 1
3 42 53
Nature Reserve 4 5
HarbourFront
MRT Station
HarbourFront Sentosa Express
Precinct Line
Brani Nature Park
Resorts Island
World MCT Properties
Sentosa Major Expressways
HarbourFront Precinct
1 2 3
HarbourFront Tower Two HarbourFront Tower One SPI Development Site1
NLA: 153,000 sq ft NLA: 368,000 sq ft GFA: 344,000 sq ft
Alexandra Precinct
4 5 6
HarbourFront Centre St James Power Station PSA Vista
NLA: 713,000 sq ft NLA: 66,000 sq ft NLA: 143,000 sq ft
Note: GFA and NLA are as published in Mapletree Investment Private Limited’s Annual Report 2018/2019 and rounded to the nearest thousand sq ft.
1. Known as Proposed Mapletree Lighthouse in MCT’s IPO Prospectus.
72Thank You
For enquiries, please contact:
Teng Li Yeng
Investor Relations
Tel: +65 6377 6836
Email: teng.liyeng@mapletree.com.sg
73You can also read