Marine Environmental Research
←
→
Page content transcription
If your browser does not render page correctly, please read the page content below

Marine Environmental Research 174 (2022) 105532
Contents lists available at ScienceDirect
Marine Environmental Research
journal homepage: www.elsevier.com/locate/marenvrev
Foraging ecology of critically endangered Eastern Pacific hawksbill sea
turtles (Eretmochelys imbricata) in the Gulf of California, Mexico
Lourdes Martínez-Estévez a, *, Diana L. Steller b, Kelly M. Zilliacus a, Juan Pablo Cuevas Amador c,
Felipe Cuevas Amador c, Dorota Szuta b, Scott D. Miller d, Gage H. Dayton a, Bernie R. Tershy a,
Donald A. Croll a
a
Department of Ecology and Evolutionary Biology, University of California Santa Cruz, Santa Cruz, CA, 95050, USA
b
Moss Landing Marine Laboratories, Moss Landing, CA, 95039, USA
c
Isla El Pardito, La Paz, Baja California Sur, Mexico
d
Department of Biological Sciences, Florida State University, Tallahassee, FL, 32306, USA
A R T I C L E I N F O A B S T R A C T
Keywords: The Eastern Pacific hawksbill sea turtle population is one of the most endangered of all sea turtle species. Here,
Foraging ground we examine the foraging ecology of 47 hawksbill turtles (40.5–90.3 cm CCL, mean = 54.1 ± 10.1 cm) around Isla
Marine protected area San José, Gulf of California, Mexico by integrating information from passive acoustic telemetry, behavior re
Estuary
cordings, fecal analysis, and habitat surveys. Tagged hawkbill turtles exhibited high site fidelity over months and
Mangroves
Diet
years (tracking duration 1–1490 days, mean = 255 ± 373 days) to the location and benthic habitat where in
Fecal dividuals were initially caught. Diet was dominated by benthic invertebrates and algae including sponges, algae,
tunicates, and mangrove roots. The mean percent cover of these benthic food items was significantly greater in
the mangrove estuary than in adjacent rocky and sandy reef habitats. The Isla San José foraging ground is a high-
use area for hawksbills and should be granted national protection status.
1. Introduction conservation of threatened marine vertebrates has been to identify and
protect these spatially restricted areas of ecological significance to
Globally, large marine vertebrate populations have experienced efficiently mitigate human impacts and slow or reverse population de
unprecedented declines of 50–90% over the past five decades (Jackson, clines (Norse et al., 2005).
2008; McCauley et al., 2015). Conservation of this group is difficult due Sea turtles spend most of their lives in the ocean migrating, mating,
to their large distributional ranges, vulnerable life histories, and expo or foraging (Eckert et al., 1999). Multiple studies have demonstrated
sure to a wide range of anthropogenic threats (Polidoro et al., 2012; long-term fidelity of sea turtles to specific coastal nesting sites, and the
Sequeira et al., 2019). However, despite being highly mobile, many identification and protection of sea turtle nesting sites is a
large marine vertebrates concentrate their activities in restricted areas at well-established conservation strategy (Bjorndal, 1997; Griffin et al.,
specific times during their lifetime for feeding, mating, nesting, or 2019; Miller, 1997; Selby et al., 2019). In contrast, less attention has
offspring rearing. For some species, these areas are highly productive, been focused on the protection of sea turtle foraging areas. A number of
dynamic regions created by complex and dynamic oceanographic pro sea turtle studies have demonstrated long-term fidelity to specific
cesses that vary in time and space. For other species, like sea turtles, foraging sites (Broderick et al., 2007; Martínez-Estévez et al., 2021;
concentrations often result from geographically fixed features, particu Piper, 2011; Shimada et al., 2016). For example, Shimada et al. (2019)
larly along the coast that produce exceptional reproduction or feeding found that migrating sea turtles of four different species (green (Chelonia
opportunities (Ceriani et al., 2017; Fuentes et al., 2019; Gaos et al., mydas), loggerhead (Caretta caretta), hawksbill (Eretmochelys imbricata),
2017). Because human populations are concentrated along coasts, these and flatback (Natator depressus)) always returned to their home coastal
coastal features are often subject to an array of anthropogenic impacts foraging sites, even though other suitable feeding areas were available
(Norse et al., 2005). Recognizing this complexity, one strategy for along their migration route.
* Corresponding author.
E-mail address: mmarti72@ucsc.edu (L. Martínez-Estévez).
https://doi.org/10.1016/j.marenvres.2021.105532
Received 15 September 2021; Received in revised form 14 November 2021; Accepted 21 November 2021
Available online 27 November 2021
0141-1136/© 2021 Elsevier Ltd. All rights reserved.
L. Martínez-Estévez et al. Marine Environmental Research 174 (2022) 105532
Sea turtle movement studies have shown that foraging grounds are 2. Materials and methods
generally areas where nutritious food is relatively stable and reliable
(Bjorndal, 1997); often in places with reduced mortality risk from pre 2.1. Study site
dation or extreme weather events (Heithaus, 2013; Lutz and Musick,
1997; Shimada et al., 2016). Selection of foraging grounds may also vary Isla San José is located in the southwestern Gulf of California, 5.7 km
with ontogenetic dietary shifts, availability of preferred food items, food offshore of the Baja California Peninsula (Fig. 1). It is the sixth largest
quality, and intraspecific and interspecific competition (Ferreira et al., island in Mexico, with a total area of 182.9 km2 (Bourillón-Moreno et al.,
2018; Rincon-Diaz et al., 2011; van Dam and Diez, 1998). Therefore, 1988). The southern tip of the island is characterized by a mangrove
understanding the relationship between feeding habits and movements estuary, the second largest along the eastern Baja California Peninsula
within foraging areas can aid in identifying important opportunities for (1.09 km2, hereafter San José mangrove estuary), a sandy bottom
sea turtle spatial protection and conservation. embayment external to the estuary with small patches of rocky boulder
One of the most threatened sea turtle species is the hawksbill turtle, substrate (hereafter Amortajada sandy reef), and a rocky
which has experienced an 80% global decline in nesting numbers in the semi-contiguous reef habitat south of the mangrove lagoon barrier
last 100 years and is listed as Critically Endangered on the IUCN Red List (hereafter South San José rocky reef; Fig. 1). Although the entire island
of Threatened Species (Meylan and Donnelly, 1999). Hawksbills are is a national protected area, only the mangrove estuary is protected from
distributed worldwide in tropical coastal waters where they are fishing.
considered omnivorous consumers associated with coral reefs, feeding
primarily on reef-associated sponges as well as a variety of other benthic 2.2. Sea turtle capture and tagging
species including tunicates, bryozoans, mollusks, corals, and algae
(Berube et al., 2012; Carrión-Cortez et al., 2013; Gillis et al., 2018; León Between 2014 and 2019, hawksbill sea turtles were captured using
and Bjorndal, 2002; Méndez-Salgado et al., 2020; Meylan, 1988; Rin three methods: live-entanglement nets specifically designed for sea
con-Diaz et al., 2011). The Eastern Pacific population of hawksbills was turtles (118-m long, 5-m deep, and 25-cm stretch monofilament mesh
once thought to be extirpated but is now considered one of the world’s size) checked at regular intervals (ca. every 20 min), strike netting
most endangered (Wallace et al., 2010, 2011). Unlike most other where the entanglement net was deployed from a small skiff to surround
hawksbill populations, Eastern Pacific hawksbills have been found to and capture an individual, and hand capture by free diving at night.
have a strong association with mangrove estuaries, perhaps due to a Turtles were released in the same location where they were initially
paucity of coral reefs in the region (Gaos et al., 2012b; Glynn, 1976). caught. Due to the variety of capture methods, catch per unit effort was
These mangrove habitats are particularly important for both juveniles calculated as the total number of captured hawksbills per habitat
and adults, which have been shown to have restricted home ranges; divided by the total time of each monitoring event, expressed as captures
remaining in the same area for extended periods of time (Blumenthal per hour.
et al., 2009; Ferreira et al., 2018; Martínez-Estévez et al., 2021; Meylan Each captured turtle was measured for straight carapace length
et al., 2011; Pilcher et al., 2014). (SCL), curved carapace length (CCL), straight carapace width (SCW),
Globally, mangroves are one of the most productive coastal ecosys curved carapace width (CCW), body depth, plastron length, total tail
tems, providing a broad array of ecosystem services to coastal commu length and body weight (Eckert et al., 1999). Each turtle was tagged on
nities (Costanza et al., 1997). The Gulf of California, Mexico is the the trailing edge of each rear flipper with Inconel tags (Style 681, Na
northern distributional limit of mangroves in the Eastern Pacific (Val tional Band and Tag Company, Newport, KY). Maturity classes were
derrama-Landeros et al., 2017). These mangrove estuaries serve as determined based on reported mean nesting size (MNS) of the closest
important nursery habitat for commercially important fishes, account major rookery – Bah3a Jiquilisco, El Salvador (MNS = 81.6 ± 3.6 cm
ing for 32% of small-scale fisheries landings in the Gulf (Aburto-Oropeza CCL; Liles et al., 2011). All individuals smaller than MNS were consid
et al., 2008). Recognizing its fisheries importance, the mangrove estuary ered juveniles, whereas those equal to or larger than this threshold were
at Isla San José, Gulf of California, was established as a no-take marine classified as putative adults. Turtles that possessed a differentiated (i.e.,
protected area in 2012 under a collaboration between local fishers, a >20 cm plastron-to-cloaca) tail were classified as putative adult males
local non-profit organization (Sociedad de Historia Natural Niparajá A. regardless of their body size (Wibbels, 1999).
C.), and the National Commission of Fisheries (CONAPESCA). This was Coded acoustic transmitters (V13 and V16, Innovasea Systems Inc.,
one of the first community-designated no-take marine protected areas in Boston, MA, USA) were attached to a marginal posterior scute of
Mexico (Niparajá, 2015). Soon after this designation, sea turtle surveys hawksbill individuals using a 2-part epoxy and following standardized
in this mangrove estuary documented the presence of hawksbill turtles methods (Chevis et al., 2017). All turtles were released at the site of
(Grupo Tortuguero de las Californias A.C., personal communication), initial capture. Each transmitter emitted a series of pings at 69 kHz, not
providing a unique opportunity to study the foraging ecology of Eastern harmful for sea turtles, with a unique ID number to allow for individual
Pacific hawksbills in a location with reduced human impact. identification (Ridgway et al., 1969).
In this study, we examine the foraging ecology of hawksbill sea
turtles in the Isla San José mangrove estuary using; 1) acoustic trans 2.3. Acoustic monitoring
mitters to determine long-term habitat use, 2) video recordings using
turtle-borne video cameras to identify short-term foraging behaviors To investigate the fine-scale movements of tagged hawksbill in
and preferred food items, 3) opportunistic fecal collection and analysis dividuals within the San José estuary a fixed array of acoustic stations
to identify ingested food items, and 4) benthic habitat surveys to (receiver models VR2W and VRTRX, Innovasea Systems Inc., Boston,
compare food availability inside and outside the mangrove estuary. This MA, USA) were placed across the study site (Fig. 1). The array included
research provides data on the importance of mangrove estuaries for the mangrove estuary and the outside habitats (Amortajada sandy reef
hawksbill sea turtles, and baseline data that can be used to develop and South San José rocky reef) to provide greater coverage area. The
localized conservation strategies to help with the recovery of this en total number of receivers (minimum 5 and maximum 10) and location
dangered population. varied each field season based on the acquisition of new receivers, the
loss of existing ones, and adjustments due to sea turtle movements
(Fig. 1). All study areas had at least one receiver throughout the study.
The initial array contained five receivers deployed in June 2014, fol
lowed by seven deployed in June 2016, 10 deployed in June 2017, six
deployed in June 2018, and seven deployed in June 2019. Distance
2
L. Martínez-Estévez et al. Marine Environmental Research 174 (2022) 105532
Fig. 1. Study site around southern Isla San
José, Mexico including location of acoustic
receivers (yellow circles), fecal finds (red
circle), and capture locations (squares).
Station codes: A – Amortajada, AS – Amor
tajada South, E1 – Estero 1, E2 – Estero 2, E3
– Estero 3, E4 – Estero 4, LE – Lagoon East,
LW – Lagoon West, SJS – San José South,
SJSW – San José South West. (For interpre
tation of the references to colour in this
figure legend, the reader is referred to the
Web version of this article.)
between receivers was at least 300 m (mean = 1423 ± 925 m, range = m. and the camera was recovered the next day. Video recordings were
300–3540 m) to avoid overlapping detections and receivers had 15 analyzed using BORIS, a free Behavioral Observation Research Interac
months of battery life. Detections (tag ID, date, time) from each receiver tive Software (Friard and Gamba, 2016). We defined four behavior
were downloaded every June from 2015 to 2019, and in November types: locomotion – the turtle swam to the surface to breathe or moved
2020. Prior to analysis, detections were examined, and false detections from one place to another at a constant pace; resting – the turtle
were rejected using the criteria established by the manufacturer (Pin remained stationary on the seafloor; searching – the turtle actively
cock, 2012). Only turtles detected more than 10 days within the array searched for benthic food items; and feeding – the turtle actively
were included in the analysis. ingested food items (Supplementary Video). Data were analyzed to
Movements of hawksbill turtles were analyzed by calculating three compare differences in the total time invested in each of the behaviors
metrics of residence and displacement: overall residency, habitat fidel using a Wilcoxon/Kruskal-Wallis with comparisons for each pair (JMP
ity, and maximum displacement. Overall residency and habitat fidelity Pro 15.0.0, SAS Institute Inc.). Food items were identified whenever
were assessed through two indices calculated by dividing the positive possible based on dominant categories observed in habitat surveys.
days an individual was detected within the array, and at each station, by Supplementary video related to this article can be found at https://
the total days at liberty (i.e., total days of the months the turtle was doi.org/10.1016/j.marenvres.2021.105532
detected; March et al., 2010; Udyawer et al., 2018). Overall Residency
Index (ORI) and Habitat Fidelity Index (HFI) values ranged from 0 (ab 2.5. Fecal analysis
sent) to 1 (permanently present) with 0.5 established as the lower limit
for high residency (Novak et al., 2020). The maximum displacement (in Turtle feces were initially located during habitat survey dives, then
km) was calculated by the straight-line distance between the opportunistically collected in situ from a single sloped coral-rubble area
detection-positive stations during the entire monitoring period for each within the San José estuary during focused search dives (Fig. 1; Sup
turtle. The analyses were performed in Rstudio (v. 1.1.463), using the plementary Fig. 1). Collected samples were photographed and fixed in a
Vtrack package (Campbell et al., 2012; Udyawer et al., 2018). 5% formalin solution and transferred into ethanol for long-term pres
ervation. For analysis to determine percent composition of dominant
2.4. Behavioral recordings categories of potential turtle food, each fecal sample was gently ho
mogenized and spread evenly on a gridded 14-cm diameter clear Petri
A forward facing video camera harness was custom-built for short- dish to form one thin layer over the bottom. Each Petri dish had 24 intact
term deployment (≤24 h) on hawksbill sea turtles captured within the squares measuring 2 cm × 2 cm. Five squares were selected per dish
mangrove estuary and situated on the leading edge of each turtles’ using a random number generator and within each square the percent
carapace to record foraging bouts. The harness was equipped with a spatial coverage of identifiable material was estimated to the lowest
corrodible magnesium link (International Fishing Devices Inc., Ocean possible taxon. Taxa were subsequently grouped into more general prey
side, CA, USA) and a GoPro camera (Hero 3+ Black, GoPro, Inc., San item categories (i.e., mangrove, algae, sponge, tunicate, other inverte
Mateo, CA, USA) to facilitate the recovery of the video camera (Thomson brate, and sediment) for quantitative analyses.
and Heithaus, 2014). Each forward facing camera was programmed to
record 30 s videos every 5 min using a time lapse intervalometer 2.6. Habitat surveys
(CamDo Solutions, Vancouver, BC, Canada), for a total of 12 video
sessions per hour. Turtles equipped with cameras were released at 10 a. Between 2016 and 2019, in June, benthic surveys were conducted in
3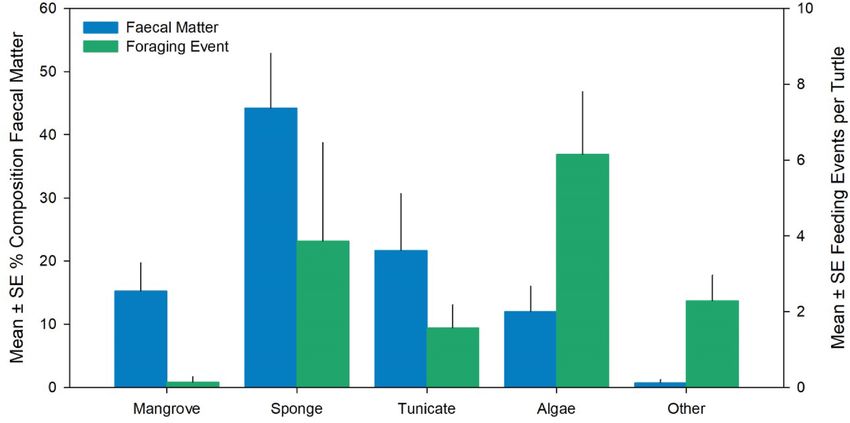
L. Martínez-Estévez et al. Marine Environmental Research 174 (2022) 105532
the San José estuary, the Amortajada sandy reef, and the South San José Kramer HSD for multiple comparisons (α = 0.05; JMP Pro 15.0.0, SAS
rocky reef to compare available food abundance in foraging habitats. Institute Inc.).
Stratified within each habitat to estimate food availability on the hard To estimate the abundance of mangrove associated potential turtle
substrates, transects were distributed systematically, with 30–60 m food items, the biomass of common algae and invertebrates were
transects (depending upon sampling constraints) deployed across the sampled on mangrove roots and shoots in two locations: the main
benthos at each location from shallow depth (~1 m; Fig. 2). channel and the lagoon of the San José estuary, in 2019. At each location
Within the San José estuary two subareas were identified: chan multiple sectors were selected (15 total), and three roots were sampled
nel—the mangrove lined channel area where water flowed tidally into per sector. Roots were collected starting 50 cm below the leaves, and the
and out of the lagoon, and lagoon—large lake-like area lined with biomass of all epibiota was removed. Wet weight biomass was measured
mangroves. The lagoon maintains water continuously even at low tide. individually for each root after placing all material in a mesh bag and
Channel transects started in approximately 1 m depth under the man spinning 10 times manually to remove excess water. Due to the variation
groves on one side, spanned the channel, and ended across the channel in root length (mean range = 41.0 ± 10.2 to 71.7 ± 14.4 cm), we
under the mangroves on the other side; only the first and last 10 points calculated a mean biomass of available forage food (g) per meter of root
(10 m) at either edge of the mangrove were used in the analysis (i.e., the sampled.
channel center was excluded due to continuous bare sand cover).
Lagoon transects were conducted perpendicular to shore, initiating 3. Results
either at the mangrove edge or on an extensive flat sandy area, and
extended into the lagoon across the dominant coral rubble substrate to 3.1. Sea turtle capture and tagging
the point where the last 5 m of the transect were sand or silt. Outside the
estuary, Amortajada sandy reef habitat transects were conducted Between 2014 and 2019, we conducted 107 total captures of 64 in
perpendicular to shore and out into the bay to a maximum of 60 m or dividual hawksbill turtles (i.e., some individuals were captured multiple
5–10 m of continuous bare sand cover, and all South San José rocky reef times). Turtle curved carapace length ranged from 35.1 to 90.3 cm
transects were 60 m in length and perpendicular to shore. (mean = 51.7 ± 10.1 cm) and mass ranged from 5 to 68 kg (mean = 14.7
For each transect, uniform point contact estimates of substrate and ± 10.3 kg). Ninety-seven percent of individuals (62 of 64) were juve
primary and secondary benthic cover as well as depth were recorded at niles, based on either carapace length or tail length (Fig. 3). We deter
1 m intervals. Substrate categories include bivalve, live coral, dead mined the sex of the two putative adults to be female. From all the
coral, mangrove root, coralline red algal rhodolith, shell, silt, sand, captured hawksbills (N = 64), 38 individuals were only captured once,
gravel (0.5–1 cm), rock (1 cm-1m), reef (>1 m). Primary and secondary 16 individuals were captured twice (recaptured once), four were
benthic cover categories were red, green and brown algae, seagrass, captured 3 times (recaptured twice), five were captured 4 times
blue-green algal/diatom mats, and invertebrates, identified to species (recaptured three times), and one was captured 5 times (recaptured four
when possible. times). For recaptures, the interval between the first capture and
For analyses, we calculated the percent cover of benthic items per recapture varied from 1 month to 4 years.
transect. We calculated the mean across replicate transects for each of The number of turtles captured varied with respect to the habitat.
the three habitats (estuary, sandy reef, rocky reef), tested for normality Overall, 75 captures occurred in the San José estuary (CPUE mean = 1.3,
and transformed when necessary. We then compared the mean percent SE = 0.2; curved carapace length range 38.7–90.3 cm, mean = 52 ±
cover between the three habitats using a one-way ANOVA with Tukey- 10.8 cm), followed by 22 at Amortajada sandy reef (CPUE mean = 0.3,
Fig. 2. Benthic transect distribution by habitat type around Isla San José, Mexico.
4
L. Martínez-Estévez et al. Marine Environmental Research 174 (2022) 105532
Fig. 3. Size distribution of hawksbill sea turtles caught at Isla San José, Mexico between 2014 and 2019.
SE = 0.1; curved carapace length range 39–66.8 cm, mean = 51.8 ± distance, which ranged between 0 and 8.2 km (mean = 2.6 ± 2.8 km;
10.2 cm), and 10 at South San José rocky reef (CPUE mean = 0.2, SE = Table 3). Eleven turtles had a displacement distance value of 0, indi
0.1; curved carapace length range 35.1–64.9 cm, mean = 51.5 ± 10.4 cating that they were stationary and were detected at only one acoustic
cm; Table 1). station (12–473 detected days, mean = 148 ± 174 days), while the 28
remaining individuals were more mobile and were detected at two to
3.2. Acoustic monitoring eight acoustic stations within the array.
Habitat Fidelity Indices (HFI) indicated that all 39 turtles, except for
Between June 2014 to June 2019, we tagged 55 hawksbill turtles two, stayed within the habitat where they were initially caught for the
with acoustic transmitters in the three habitat types: rocky reef (7 in majority of the time (Table 3). Twenty-six turtles, captured and released
dividuals), sandy reef (14 individuals), mangrove estuary (34 in within the mangrove estuary, spent 89–100% of the time within this
dividuals). All but two individuals were juveniles. In addition, eight habitat, primarily in the main channel and adjacent stations 3 and 4
individuals were recaptured and retagged with acoustic transmitters where the most detections occurred (main channel - 1,403,806; station
once, and one individual was recaptured and retagged with acoustic 3–302,032; station 4–802,796; Fig. 1). Ten turtles, captured and
transmitters twice. Of the 55 tagged turtles, only 47 individuals were released within the sandy reef, spent between 79 and 100% of the time
subsequently detected within our array of acoustic receivers for a total of in this habitat, and one turtle, captured and released within the rocky
1,847,709 detections after filtering (Table 2, Table 3). Total number of reef, spent 100% of the time in this habitat (Table 3). Unfortunately, we
days each tagged individual was detected by the acoustic array ranged lack detailed information from the remaining five turtles captured in the
between one to 1490 (mean = 255 ± 373 days). rocky reef habitat due to receiver loss during bad weather conditions.
The Overall Residency Index (ORI) was calculated for 39 of the 47
detected turtles because these individuals were detected at least 10 days 3.3. Sea turtle behavior
in the array of acoustic stations. Of the remaining eight turtles, five were
detected one day, two were detected two days, and one was detected 8 During May and June from 2016 to 2018, 19 hawksbill individuals
days; therefore, they were not included in the analysis. Overall, ORI (curved carapace length ranged from 43.4 to 68 cm, mean = 53.1 ± 7.7
values ranged from 0.087 to 0.922 with a mean of 0.54 ± 0.26 (Table 4). cm) were captured within the mangrove estuary, fitted with forward
59% (N = 23) of the turtles were highly resident, with ORI values greater facing video cameras, and released where they were caught. Camera
than 0.5, which indicates that they were detected on our array at least memory allowed for 7.8 ± 7.3 h of video data collection per deployment.
half the time that we monitored them (Table 4). 41% (N = 16) of the The relative time turtles spent exhibiting each behavior varied between
turtles had values lower than 0.5 (Table 4). Overall Residency Index was individuals. We identified significant differences in the time spent across
negatively associated with the values of maximum displacement behaviors within the total length of the recordings (X2 = 37.7, df = 3, P
Table 1
Capture per unit effort –CPUE (i.e., total number of captured hawksbills per habitat divided by the total time of each monitoring event expressed as captures per hour)
in the three main marine benthic habitats of Isla San José, Mexico.
Year Monitoring Monitoring events No. hawksbills CPUE (No. of captured turtles/h)
days
sandy mangrove Rocky sandy mangrove Rocky sandy mangrove Rocky
reef estuary reef reef estuary reef reef estuary reef
2014 10 15 3 21 7 2 3 0.09 0.28 0.04
2015 6 11 9 4 3 8 0 0.13 0.42 0.00
2016 17 9 22 0 1 35 0 0.04 1.52 0.00
2017 16 7 15 4 3 15 7 0.23 1.04 0.99
2018 3 0 3 0 0 3 0 0.00 0.74 0.00
2019 8 2 11 1 8 12 0 1.60 0.82 0.00
5
L. Martínez-Estévez et al. Marine Environmental Research 174 (2022) 105532
Table 2
Summary of detections (i.e., recorded “ping” from tagged hawksbill individuals with transmitter ID code, time, and date) per day in each year and each station in the
foraging ground of Isla San José, Mexico.
Mean daily detections (SE)
Station Active days Total detections 2014 2015 2016 2017 2018 2019 2020
Amortajada 1014 37560 37 (2.2) 41 (4.2) 49 (2.5) 20 (2.1) 18 (3.6) 29 (6.4) –
Amortajada South 562 274055 – – – 379 (27.8) 15 (3.6) 415 (19.7) 506 (21.5)
Estero 1 Channel 1006 115293 – – 77 (5.1) 165 (10.6) 81 (8) 93 (11.8) 114 (7.6)
Estero 2 Channel 1000 183685 – 83 (8.1) 200 (10.3) 193 (9.2) 235 (19.8) – –
Estero 3 Channel 1136 302032 – – 451 (20.3) 294 (13.7) 153 (6.4) 124 (8.2) –
Estero 4 Lagoon 1764 802796 – 183 (10.7) 346 (14.1) 447 (11.7) 445 (29) 451 (17.4) 923 (32)
Estero Lagoon East 674 112624 – – 135 (10.8) 193 (9.5) 139 (16.5) – –
Estero Lagoon West 172 19421 – – 43 (19.3) 128 (13.1) 65 (15.8) – –
San José South 23 81 3 (0.7) 3 (0.5) – – – 6 (4) –
San José South West 6 189 – – – – – 31 (24.5) –
< 0.0001, Wilcoxon/Kruskal Wallis). Significantly more time was spent habitats (F2,99 = 25.61, P < 0.0001; Fig. 6). The San José estuary had
swimming than feeding (Z = 5.0, P < 0.0001, Steel-Dwass) and much greater availability (0.26 ± 0.02 mean percent cover ± SE) than
searching (Z = 4.4, P < 0.0001, Steel-Dwass), and more time was spent both the Amortajada sandy reef (0.03 ± 0.01 mean percent cover ± SE)
resting than feeding (Z = 3.9, P = 0.0005, Steel-Dwass) and searching (Z and the South San José rocky reef habitats (0.02 ± 0.01 mean percent
= 3.7, P = 0.0010, Steel-Dwass). No difference was detected between cover ± SE), indicating greater hawksbill food accessibility within the
time spent searching and feeding (Z = 0.4, P = 0.97, Steel-Dwass) or San José estuary (Fig. 6). In the estuary, benthic mats of the primary
swimming and resting (Z = − 1.2, P = 0.57, Steel-Dwass). In total, 99 available food items were dominated by Halimeda sp., Caulerpa sp.,
foraging events were recorded from 12 turtles, with the main food taxa sponges and tunicates. Additional food biomass on mangrove roots
identified being algae (43%), sponge (26%), tunicate (11%), and within the estuary ranged between 109.9 ± 45.6 to 214.8 ± 77.0 gm− 1
mangrove (1%; Fig. 4; food items couldn’t be identified in 19% of ob (mean ± SE) in the channels and 268.7 ± 120.5 gm− 1 in the lagoon.
servations). We observed a total of 4 specific food items identifiable
during video observations: green algae (Caulerpa sertularioides, Halimeda 4. Discussion
sp.), roots of red mangrove (Rhizophora mangle), and black colonial
tunicate (Fig. 5). The combination of passive acoustic tracking data, foraging behavior
recordings, habitat associations of food, and habitat information pro
3.4. Fecal analysis vides a detailed understanding of habitat use and foraging ecology of
hawksbill sea turtles in the Gulf of California, Mexico, and demonstrated
Thirteen fecal samples were opportunistically collected between the likely importance of mangrove estuaries for juvenile Eastern Pacific
2016 and 2018; all on a sloped coral-rubble area covered with Halimeda hawksbills. We found that Isla San José, and its mangrove estuary in
sp. within the lagoon of the San José estuary (Fig. 1; Supplementary Fig. particular, serves as a regionally important foraging ground for juvenile,
1). Macroalgae were clearly visible embedded in the surface of most recently-recruited (i.e., individuals that transitioned from the open
samples. The fecal composition analysis revealed that the primary ocean to coastal areas,
L. Martínez-Estévez et al.
Table 3
Habitat Fidelity Index (HFI) relative to location, including station values, of 47 tagged hawksbill sea turtles in the foraging ground of Isla San José, Mexico. Station code: A – Amortajada, AS –Amortajada South, E1 – Estero
1, E2 – Estero 2, E3 – Estero 3, E4 – Estero 4, LE – Lagoon East, LW – Lagoon West, SJS – San José South, SJSW – San José South West.
Tag ID Hawksbill name CCL (cm) Capture and release habitat HFI Acoustic Stations
Sandy reef Mangrove estuary Rocky reef A AS E1 E2 E3 E4 LE LW SJS SJSW
10855 Ana 57.5 sandy reef 1.0000 28 0 0 0 0 0 0 0 0 0
10859 Rachel 53.0 sandy reef 1.0000 1818 0 0 0 0 0 0 0 0 0
10860 Leia 51 sandy reef 1.0000 5632 0 0 0 0 0 0 0 0 0
24238 Regina 57.8 sandy reef 0.7956 0.2044 4450 0 5 945 12 181 0 0 0 0
24239 Pablo 40.5 sandy reef 1.0000 9 0 0 0 0 0 0 0 0 0
24244 Tina 47.5 sandy reef 1.0000 19520 0 0 0 0 0 0 0 0 0
30316 Kurma 66.8 sandy reef 0.9991 0.0009 209 200357 0 0 0 0 0 0 2 171
30319 Unai 45.3 sandy reef 0.9104 0.0896 38 1130 0 0 0 115 0 0 0 0
30320 Carlin 58.1 sandy reef 1.0000 121 6611 0 0 0 0 0 0 0 0
30321 Dordoka 43.9 sandy reef 1.0000 0 3025 0 0 0 0 0 0 0 0
30325 Pato 65.3 sandy reef 1.0000 0 0 0 0 0 0 0 0 10 0
30329 Luna 54.5 sandy reef 1.0000 0 18920 0 0 0 0 0 0 0 0
53412 Riley 41.6 sandy reef 1.0000 1533 0 0 0 0 0 0 0 0 0
64856 Shellyback 60 sandy reef 1.0000 0 4 0 0 0 0 0 0 0 0
23737 Sunny 58.6 mangrove estuary 0.0001 0.9999 4 0 829 548 45744 2986 2 94 0 0
23738 Paulo 53.3 mangrove estuary 0.0023 0.9977 24 248 7374 21385 76475 13345 408 189 0 0
23739 Gitte 57.3 mangrove estuary 0.0000 1.0000 0 0 466 638 25037 2172 8 5 0 0
23740 Mason 65.3 mangrove estuary 0.0017 0.9983 66 0 3943 19663 4055 10938 82 62 0 0
23741 Griffin 53.0 mangrove estuary 0.0000 1.0000 0 0 0 10 19 135 850 0 0 0
23742 Diego 61.2 mangrove estuary 0.0007 0.9992 0.0001 67 0 42 2050 129 3169 95182 0 13 0
23743 Flojita 43.4 mangrove estuary 0.0000 1.0000 1 0 400 38129 22533 42686 80 0 0 0
23744 Liana 46.7 mangrove estuary 0.0000 1.0000 0 0 0 0 0 98 1498 0 0 0
7
24237/64820 Luz 44.7–51.5 mangrove estuary 0.0009 0.9991 67 0 1985 6988 8669 54820 5163 0 0 0
24240 Pez 66.0 mangrove estuary 0.0026 0.9974 5 0 25 1736 0 130 0 0 0 0
24241 Dude 68.0 mangrove estuary 0.0000 1.0000 0 0 0 39 0 1435 0 0 0 0
24242/64825 Francis 50.5–55.7 mangrove estuary 0.6314 0.3686 9 37265 10895 9906 253 699 10 0 0 0
24243/64824/30327 Sopa 46.6–57.8 mangrove estuary 0.0000 1.0000 0 0 29943 9230 85614 96347 21 0 0 0
30312 Lechuga 48.3 mangrove estuary 1.0000 0 0 0 0 0 246 0 0 0 0
30314 Akuia 55.4 mangrove estuary 0.0373 0.9627 47 4 0 0 0 1300 0 18 0 0
30315 Pelusa 55.5 mangrove estuary 1.0000 0 0 0 0 0 44 0 0 0 0
30318 Nerea 42 mangrove estuary 1.0000 0 0 0 0 0 8 0 0 0 0
30322 Faynor 45.8 mangrove estuary 1.0000 0 0 0 0 0 16 0 0 0 0
30323 Sysy 59 mangrove estuary 1.0000 0 5946 0 0 0 0 0 0 0 0
30326 Thor 59 mangrove estuary 1.0000 0 0 0 0 0 42463 0 0 0 0
53407/25677 Tito 41.6–50.6 mangrove estuary 0.0042 0.9958 164 536 44163 68286 20197 33356 345 547 0 0
53410/30317 Darcy 45.8 mangrove estuary 1.0000 0 0 14 89 142 428436 524 0 0 0
Marine Environmental Research 174 (2022) 105532
64819 Tita 62.2 mangrove estuary 1.0000 0 0 68 17 168 3881 483 115 0 0
64821 Bruce Frank 53 mangrove estuary 0.0483 0.9517 248 0 69 227 3399 879 310 0 0 0
64822 Aloha-ea 48.8 mangrove estuary 0.0009 0.9991 40 9 60 146 2022 46225 1110 5954 0 0
64823/25679 Seamus 44.1–47 mangrove estuary 1.0000 0 0 46 337 5215 2916 0 119 0 0
64826 Regina2 43.6 mangrove estuary 1.0000 0 0 0 0 8 56 0 11563 0 0
64827 Luli 81.8 mangrove estuary 0.0372 0.9628 204 0 1178 1545 852 1365 14 323 0 0
64828 Clara 91.3 mangrove estuary 0.1067 0.8933 3256 0 13148 408 760 7005 5543 390 0 0
64851 Marina 57.8 mangrove estuary 1.0000 0 0 640 1363 729 5344 991 36 0 0
64855 Abena 51 mangrove estuary 1.0000 0 0 0 0 0 0 0 24 0 0
10857 Sapo 48.4 rocky reef 1.0000 0 0 0 0 0 0 0 0 53 0
24235 Pepe 47.1 rocky reef 1.0000 0 0 0 0 0 0 0 0 3 0L. Martínez-Estévez et al. Marine Environmental Research 174 (2022) 105532
Table 4
Overall Residency Index of 47 tagged hawksbill sea turtles in the foraging ground of Isla San José, Mexico recorded from 2014 to 2020.
Hawksbill Tag ID Hawksbill CCL (cm) Release Capture and release No. of No. of Days Days at ORI Maximum
name Date habitat Detections Stations Detected Liberty displacement
(km)
Ei – 01 24235 Pepe 47.1 6/19/14 rocky reef 3 1 2 61 0.033 0.00
Ei – 02 10855 Ana 57.5 6/20/14 sandy reef 28 1 2 61 0.033 0.00
Ei – 03 10857 Sapo 48.4 6/20/14 rocky reef 53 1 16 183 0.087 0.00
Ei – 04 10859 Rachel 53.0 6/20/14 sandy reef 1818 1 131 273 0.480 0.00
Ei – 05 10860 Leia 51 6/20/14 sandy reef 5632 1 208 273 0.762 0.00
Ei – 06 24238 Regina 57.8 6/17/15 sandy reef 5593 5 433 792 0.547 3.29
Ei – 07 24239 Pablo 40.5 6/17/15 sandy reef 9 1 1 30 0.033 0.00
Ei – 08 24244 Tina 47.5 6/17/15 sandy reef 19520 1 473 549 0.862 0.00
Ei – 09 23742 Diego 61.2 6/19/15 mangrove estuary 100652 7 720 1004 0.717 6.00
Ei – 10 24243/64824/ Sopa 46.6–57.8 6/19/15 mangrove estuary 221155 5 1490 1799 0.828 2.30
30327
Ei – 11 23741 Griffin 53.0 6/22/15 mangrove estuary 1014 4 28 214 0.131 2.05
Ei – 12 24240 Pez 66.0 6/22/15 mangrove estuary 1896 4 103 457 0.225 1.40
Ei – 13 24241 Dude 68.0 6/22/15 mangrove estuary 1474 2 13 61 0.213 1.11
Ei – 14 24237/64820 Luz 44.7–51.5 6/22/15 mangrove estuary 77692 6 760 1095 0.694 4.23
Ei – 15 24242/64825 Francis 50.5–55.7 6/22/15 mangrove estuary 59037 7 313 611 0.512 6.22
Ei – 16 23737 Sunny 58.6 3/31/16 mangrove estuary 50207 7 102 122 0.836 6.42
Ei – 17 23738 Paulo 53.3 3/31/16 mangrove estuary 119448 7 755 852 0.886 6.40
Ei – 18 23739 Gitte 57.3 3/31/16 mangrove estuary 28326 6 291 457 0.637 4.50
Ei – 19 23740 Mason 65.3 3/31/16 mangrove estuary 38809 7 163 214 0.762 6.40
Ei – 20 23743 Flojita 43.4 5/15/16 mangrove estuary 103829 6 953 1034 0.922 4.23
Ei – 21 23744 Liana 46.7 5/15/16 mangrove estuary 1596 2 58 123 0.472 0.94
Ei – 22 53412 Riley 41.6 6/21/16 sandy reef 1533 1 27 153 0.176 0.00
Ei – 23 53410/30317 Darcy 45.8 6/21/16 mangrove estuary 429205 5 1369 1492 0.918 2.34
Ei – 24 53407/25677 Tito 41.6–50.6 6/24/16 mangrove estuary 167594 8 1276 1614 0.791 8.22
Ei – 25 64819 Tita 62.2 5/9/17 mangrove estuary 4732 6 153 365 0.419 4.53
Ei – 26 64821 Bruce Frank 53 5/10/17 mangrove estuary 5132 6 31 61 0.508 4.23
Ei – 27 64822 Aloha-ea 48.8 5/11/17 mangrove estuary 55566 8 163 365 0.447 8.20
Ei – 28 64823/25679 Seamus 44.1–47 5/12/17 mangrove estuary 8633 5 244 427 0.571 2.53
Ei – 29 64826 Regina2 43.6 5/16/17 mangrove estuary 11627 3 73 123 0.593 1.58
Ei – 30 64827 Luli 81.8 5/17/17 mangrove estuary 5481 7 66 123 0.537 6.20
Ei – 31 64828 Clara 91.3 6/12/17 mangrove estuary 30510 7 290 365 0.795 6.20
Ei – 32 64851 Marina 57.8 6/13/17 mangrove estuary 9103 6 240 487 0.493 4.50
Ei – 33 64855 Abena 51 6/15/17 mangrove estuary 24 1 1 31 0.032 0.00
Ei – 34 64856 Shellyback 60 6/15/17 sandy reef 4 1 1 30 0.033 0.00
Ei – 35 30325 Pato 65.3 4/3/19 sandy reef 10 1 1 30 0.033 0.00
Ei – 36 30322 Faynor 45.8 5/11/19 mangrove estuary 16 1 8 151 0.053 0.00
Ei – 37 30326 Thor 59 5/11/19 mangrove estuary 42463 1 404 489 0.826 0.00
Ei – 38 30329 Luna 54.5 5/18/19 sandy reef 18920 1 306 519 0.590 0.00
Ei – 39 30323 Sysy 59 6/11/19 mangrove estuary 5946 1 12 30 0.400 0.00
Ei – 40 30316 Kurma 66.8 6/12/19 sandy reef 200739 3 364 396 0.919 6.70
Ei – 41 30319 Unai 45.3 6/12/19 sandy reef 1283 3 14 91 0.154 5.28
Ei – 42 30320 Carlin 58.1 6/12/19 sandy reef 6732 2 82 276 0.297 1.99
Ei – 43 30321 Dordoka 43.9 6/12/19 sandy reef 3025 1 16 30 0.533 0.00
Ei – 44 30318 Nerea 42 6/13/19 mangrove estuary 8 1 1 30 0.033 0.00
Ei – 45 30315 Pelusa 55.5 6/14/19 mangrove estuary 44 1 17 153 0.111 0.00
Ei – 46 30314 Akuia 55.4 6/17/19 mangrove estuary 1369 3 40 246 0.163 6.41
Ei – 47 30312 Lechuga 48.3 6/19/19 mangrove estuary 246 1 16 61 0.262 0.00
more than 60% of their time within an alternative habitat. the potential connectivity between mangrove foraging grounds.
Interestingly, 14% (8/55) of tagged turtles were not detected on our Previous studies have established that hawksbill turtles are typically
acoustic array after being released, and 17% (8/47) of detected turtles associated with hard-bottom habitats such as rocky and coral reefs
were recorded less than 10 days. Lack of detections can be related to tag where sponges and other food items are reliably present (León and
failure, turtle death, turtle dispersal beyond the receivers’ detection Bjorndal, 2002; Meylan, 1988). In fact, a foraging study in Costa Rica
range, or a combination of factors (Chevis et al., 2017; Heupel et al., demonstrated that several hawksbill invertebrate food species were
2006). Two of our tagged turtles were recaptured at a foraging ground exclusively present within rocky reef habitats (Carrión-Cortez et al.,
approximately 40 km south of Isla San José, indicating that at least a 2013). Nevertheless, studies in the Eastern Pacific in the last decade
subset of turtles is ranging more widely, with movements outside of the have demonstrated the importance of mangrove estuaries as both
San José foraging ground. Wider ranging movements have been foraging and nesting habitats for hawksbills (Gaos et al., 2012 a,b; Gaos
described as exploratory behaviors for other sea turtle species and by our et al., 2017; Liles et al., 2011). Our study mirrors these findings and
own work with hawksbills (Martínez-Estévez et al., 2021), and were shows that mangroves are also an important foraging habitat for
ascribed to movement between foraging areas, displacement due to hawksbills, particularly juveniles, in the Gulf of California. This is likely
intraspecific competition, limited local availability of resources, or related to locally high mangrove productivity promoting increased food
variation in individual behavior (Bolnick et al., 2003; Bowler and Ben availability of mangrove root epibionts including sponges, other in
ton, 2005; Fukuoka et al., 2015; Meylan et al., 2011). Understanding vertebrates, and algae. Indeed, mangroves facilitate sponge growth by
these wider ranging movement patterns would be possible within a providing essential carbon through rootlets ramifying within the sponge
wider regional network of receivers off the coast of the Baja California tissue (Ellison et al., 1996; Folkers and Rombouts, 2020). Mangroves can
Peninsula that might provide insight into dispersal of individuals and also provide refugia for turtles to escape predators, a moderately stable
8L. Martínez-Estévez et al. Marine Environmental Research 174 (2022) 105532
Fig. 4. Mean ± SE percent composition of prey items in hawksbill turtle fecal matter (blue, n = 13 opportunistically collected fecal samples) and foraging events per
turtle (green, n = 12 video camera tagged turtles). (For interpretation of the references to colour in this figure legend, the reader is referred to the Web version of
this article.)
environmental temperature, and minimize exposure to other threats. fact, sponges were sometimes located as secondary cover under the
Our video recordings showed turtles resting during the day under macroalgae and thus both algae and sponge may be ingested at the same
mangrove roots and areas close to vegetation rather than hard bottom location. It is important to note that because the digestion of algae is
structures, and the presence of large predatory elasmobranchs and faster than the hard indigestible parts of the sponges, it may be under
strong currents may be reduced within the mangroves’ root system. represented in our fecal analysis. These results are consistent with
Similar hiding behavior has been shown in reef habitats where hawks findings at other foraging grounds in Costa Rica and Australia where
bills use outcroppings to rest or hide (Selby et al., 2019). macroalgae was also the dominant food item (Bell, 2013;
Although it is widely recognized that hawksbill turtles are primarily Méndez-Salgado et al., 2020). Our survey data on the algal and inver
spongivores (Berube et al., 2012; Meylan, 1988; van Dam and Diez, tebrate assemblages within San José estuary show that macroalgae
1997), additional studies have demonstrated that dietary habits can vary (Halimeda sp., Ulva sp. and Caulerpa sertularioides) were abundant, along
and that individuals often include a broad range of food items in their with sponges and tunicates (Myxilla sp., Chondrilla nucula, Halichondria
diet across their range (Bell, 2013; Bjorndal, 1985; Bjorndal and Bolten, sp., Callyspongia ssp., Dysidea sp., Adocia sp., Ascidia sp. and Didemnum
2010; Diez et al., 2003; León and Bjorndal, 2002; Obura et al., 2010). carnulentum; Felix-Pico et al., 2011). It should be noted, however, that
The broad range of diet items we found in hawksbills in the Isla San José our surveys were conducted during summer months, and the composi
region may result from sampling a large number of juvenile turtles tion of the benthos may change seasonally. Also, we were unable to
utilizing the area as well as differences in relative food abundances in identify all the food items consumed by hawksbills, and some food items
mangroves vs. coral reefs. Based on our video recordings algae were may be ingested incidentally as epibionts of target dietary species.
most frequently observed being consumed, whereas sponges were the Further investigation using stable isotope analysis would allow for in
primary food item observed in feces, meaning that these two items are sights into the diet intake and nutritional requirements of this aggre
particularly important component of hawksbills’ diet in this area. In gation over time.
Fig. 5. Food items identified in video recordings from turtle-borne cameras placed on hawksbill turtles released in the mangrove estuary off Isla San José, Mexico. A-
Mangrove root (Rhizophora mangle), B – Black colonial tunicate, C – Green algae (Halimeda sp.), D – Green algae (Caulerpa sertularioides) and an unidentified sponge,
E-F – Unidentified sponges. (For interpretation of the references to colour in this figure legend, the reader is referred to the Web version of this article.)
9L. Martínez-Estévez et al. Marine Environmental Research 174 (2022) 105532
Juan Pablo Cuevas Amador: Investigation.
Felipe Cuevas Amador: Investigation.
Dorota Szuta: Investigation, Formal analysis, Data curation, Writing
review & editing.
Scott D. Miller: Investigation, Writing review & editing.
Gage H. Dayton: Methodology, Investigation, Writing - review &
editing.
Bernie R. Tershy: Supervision, Writing - review & editing.
Donald A. Croll: Conceptualization, Methodology, Validation,
Investigation, Writing - review & editing, Supervision, Funding
acquisition.
Declaration of competing interest
The authors declare that they have no known competing financial
interests or personal relationships that could have appeared to influence
the work reported in this paper.
Fig. 6. Food abundance relative to habitat. Comparison of mean percent cover
of relative hawksbill food abundance within and among benthic habitat types Acknowledgements
by location around Isla San José, Mexico. Columns with different letters (A, B)
are significantly different from one another (α < 0.05; Amortajada sandy reef, This research was sponsored by the UC Mexus-CONACYT Collabo
South San José rocky reef, San José mangrove estuary). Lagoon and channel rative Grants (CN-15-1504), The UC Mexico Initiative, and The National
data are combined in the mangrove estuary. Geographic Research and Exploration Grant. We thank the National
Council for Sciences and Technology (CONACYT) and The University of
Understanding foraging habitat use of hawksbill individuals in the California Institute for Mexico and the United States (UC MEXUS) for the
Gulf of California is fundamental to developing effective conservation UC MEXUS-CONACYT Doctoral Fellowship. We also thank our partners
and recovery plans. Our study establishes the Isla San José foraging Grupo Tortuguero de las Californias A.C., Sociedad de Historia Natural
ground as a site off the Baja California Peninsula with large concentra Niparajá A.C., and The National Commission of Protected Areas. We
tions of hawksbills, indicating its importance to the Eastern Pacific want to thank Dr. Jeffrey A. Seminoff, Professor Mark H. Carr, and
hawksbill population. We are confident that the greater number of Professor Gerardo Ceballos for their valuable comments on this manu
captured individuals and the abundance of food within the estuary script. Special thanks to John O′ Sullivan from Monterey Bay Aquarium,
makes this location a key area for hawksbill conservation. The marine Alberto Abreu Grobois from Instituto de Ciencias del Mar y Limnología
habitats that surround Isla San José are not included in the national (UNAM), Unidad Mazatlán, the divers from Universidad Autónoma de
system of protected areas, but the community no-take protected area in Baja California Sur and Moss Landing Marine Laboratories, Juan Chuy
the estuary established by fishers is de facto also protecting dependent Lucero, and Gurnee Munn.
hawksbills as their vigilance discourages fishing practices (e.g., gill
netting) that result in sea turtle mortality. Mangrove estuaries are Appendix A. Supplementary data
important features throughout the Southern Gulf of California, partic
ularly in the Eastern Gulf, as well as other areas in Western Mexico. We Supplementary data to this article can be found online at https://doi.
hypothesize that these estuaries in the Eastern Gulf and Western Mexico, org/10.1016/j.marenvres.2021.105532.
while more heavily impacted by human activities, may also provide
important foraging habitat for juvenile hawksbills. Based on our study,
References
important potential conservation measures for hawksbills of Western
Mexico in general and the San José estuary in particular include: 1) Aburto-Oropeza, O., Ezcurra, E., Danemann, G., Valdez, V., Murray, J., Sala, E., 2008.
regional surveys of other mangrove estuaries to identify additional Mangroves in the Gulf of California increase fishery yields. Proc. Natl. Acad. Sci. U.S.
A. 105, 10456–10459.
important hawksbill foraging areas that might deserve similar protec
Bell, I., 2013. Algivory in hawksbill turtles: Eretmochelys imbricata food selection within a
tion; 2) developing win-win strategies where fishing communities foraging area on the Northern Great Barrier Reef: Algivory in hawksbill turtles. Mar.
benefit from protecting and monitoring of mangrove hawksbill habitat, Ecol. 34, 43–55.
potentially through the implementation of territorial use rights for Berube, M.D., Dunbar, S.G., Rützler, K., Hayes, W.K., 2012. Home range and foraging
ecology of juvenile hawksbill sea turtles (Eretmochelys imbricata) on inshore reefs of
fishing (TURFs) and support of an established fishermen-led hawksbill Honduras. Chelonian Conserv. Biol. 11, 33–43.
monitoring program; 3) specifically protecting hawksbill turtles in the Bjorndal, K.A., 1985. Nutritional ecology of sea turtles. Copeia 736–751, 1985.
Isla San José foraging ground; and 4) establishing a protected area and Bjorndal, K.A., 1997. Foraging ecology and nutrition of sea turtles. In: Lutz, P.L.,
Musick, J.A. (Eds.), The Biology of Sea Turtles. CRC Press, Boca Raton, FL,
training of local fishermen to reduce hawksbill bycatch in the adjacent pp. 199–231.
embayment and rocky reef habitats of Isla San José. Bjorndal, K.A., Bolten, A.B., 2010. Hawksbill sea turtles in seagrass pastures: success in a
peripheral habitat. Mar. Biol. 157, 135–145.
Blumenthal, J.M., Austin, T.J., Bell, C.D.L., Bothwell, J.B., Broderick, A.C., Ebanks-
Author statement Petrie, G., Gibb, J.A., Luke, K.E., Olynik, J.R., Orr, M.F., Solomon, J.L., Godley, B.J.,
2009. Ecology of hawksbill turtles, Eretmochelys imbricata, on a western Caribbean
Lourdes Martínez-Estévez: Conceptualization, Methodology, Vali foraging ground. Chelonian Conserv. Biol. 8, 1–10.
Bolnick, D.I., Svanbäck, R., Fordyce, J.A., Yang, L.H., Davis, J.M., Hulsey, C.D.,
dation, Formal analysis, Investigation, Data curation, Writing - original
Forister, M.L., 2003. The ecology of individuals: incidence and implications of
draft, Writing - review & editing Visualization, Funding acquisition. individual specialization. Am. Nat. 161, 1–28.
Diana L. Steller: Conceptualization, Methodology, Validation, Bourillón-Moreno, L., Díaz-Barriga, A.C., Ecardi- Ambrosi, F., Lira-Fernández, E.,
Ramírez-Ruíz, J., Velarde-González, E., Zavala-González, A., 1988. Islas del Golfo de
Investigation, Data curation, Writing - review & editing.
California. Secretaría de Gobernación, UNAM, Ciudad de México.
Kelly M. Zilliacus: Methodology, Formal analysis, Investigation, Bowler, D.E., Benton, T.G., 2005. Causes and consequences of animal dispersal strategies:
Resources, Data curation, Writing - review & editing, Project adminis relating individual behaviour to spatial dynamics. Biol. Rev. 80, 205–225.
tration, Funding acquisition. Broderick, A.C., Coyne, M.S., Fuller, W.J., Glen, F., Godley, B.J., 2007. Fidelity and over-
wintering of sea turtles. Proc R Soc B 274, 1533–1539.
10L. Martínez-Estévez et al. Marine Environmental Research 174 (2022) 105532
Campbell, H.A., Watts, M.E., Dwyer, R.G., Franklin, C.E., 2012. V-Track: software for March, D., Palmer, M., Alós, J., Grau, A., Cardona, F., 2010. Short-term residence, home
analysing and visualising animal movement from acoustic telemetry detections. Mar. range size and diel patterns of the painted comber Serranus scriba in a temperate
Freshw. Res. 63, 815–820. marine reserve. Mar. Ecol. Prog. Ser. 400, 195–206.
Carrión-Cortez, J., Canales-Cerro, C., Arauz, R., Riosmena-Rodríguez, R., 2013. Habitat Martínez-Estévez, L., Amador, J.P.C., Amador, F.C., Zilliacus, K.M., Pacheco, A.M.,
use and diet of juvenile eastern Pacific hawksbill turtles (Eretmochelys imbricata) in Seminoff, J.A., Lucero, J., Oceguera, K., Tershy, B.R., Croll, D.A., 2021. Spatial
the North Pacific coast of Costa Rica. Chelonian Conserv. Biol. 12, 235–245. ecology of hawksbill sea turtles (Eretmochelys imbricata) in foraging habitats of the
Ceriani, S.A., Weishampel, J.F., Ehrhart, L.M., Mansfield, K.L., Wunder, M.B., 2017. Gulf of California, Mexico. Global Ecol. Conserv. 27, e01540.
Foraging and recruitment hotspot dynamics for the largest Atlantic loggerhead turtle Méndez-Salgado, E., Chacón-Chaverri, D., Fonseca, L.G., Seminoff, J.A., 2020. Trophic
rookery. Sci. Rep. 7, 16894. ecology of hawksbill turtles (Eretmochelys imbricata) in Golfo Dulce, Costa Rica:
Chevis, M., Godley, B., Lewis, J., Jackson Lewis, J., Scales, K., Graham, R., 2017. integrating esophageal lavage and stable isotope (δ13C, δ15N) analysis. Lat. Am. J.
Movement patterns of juvenile hawksbill turtles Eretmochelys imbricata at a Aquat. Res. 48, 114–130.
Caribbean coral atoll: long-term tracking using passive acoustic telemetry. Endanger. Meylan, A., 1988. Spongivory in hawksbill turtles: a diet of glass. Science 239, 393–395.
Species Res. 32, 309–319. Meylan, A.B., Donnelly, M., 1999. Status justification for listing the hawksbill turtle
Costanza, R., d’Arge, R., de Groot, R., Farber, S., Grasso, M., Hannon, B., Limburg, K., (Eretmochelys imbricata) as critically endangered on the 1996 IUCN red list of
Naeem, S., Oneill, R.V., Paruelo, J., Raskin, R.G., Sutton, P., van den Belt, M., 1997. threatened animals. Chelonian Conserv. Biol. 3, 200–224.
The value of the world’s ecosystem services and natural capital. Nature 387, Meylan, P.A., Meylan, A.B., Gray, J.A., 2011. The ecology and migrations of sea turtles 8.
253–260. Tests of the developmental habitat hypothesis. Bull. Am. Mus. Nat. Hist. 357, 1–70.
Diez, C.E., Vélez-Zuazo, X., van Dam, R.P., 2003. Hawksbill turtles in seagrass beds. Mar. Miller, J., 1997. Reproduction in sea turtles. In: Lutz, P.L., Musick, J.A. (Eds.), The
Turt. Newsl. 102, 8–10. Biology of Sea Turtles. CRC Press, Boca Raton, FL, pp. 51–81.
Eckert, K.L., Bjorndal, K.A., Abreu-Grobois, F.A., Donnelly, M., 1999. Research and Niparaja (Sociedad de Historia Natural Niparajá A.C.), 2015. Las primeras zonas de
Management Techniques for the Conservation of Sea Turtles. IUCN/SSC Marine refugio en Mexico. Experiencia del corredor San Cosme a Punta Coyote (accessed 12
Turtle Specialist Group Publication No. 4, Washington, D.C. April 2020).
Ellison, A.M., Farnsworth, E.J., Twilley, R.R., 1996. Facultative mutualism between red Norse, E.A., Crowder, L.B., Gjerde, K., Roberts, C., Safina, C., Soulé, M.E., 2005. Place-
mangroves and root-fouling sponges in Belizean mangal. Ecology 77, 2431–2444. based ecosystem management in the open ocean. In: Norse, E.A., Crowder, L.B.
Felix Pico, E.F., Serviere Zaragoza, E., Riosmena Rodriguez, R., Leon de la Luz, J.L., (Eds.), Marine Conservation Biology: the Science of Maintaining the Sea’s
2011. Los manglares de la peninsula de Baja California. Publicación de divulgación Biodiversity. Island Press, Washington, DC, pp. 302–327.
del Centro de Investigaciones Biológicas del Noroeste, La Paz, BCS. Novak, A.J., Becker, S.L., Finn, J.T., Danylchuk, A.J., Pollock, C.G., Hills-Starr, Z.,
Ferreira, R.L., Ceia, F.R., Borges, T.C., Ramos, J.A., Bolten, A.B., 2018. Foraging niche Jordaan, A., 2020. Inferring residency and movement patterns of horse-eye jack
segregation between juvenile and adult hawksbill turtles (Eretmochelys imbricata) at Caranx latus in relation to a Caribbean marine protected area acoustic telemetry
Principe Island, West Africa. J. Exp. Mar. Biol. Ecol. 498, 1–7. array. Anim Biotelemetry 8, 12.
Folkers, M., Rombouts, T., 2020. Sponges revealed: a synthesis of their overlooked Obura, D.O., Harvey, A., Young, T., Eltayeb, M.M., von Brandis, R., 2010. Hawksbill
ecological functions within aquatic ecosystems. In: Jungblut, S., Liebich, V., Bode- turtles as significant predators on hard coral. Coral Reefs 29, 759-759.
Dalby, M. (Eds.), YOUMARES 9 – the Oceans: Our Research, Our Future. Springer, Pilcher, N.J., Antonopoulou, M., Perry, L., Abdel-Moati, M.A., Al Abdessalaam, T.Z.,
Cham, pp. 181–193. Albeldawi, M., Al Ansi, M., Al-Mohannadi, S.F., Al Zahlawi, N., Baldwin, R.,
Friard, O., Gamba, M., 2016. BORIS: a free, versatile open-source event-logging software Chikhi, A., Das, H.S., Hamza, S., Kerr, O.J., Al Kiyumi, A., Mobaraki, A., Al
for video/audio coding and live observations. Methods Ecol. Evol. 7, 1325–1330. Suwaidi, H.S., Al Suweidi, A.S., Sawaf, M., Tourenq, C., Williams, J., Willson, A.,
Fuentes, M.M.P.B., Gillis, A.J., Ceriani, S.A., Guttridge, T.L., Van Zinnicq Bergmann, M.P. 2014. Identification of important sea turtle areas (ITAs) for hawksbill turtles in the
M., Smukall, M., Gruber, S.H., Wildermann, N., 2019. Informing marine protected Arabian region. J. Exp. Mar. Biol. Ecol. 460, 89–99.
areas in Bimini, Bahamas by considering hotspots for green turtles (Chelonia mydas). Pincock, D.G., 2012. False Detections: what They Are and How to Remove Them from
Biodivers. Conserv. 28, 197–211. Detection Data. VEMCO Technical Document DOC-004691. (accessed 20 July 2020).
Fukuoka, T., Narazaki, T., Sato, K., 2015. Summer-restricted migration of green turtles Piper, W.H., 2011. Making habitat selection more “familiar”: a review. Behav. Ecol.
Chelonia mydas to a temperate habitat of the northwest Pacific Ocean. Endanger. Sociobiol. 65, 1329–1351.
Species Res. 28, 1–10. Polidoro, B., Brooks, T., Carpenter, K., Edgar, G., Henderson, S., Sanciangco, J.,
Gaos, A.R., Lewison, R.L., Wallace, B.P., Yañez, I.L., Liles, M.J., Nichols, W.J., Robertson, D., 2012. Patterns of extinction risk and threat for marine vertebrates and
Baquero, A., Hasbún, C.R., Vasquez, M., Urteaga, J., Seminoff, J.A., 2012a. Spatial habitat-forming species in the Tropical Eastern Pacific. Mar. Ecol. Prog. Ser. 448,
ecology of critically endangered hawksbill turtles Eretmochelys imbricata: 93–104.
implications for management and conservation. Mar. Ecol. Prog. Ser. 450, 181–194. Ridgway, S.H., Wever, E.G., McCormick, J.G., Palin, J., Anderson, J.H., 1969. Hearing in
Gaos, A.R., Lewison, R.L., Yañez, I.L., Wallace, B.P., Liles, M.J., Nichols, W.J., the giant sea turtle, Chelonia mydas. Proc. Natl. Acad. Sci. Unit. States Am. 64,
Baquero, A., Hasbún, C.R., Vasquez, M., Urteaga, J., Seminoff, J.A., 2012b. Shifting 884–890.
the life-history paradigm: discovery of novel habitat use by hawksbill turtles. Biol. Rincon-Diaz, M.P., Diez, C.E., van Dam, R.P., Sabat, A.M., 2011. Foraging selectivity of
Lett. 8, 54–56. the hawksbill sea turtle (Eretmochelys imbricata) in the Culebra Archipelago, Puerto
Gaos, A.R., Liles, M.J., Gadea, V., Pena, A., Vallejo, F., Miranda, C., Darquea, J., Rico. J. Herpetol. 45, 277–282.
Henriquez, A., Altamirano, E., Rivera, A., Chavarria, S., Melero, D., Urteaga, J., Scales, K.L., Lewis, J.A., Lewis, J.P., Castellanos, D., Godley, B.J., Graham, R.T., 2011.
Pacheco, C., Chacon, D., LeMarie, C., Alfaro, J., Mangel, J.C., Yanez, I.L., Seminoff, J. Insights into habitat utilisation of the hawksbill turtle, Eretmochelys imbricata
A., 2017. Living on the edge: hawksbill turtle nesting and conservation along the (Linnaeus, 1766), using acoustic telemetry. J. Exp. Mar. Biol. Ecol. 407, 122–129.
eastern Pacific Rim. lajar 45, 572–584. Selby, T., Hart, K., Smith, B., Pollock, C., Hillis-Starr, Z., Oli, M., 2019. Juvenile
Gillis, A., Ceriani, S., Seminoff, J.A., Fuentes, M., 2018. Foraging ecology and diet hawksbill residency and habitat use within a Caribbean marine protected area.
selection of juvenile green turtles in the Bahamas: insights from stable isotope Endanger. Species Res. 40, 53–64.
analysis and prey mapping. Mar. Ecol. Prog. Ser. 599, 225–238. Sequeira, A.M.M., Hays, G.C., Sims, D.W., Eguíluz, V.M., Rodríguez, J.P., Heupel, M.R.,
Glynn, P.W., 1976. Some physical and biological determinants of coral community Harcourt, R., Calich, H., Queiroz, N., Costa, D.P., Fernández-Gracia, J., Ferreira, L.C.,
structure in the Eastern Pacific. Ecol. Monogr. 46, 431–456. Goldsworthy, S.D., Hindell, M.A., Lea, M.-A., Meekan, M.G., Pagano, A.M.,
Griffin, L., Finn, J., Diez, C., Danylchuk, A., 2019. Movements, connectivity, and space Shaffer, S.A., Reisser, J., Thums, M., Weise, M., Duarte, C.M., 2019. Overhauling
use of immature green turtles within coastal habitats of the Culebra Archipelago, ocean spatial planning to improve marine megafauna conservation. Front. Mar. Sci.
Puerto Rico: implications for conservation. Endanger. Species Res. 40, 75–90. 6, 639.
Hart, K., Sartain, A., Fujisaki, I., Pratt, H., Morley, D., Feeley, M., 2012. Home range, Shimada, T., Limpus, C., Jones, R., Hazel, J., Groom, R., Hamann, M., 2016. Sea turtles
habitat use, and migrations of hawksbill turtles tracked from Dry Tortugas National return home after intentional displacement from coastal foraging areas. Mar. Biol.
Park, Florida, USA. Mar. Ecol. Prog. Ser. 457, 193–207. 163, 8.
Heithaus, M.R., 2013. Predators, prey, and ecological roles of sea turtles. In: Wyneken, J., Shimada, T., Limpus, C.J., Hamann, M., Bell, I., Esteban, N., Groom, R., Hays, G.C., 2019.
Lohman, J.K., Musick, J.A. (Eds.), Biology of Sea Turtles, vol. III. CRC Press, Boca Fidelity to foraging sites after long migrations. J. Anim. Ecol. 89, 1008–1016.
Raton, FL, pp. 249–285. Thomson, J.A., Heithaus, M.R., 2014. Animal-borne video reveals seasonal activity
Heupel, M.R., Semmens, J.M., Hobday, A.J., 2006. Automated acoustic tracking of patterns of green sea turtles and the importance of accounting for capture stress in
aquatic animals: scales, design and deployment of listening station arrays. Mar. short-term biologging. J. Exp. Mar. Biol. Ecol. 450, 15–20.
Freshw. Res. 57, 1–13. Udyawer, V., Dwyer, R.G., Hoenner, X., Babcock, R.C., Brodie, S., Campbell, H.A.,
Jackson, J.B.C., 2008. Ecological extinction and evolution in the brave new ocean. Proc. Harcourt, R.G., Huveneers, C., Jaine, F.R.A., Simpfendorfer, C.A., Taylor, M.D.,
Natl. Acad. Sci. U.S.A. 105, 11458–11465. Heupel, M.R., 2018. A standardized framework for analysing animal detections from
León, Y., Bjorndal, K., 2002. Selective feeding in the hawksbill turtle, an important automated tracking arrays. Anim Biotelemetry 6, 17.
predator in coral reef ecosystems. Mar. Ecol. Prog. Ser. 245, 249–258. Valderrama-Landeros, L.H., Rodríguez Zúñiga, M.T., Troche Souza, C., Velázquez
Liles, M.J., Jandres, M.V., López, W.A., Mariona, G.I., Hasbún, C.R., Seminoff, J.A., 2011. Salazar, S., Villeda Chávez, E., Alcántara Maya, J.A., Vázquez Balderas, B., Cruz
Hawksbill turtles Eretmochelys imbricata in El Salvador: nesting distribution and López, M.I., Ressl, R., 2017. Manglares de México: Actualización y exploración de los
mortality at the largest remaining nesting aggregation in the eastern Pacific Ocean. datos del sistema de monitoreo 1970/1980-2015. Comisión Nacional para el
Endanger. Species Res. 14, 23–30. Conocimiento y Uso de la Biodiversidad. Ciudad de Mexico.
Lutz, P.L., Musick, J.A., 1997. The Biology of Sea Turtles, vol. I. CRC Press, Boca Raton, van Dam, R.P., Diez, C.E., 1997. Diving behavior of immature hawksbill turtles
FL. (Eretmochelys imbricata) in a Caribbean reef habitat. Coral Reefs 16, 133–138.
McCauley, D.J., Pinsky, M.L., Palumbi, S.R., Estes, J.A., Joyce, F.H., Warner, R.R., 2015. van Dam, R.P., Diez, C.E., 1998. Home range of immature hawksbill turtles (Eretmochelys
Marine defaunation: animal loss in the global ocean. Science 347, 1255641. imbricata (Linnaeus)) at two Caribbean islands. J. Exp. Mar. Biol. Ecol. 220, 15–24.
11You can also read