Atlantic Salmon (Salmo salar) Cage-Site Distribution, Behavior, and Physiology During a Newfoundland Heat Wave
←
→
Page content transcription
If your browser does not render page correctly, please read the page content below
ORIGINAL RESEARCH
                                                                                                                                          published: 24 August 2021
                                                                                                                                    doi: 10.3389/fphys.2021.719594

                                                Atlantic Salmon (Salmo salar)
                                                Cage-Site Distribution, Behavior, and
                                                Physiology During a Newfoundland
                                                Heat Wave
                                                Anthony K. Gamperl*, Zoe A. Zrini and Rebeccah M. Sandrelli
                                                Department of Ocean Sciences, Memorial University, St. John’s, NL, Canada

                                                Background: Climate change is leading to increased water temperatures and reduced
                                                oxygen levels at sea-cage sites, and this is a challenge that the Atlantic salmon
                                                aquaculture industry must adapt to it if it needs to grow sustainably. However, to do this,
                                                the industry must better understand how sea-cage conditions influence the physiology
                                                and behavior of the fish.
                                                Method: We fitted ∼2.5 kg Atlantic salmon on the south coast of Newfoundland with
                                                Star-Oddi milli-HRT ACT and Milli-TD data loggers (data storage tags, DSTs) in the
                                                summer of 2019 that allowed us to simultaneously record the fish’s 3D acceleration
                                                (i.e., activity/behavior), electrocardiograms (and thus, heart rate and heart rate variability),
                           Edited by:           depth, and temperature from early July to mid-October.
                          Jeroen Brijs,
                                                Results: Over the course of the summer/fall, surface water temperatures went from
        University of Hawaii at Manoa,
                         United States          ∼10–12 to 18–19.5◦ C, and then fell to 8◦ C. The data provide valuable information
                      Reviewed by:              on how cage-site conditions affected the salmon and their determining factors. For
                     Frode Oppedal,             example, although the fish typically selected a temperature of 14–18◦ C when available
         Norwegian Institute of Marine
             Research (IMR), Norway             (i.e., this is their preferred temperature in culture), and thus were found deeper in
                     Yuya Makiguchi,            the cage as surface water temperatures peaked, they continued to use the full range
              Nihon University, Japan
                                                of depths available during the warmest part of the summer. The depth occupied by
                  *Correspondence:
                                                the fish and heart rate were greater during the day, but the latter effect was not
                  Anthony K. Gamperl
                   kgamperl@mun.ca              temperature-related. Finally, while the fish generally swam at 0.4–1.0 body lengths per
                                                second (25–60 cm s−1 ), their activity and the proportion of time spent using non-steady
                    Specialty section:
                                                swimming (i.e., burst-and-coast swimming) increased when feeding was stopped at
          This article was submitted to
                        Physio-logging,         high temperatures.
                a section of the journal
                Frontiers in Physiology
                                                Conclusion: Data storage tags that record multiple parameters are an effective tool to
                                                understand how cage-site conditions and management influence salmon (fish) behavior,
            Received: 02 June 2021
            Accepted: 20 July 2021              physiology, and welfare in culture, and can even be used to provide fine-scale mapping
          Published: 24 August 2021             of environmental conditions. The data collected here, and that in recent publications,
                              Citation:         strongly suggest that pathogen (biotic) challenges in combination with high temperatures,
             Gamperl AK, Zrini ZA and
  Sandrelli RM (2021) Atlantic Salmon           not high temperatures + moderate hypoxia (∼70% air saturation) by themselves, are
  (Salmo salar) Cage-Site Distribution,         the biggest climate-related challenge facing the salmon aquaculture industry outside
    Behavior, and Physiology During a
                                                of Tasmania.
            Newfoundland Heat Wave.
            Front. Physiol. 12:719594.          Keywords: salmon, temperature, heart rate, electrocardiogram, activity, depth, heart rate variability, data storage
     doi: 10.3389/fphys.2021.719594             tags

Frontiers in Physiology | www.frontiersin.org                                        1                                      August 2021 | Volume 12 | Article 719594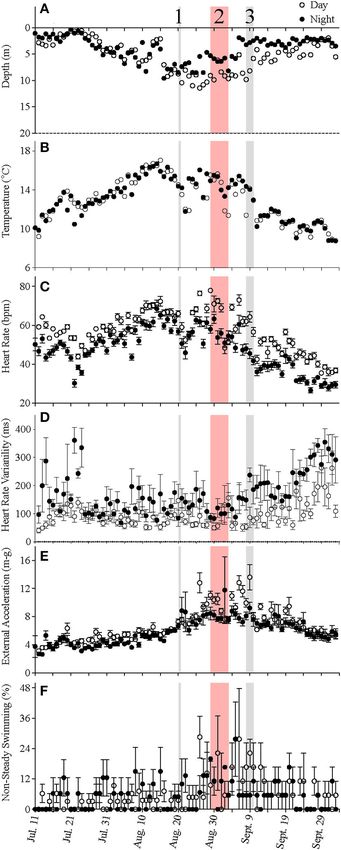
Gamperl et al.                                                                                                 Sea-Caged Salmon During Heat Wave

INTRODUCTION                                                                speed/activity and to discern certain swimming behaviors (i.e.,
                                                                            burst-and coast swimming), respectively. Further, they showed
The marine environment is becoming warmer, and experiencing                 that fH is sensitive to changes in temperature, swimming speed,
more frequent and severe heat waves and hypoxic episodes as a               and diel rhythms, and that HRV may provide novel information
result of climate change (Breitburg et al., 2018; Frölicher et al.,         on the cardiac function and physiology of free-swimming fishes.
2018; Oliver et al., 2018; Holbrook et al., 2019; IPCC, 2019;                  Thus, to examine how present-day summer cage-site
Sampaio et al., 2021). Further, these conditions, which can co-             conditions influence the distribution, physiology, and activity
occur at marine sea-cage sites (Burt et al., 2012, Stehfest et al.,         of Atlantic salmon on the East Coast of Canada, we fitted 12
2017), may become a challenge for cage-cultured fish species                salmon with milli-HRT ACT and Milli-TD tags in mid-July
and negatively affect growth, immunology, reproduction, and                 2019, released them into a sea-cage on the south coast of
welfare (Reid et al., 2019). For example, it was recently reported          Newfoundland, and recovered them at harvest (in October).
that sea-caged Atlantic salmon (Salmo salar) in Tasmania were               This produced a very comprehensive and unique dataset, in
exposed to temperatures as high as 23◦ C and oxygen levels as low           particular, because seawater temperatures were amongst the
as 35% air saturation, and that these environmental conditions              highest on record in Newfoundland in August (i.e., up to
limited the depth distribution of the fish in the cages (i.e., led to       19.5◦ C). The results of this study: add further support for using
crowding), and negatively affected feeding and filet quality (i.e.,         this type of technology for monitoring cage-site conditions and
filet coloration) (Stehfest et al., 2017; Wade et al., 2019).               how it relates to fish physiology, behavior, and welfare; provide
    There are several studies that have examined the impact of              key information on how cage-site temperature impacts the
summer environmental conditions on the distribution of fishes in            physiology, distribution, and behavior of Saint John River origin
sea-cages and the temperatures and oxygen levels that they prefer           salmon; and offer key insights into why lab-based studies of the
and/or avoid (e.g., Johansson et al., 2007, 2009; Oppedal et al.,           thermal tolerance and immunology on these salmon (e.g., refer
2011; Stehfest et al., 2017). Further, researchers have recently            to Gamperl et al., 2020; Zanuzzo et al., 2020) would not have
used heart rate data storage tags (DSTs) to examine the effects             predicted the significant mortalities that occurred in these cages
of cage-site conditions and aquaculture practices (e.g., crowding,          under these environmental conditions.
netting, brailing, and transportation) on aspects of trout/salmon
physiology, stress, and welfare (Brijs et al., 2018, 2019; Hjelmstedt
et al., 2020; Hvas et al., 2020; Føre et al., 2021; Svendsen                MATERIALS AND METHODS
et al., 2021). However, to date, no studies have combined                   Location, Experimental Fish, and Research
these technologies to examine how summer cage-site conditions
affect the depth distribution, behavior/activity, and heart rate of
                                                                            Statement
                                                                            Twelve adult sea-caged Atlantic salmon (Salmo salar) with an
Atlantic salmon; the predominant finfish species reared in North
                                                                            average mass of 2.61 ± 0.15 kg (1.80–3.39 kg) and a fork length
America, Europe, Chile, and Tasmania, and whose annual global
                                                                            of 60.7 ± 0.97 cm (55.0–65.0 cm) were used in these experiments.
production was ∼2.6 million tons in 2019 (worth ∼ US $12.5
                                                                            The salmon were tagged in a single sea-cage at a site located
billion) (Food Agriculture Association of the United Nations,
                                                                            on the south coast of Newfoundland (Canada). The fish were
2020). Such information is critical as heart function/rate is a
                                                                            grown under typical production protocols in a circular sea-cage
key determinant of fish thermal tolerance and a good metric
                                                                            (100 m in diameter and 15 m deep with an extended conical
of stress and metabolic expenditures (Armstrong, 1986; Lucas,
                                                                            bottom) stocked with ∼35,000 fish. This research was conducted
1994; Wang and Overgaard, 2007; Anttila et al., 2014; Eliason
                                                                            with the permission and assistance of the aquaculture company
and Anttila, 2017), and activity/movement makes up a large
                                                                            with which this work was conducted. However, based on a
proportion of the energy budget of a fish (Clark et al., 2010; Gleiss
                                                                            non-disclosure agreement, we cannot provide information on
et al., 2010). Further, understanding the spatial and temporal
                                                                            the exact location of the cage-site, the environmental data they
variability of key environmental variables within sea-cages, and
                                                                            collected, or the number of mortalities that occurred in the
how salmon respond to them, may enable modifications to farm
                                                                            sea-cage in which the fish were placed.
siting and/or cage-site structure or management/operations that
will improve fish health, welfare, and production/sustainability of
the industry.                                                               Data Storage Tags Implantation and
    Recently, our research group performed lab-based tests to               Attachment
examine the feasibility and validity of using Star-Oddi (https://           Salmon were simultaneously implanted/equipped with two DSTs
www.star-oddi.com; Gardabaer, Iceland) centi-HRT ACT DSTs                   produced by Star-Oddi. The Milli-TD tag (diameter, 13 mm;
(which measure temperature; electrocardiograms, ECGs; heart                 length, 39.4 mm; weight in air 12 g; version 15 DM/CRC16/4800)
rate, fH ; and heart rate variability, HRV; and 3-D acceleration),          records depth (0–100 m; 0.6% accuracy) and temperature
in combination with Milli-TD tags (which measure temperature                (−3 to 40◦ C; ± 0.1◦ C accuracy). The milli-HRT ACT tag
and depth) on Atlantic salmon (Zrini and Gamperl, 2021).                    (diameter, 13 mm; length, 42 mm; weight in air 12 g; version 35
These studies showed that Star-Oddi’s parameters of external                CRC16/4800/MSO/RST) records heart rate, tri-axial acceleration
acceleration (EA; a calibrated and normalized calculation of                (with a resolution of ± 2 mg), and temperature (5–45◦ C; accuracy
the vector of dynamic body acceleration, or VeDBA) and                      up to ± 0.2◦ C). The time recorded from both tags is accurate to
VAR (variation in EA) can be used to estimate swimming                      ± 1 min month−1 . The combined mass of the tags did not exceed

Frontiers in Physiology | www.frontiersin.org                           2                                   August 2021 | Volume 12 | Article 719594
Gamperl et al. Sea-Caged Salmon During Heat Wave
2% of the body mass of the fish, and thus, was consistent with the by divers of the company. Between October 3rd and 7th,
recommendations/findings for the use of tags in fish (Makiguchi the fish were harvested, and the tags were removed by
and Kojima, 2017; Wright et al., 2019). workers on the processing line of the company. The fish were
Prior to implantation, the DSTs were inserted into Star-Oddi’s identified by workers using the external Milli-TD tags. No post-
tag-computer interface (COM-BOX). Both tags were set (using mortem dissections or measurements were conducted in this
Sea Star software for the Milli-TD tags and Mercury software experiment. After retrieving the tags from the company, the
for the milli HRT-ACT tags) to begin recording on July 11th, data was downloaded using the COM-BOX and Mercury/SeaStar
2019 at 4:00 a.m. Newfoundland Standard Time (UTC-3:30). software (Star-Oddi).
The Milli-TD tags were set to record depth and temperature
every 5 min. The milli-HRT ACT tags were set to record heart
rate (based on ECGs recorded at 100 Hz for 15 s), acceleration Data Analyses
(at 1 Hz for 60 s), and temperature every 2 h, and to save the All measurements of heart rate (f H ) were provided with a unit-
associated electrocardiograms (ECGs) and raw accelerometry less measurement known as the quality index (QI) determined by
data every fourth measurement. The Milli-TD tags were prepared the Mercury software. This measurement represents the quality
for external attachment using Star-Oddi’s plate holder kit, which of the ECG signal, where QI0 means very good quality and
consisted of two silicone pads and two plastic molds. Prior to indicates that the variation in the R-R interval was 222 m-g2 were used to
the tag and plate holder kit were guided through the needles, determine when the fish was not constantly swimming; that is,
the needles were removed, and the four wires exiting the muscle they were engaged in burst-coast swimming (Zrini and Gamperl,
were passed through a silicone pad and plastic mold, and twisted 2021) or potentially struggling etc. Visual analysis of the raw
together [refer to Zrini and Gamperl (2021) for pictures]. Fish activity data showed evidence that tag MAL0011 rotated ∼90
were then returned to a ventral side up position, and Vet-bond degrees inside the fish and average and minimum EA values were
and Polysporin R were applied to the incision. The surgery took higher than the other four fish or previously reported values
an average of 12 ± 2 min (range 10–17 min). Prior to being (Zrini and Gamperl, 2021). A similar issue occurred with tag
returned to the sea-cage, the salmon were given time to recover MAL0025 later in the trial as minimum EA values began to
in the live well until they were actively swimming (∼10–15 min). deviate from 0 m-g indicating movement of the tag unrelated
The fish and tags were recovered for one of two reasons: to the movement of the fish, however, there was no evidence of
they were a pre-harvest mortality or at harvest. Fish that the tag rotating. All EA and VAR data from tag MAL0011 and
died in the cage sunk to the bottom, and were collected data after August 18th from tag MAL0025 were removed from
Frontiers in Physiology | www.frontiersin.org 3 August 2021 | Volume 12 | Article 719594Gamperl et al. Sea-Caged Salmon During Heat Wave
TABLE 1 | Body measurements, the date of the last viable heart rate determined from stored ECGs, and the estimated time of harvest from the sea-cage determined
from by the depth data.
Fish number Milli-HRT ACT Milli-TD Initial weight with Length (cm) Last reliable heart Time of removal
tags (kg) rate from the cage
1 MAL0011 B2672 2.00 56 Oct. 7 Oct. 7
12:00 AM 6:45 AM
2 MAL0014 B2657 2.87 62 Oct. 3 Oct. 3
12:00 AM 11:50 AM
3 MAL0017 B2651 2.35 60 Oct. 7 Oct. 7
12:00 AM 6:50 AM
4 MAL0018 NA 3.35 65 Oct. 3 NA
12:00 AM
5 MAL0025 B2671 3.39 65 Oct. 7 Oct. 7
12:00 AM 10:15 AM
6 NA B2669 2.15 58 NA Oct. 4
10:00 AM
7 NA B2653 1.80 55 NA Oct. 4
12:20 PM
8 NA B2666 2.84 61 NA Oct. 3
11:55 AM
NA represents tags that were not retrieved upon harvest.
the analysis. These issues did not affect the quality of the ECGs The level of statistical significance used in all analyses was P <
recorded in these tags. 0.05, and data in the figures, tables, and text are means ± SE.
The f H and depth data were used to determine the exact time
of death and removal from the sea-cage, respectively, of each RESULTS
harvested fish (Table 1). The earliest time of death was October
3rd at 4:00 a.m., and thus, data were analyzed between July 11th Fish Survival, Tag Recovery, and Harvest
at 4:00 a.m. and October 3rd at 11:55 p.m. (i.e., over 84 days). Within the first 19 days following implantation, three tagged fish
Information on the sunrise and sunset on the south coast of died; one fish was retrieved on July 12th, and two were retrieved
Newfoundland between these times were retrieved from https:// on July 30th. In two of these fish, it appears that the surgical
sunrise-sunset.org. Data were sorted into “day” and “night” site had not completely healed based on limited notes taken by
values based on the time of sunrise or sunset for a given day. the divers. The data for the other fish were examined, and no
Day and night-time averages were calculated for f H , average EA, deviations from that of the surviving fish were noted (i.e., f H , EA
the percentage of values indicating non-steady swimming, the and depth values appeared normal/typical, and the former closely
percentage of QI0 ECGs, depth, and temperature. tracked changes in temperature (data not shown)). From these
three fish, all six tags were recovered. Tags from eight out of nine
Statistics of the remaining fish were retrieved (five milli-HRT ACT and
All graphing and statistical analyses were performed using seven Milli-TD tags). The reason(s) for the one missing fish is/are
Prism 8 (GraphPad Software, Inc., San Diego, CA, USA). not known, however, it is possible that this fish died in the sea-
Linear regression analyses were used to examine how the daily cage and was not recovered by the divers. It is also possible that
percentages of QI0, QI1 , QI2 , and QI3 ECGs, and the absolute its tags were not collected or missed on the processing line. The
difference in heart rate, changed over time. Average values initial weights and lengths, approximate time of death, and time
of depth, temperature, heart rate, HRV, external acceleration, of removal of the fish from the sea-cage are shown in Table 1.
and percentage of non-steady swimming were calculated for
1-week periods (i.e., July 20–27, August 3–10, 17–24, August Heart Rate Calculations and Quality
27–September 3, and September 21–28). Two-way repeated Analysis
measures ANOVAs were used to analyze this data with time The f H measurements recorded by the tag had the following
and photoperiod as fixed-effects, followed by Bonferroni multiple distribution of QI values during the experimental period: QI0 =
comparison tests to determine statistical differences within 42.5 ± 7.3%, QI1 = 48.4 ± 6.7%, QI2 = 4.5 ± 2.1%, and QI3 =
photoperiod groups. Individual and average values of f H and 4.6 ± 2.2%. Out of 1,007 f H measurements recorded per fish, 251
EA were plotted against their associated temperature values, and associated ECGs were saved to the memory of the tag. From the
heart rate was plotted vs. external acceleration. The first 14 days saved ECGs, only 2.4 ± 2.1% of f H values could not be calculated
of data were removed in this analysis to account for surgical because of artifacts in the ECG rendering the PQRS complex
recovery (Zrini and Gamperl, 2021). Linear regression analyses unidentifiable. The measurements of f H with saved ECGs were
were used to examine the relationships between these parameters. replaced with their manually calculated values. Of the newly
Frontiers in Physiology | www.frontiersin.org 4 August 2021 | Volume 12 | Article 719594Gamperl et al. Sea-Caged Salmon During Heat Wave
adjusted and remaining original f H values, 3.85 ± 1.8% were around July 30th, there was a gradual increase in surface water
outliers (< 10 bpm or > 150 bpm) and were removed. The temperatures and the depth that warm temperatures reached.
majority of the outliers were ≤ 2 bpm (∼ 91%) indicating that the For example, water temperatures were generally 16–18◦ C (but
PQRS amplitude was misidentified by the on-board algorithm. occasionally above 18◦ C) at depths down to 5 m, and the depth
The quality of the ECGs decreased over the duration of the at which temperatures were above 14◦ C gradually increased
tagging trial as indicated by a decreasing percentage of QI0 , or from ∼2–3 to 15 m on August 16th (Figures 1, 3C,D). During
“good” quality, ECGs (y = −0.26x + 51.67; R2 = 0.30; P < this period, the mean depth of the fish gradually increased
0.0001; data not presented). While the percentage of QI1 ECGs to ∼5 m, although the fish went as deep as 12–15 m and
did not change (P = 0.9185), the percentage of ECGs with showed little depth preference (Figures 1, 3C). Temperatures
QI2 (y = 0.11x + 0.09; R2 = 0.36; P < 0.001) and QI3 values at the surface of the cage remained >16◦ C over the next
increased (y = 0.16x – 2.02; R2 = 0.58; P < 0.001). Further, the week (∼ August 16th−22nd), and the salmon made limited
absolute difference between the values manually calculated and use of surface waters (Figures 1, 2, 3E). During this week,
those calculated by the on-board algorithm increased over time maximum temperatures were recorded for four of the seven
(y = 0.10x – 0.22; R2 = 0.15; P < 0.001; data not presented). fish (range 19.2–19.4◦ C) (Table 2), with the average 10 highest
Nonetheless, the mean absolute difference in f H was only 4.1 ± temperatures for all fish ranging from 18.5 to 19.1◦ C (Table 3).
0.40 bpm (ranging from 0 to 276 bpm), with 66.7% of f H values Thereafter, the fish moved slightly deeper in the cage, and
being < 1 bpm different and 89.7% being < 5 bpm different. the mean day-time and night-time depths between August
The absolute difference in f H increased with QI value: QI0 = 1.0 22nd and September 9th were ∼ 9–10 and 6–7 m, respectively.
± 0.3 bpm, QI1 = 1.8 ± 0.7 bpm, QI2 = 19.6 ± 7.4 bpm, and However, they also spent a considerable amount of their time
QI3 = 45.8 ± 0.8 bpm. (∼40%) below 10 m during this period, and some fish were
occasionally measured at depths between 15 and 18 m (the
Cage-Site Conditions and Fish Distribution latter likely due to the conical nature of the bottom of the
Only a partial dataset was available for the water-oxygen level cage, and possibly the accumulation of mortalities) (Figures 1,
in this cage, and temperature data were only taken inside the 3G). They remained at these depths (where water temperatures
cage perimeter at the surface and at 5, 10, and 15 m. Given the were ∼14–16◦ C) until water temperatures became considerably
coarseness of this data, the fact that the tagged salmon were cooler about September 9th when hurricane Dorian passed over
found at various depths over the course of a day (e.g., as shown Newfoundland and this resulted in a mixing of the water column
in Figure 1, Supplementary Figure 1), and that the Milli-TD tag (i.e., homogenous water temperatures with depth; ∼8–12◦ C).
recorded depth and temperature every 5 min, we used the latter After this change in temperature, the mean depth that the fish
data to produce a detailed depth/temperature profile for the cage occupied gradually decreased, but again the mean depth of the
from July 11th to October 3rd (Figure 2). salmon during the day was ∼2 m deeper than that observed
During the first 5 days of recovery, temperatures in the at night; these values ∼3 and 5 m, respectively (Figures 2, 3I).
cage were relatively homogenous, with temperatures ranging This was because, although diurnal patterns of depth preference
from 10 to 12◦ C, with the fish mainly occupying the top 2– were often observed over the course of the study for all fish
3 m (Figures 1–3; Supplementary Figure 1). After this point, to this point, diurnal movement (depth) patterns (shallower
the surface waters (< 2 m) warmed to 14–16◦ C, and the fish during the night, deeper during daylight hours) were particularly
frequented these depths despite having access to cooler (8– evident for many fish during this final period (as shown in the
10◦ C) waters deeper in the cage (Figures 1, 3A,B). Beginning Supplementary Figure 1).
FIGURE 1 | Mean depth (in gray) and temperature (in black) measured every 5 min in seven Atlantic salmon fitted with Milli-TD tags over the duration of the study. For
data on individual fish, see Supplementary Figure 1.
Frontiers in Physiology | www.frontiersin.org 5 August 2021 | Volume 12 | Article 719594Gamperl et al. Sea-Caged Salmon During Heat Wave
FIGURE 2 | Cage-site temperature data at various depths over the duration of the study. The data were obtained from the Milli-TD tags that were attached to the
seven salmon that were retrieved at the end of the study. The Lowess curves show the mean depth that the fish occupied during the day (broken line) and night (solid
line).
Heart Rate and Activity (EA) measurements that could be categorized as non-steady
At the start of the experiment, when mean temperature swimming (∼ < 10 vs. >20%, Table 4, Figures 2D,E). Further,
experienced by the fish was ∼10◦ C, heart rates were ∼60 bpm although there was no overall relationship between EA and
during the day and 50 bpm during the night (Figure 4C). heart rate (Figure 5C), this period was associated with the
The salmon’s mean fH fell to ∼47 bpm after 2 weeks of biggest difference in heart rate during the day vs. the night
recovery, despite water temperature being slightly warmer (Figure 4C).
(∼12–14◦ C). This higher heart rate during the day, based
on the data for individual fish, was normally observed for
DISCUSSION
the duration of the experiment. Changes in mean heart rate
closely followed those of the temperature of the fish (Figure 5, Fish Survival and Tag Recovery
see Supplementary Figure 2 for individual data), with a heart We attribute the early mortality of the three fish to complications
rate during the peak temperature period (mean ∼ 17◦ C) on related to surgery (e.g., poor wound healing), and/or the
August 15th of ∼70–80 bpm (Figure 4C). Thereafter, heart combined stressors of surgical procedures and anesthesia
rates generally decreased and reached ∼ 37 and 28 bpm, (Wright et al., 2019; Hvas et al., 2020). The experience level
respectively, prior to harvest when mean water temperatures of the surgeon has been shown to significantly alter wound
were ∼6–8◦ C. Elevated values of HRV were recorded in healing and recovery of rainbow trout (Oncorhynchus mykiss;
the night-time for the first 17 days following surgery, and Hjelmstedt et al., 2020). However, this was unlikely to have
average day-time and night-time values were ∼109 and 189 ms, been the cause of the salmon mortalities in this study as the
respectively, between July 20 and 27th (Table 4, Figure 4D). surgeon (Z.A.Z.) had considerable experience (see Zrini and
HRV, while ∼40 ms higher in the night-time, remained low Gamperl, 2021; Zrini et al., 2021) and surgical times were
during the trial until temperatures began to decrease following short (average 12 min). That said, recovery location might have
hurricane Dorian. Heart rate variability was significantly related been a contributing factor. For example, Brijs et al. (2018)
to temperature (Figure 5B) and night-time values reached a were able to recover rainbow trout in a facility for 1 week
peak of 270.8 ± 10.9 ms when temperatures were 10.2◦ C. prior to releasing them back into the sea-cage and had 0%
External acceleration averaged ∼4 m-g at the beginning of the mortality. A recovery facility was not available for this project
experiment, increased to ∼8 m-g between August 25th and but may increase survival in future studies. The missing tags
September 9th, and then decreased gradually (Figure 4E). In may have been expelled/become unattached in the cage, not been
the above timeframe, values of EA during the day were much identified on the processing line, or could have been associated
higher than during the night (by ∼ 4 m-g), and this increased with mortalities that were not recovered from the cage. The
activity was associated with a much greater percentage of activity latter explanation is certainly possible as Macaulay et al. (2021)
Frontiers in Physiology | www.frontiersin.org 6 August 2021 | Volume 12 | Article 719594Gamperl et al. Sea-Caged Salmon During Heat Wave FIGURE 3 | (A–J) Histograms showing the depth distribution and the temperatures experienced by the fish during various periods of the study. July 20th−27th, ∼ 2 weeks after tag implantation; August 3rd−10th, period of highest surface water temperatures; August 17th−24th, start of mortalities in cage-sites in the region; August 27th–September 3rd; period of high mortalities in cage-sites in the region; September 21st−28th, after temperatures cooled down. Gray bars represent day-time values, whereas black bars represent night-time values. Frontiers in Physiology | www.frontiersin.org 7 August 2021 | Volume 12 | Article 719594
Gamperl et al.                                                                                                                    Sea-Caged Salmon During Heat Wave

TABLE 2 | The highest temperature experienced by each salmon based on the data from their external tags (Milli-TD, fish numbers listed on top of each column), and the
date, depth, and time of day that this value was recorded.

                                                                                        Fish number

                          1                        2                   3                       5                       6                     7                      8

Date                 Aug. 21                    Aug. 7              Aug. 7                 Aug. 21                  Aug. 7               Aug. 21                  Aug. 21
Time                 9:25 PM                    4:55 PM           10:40 PM                 9:30 PM                  4:55 PM              8:55 PM                   9:30/
Temp.                19.41◦ C                   19.37◦ C           19.12◦ C                19.18◦ C                 19.49◦ C             19.42◦ C               19.28◦ C
Depth                   0.58 m                  0.00 m              0.33 m                  3.33 m                  0.56 m                0.12 m                   1.77

TABLE 3 | The average 10 highest temperatures (◦ C) per time period, recorded from the external tags (Milli-TD, fish numbers listed on top of each column) that were
attached to the salmon.

                                                                                       Fish number

                                 1                     2               3                   5                    6                    7                   8

July 20–27                15.3 ± 0.03            15.4 ± 0.04     15.5 ± 0.06           15.5 ± 0.06         15.5 ± 0.04         15.2 ± 0.03          15.2 ± 0.03
Aug. 3–10                 19.0 ± 0.18            18.8 ± 0.42     18.9 ± 0.12           18.4 ± 0.16         19.2 ± 0.14         17.7 ± 0.41          18.6 ± 0.20
Aug. 17–24                19.1 ± 0.19            18.8 ± 0.12     18.5 ± 0.05           18.7 ± 0.27         18.7 ± 0.36         19.0 ± 0.36          19.1 ± 0.15
Aug. 27–Sept. 3           16.2 ± 0.06            16.2 ± 0.08     16.1 ± 0.07           16.1 ± 0.09         16.2 ± 0.06         16.2 ± 0.06          16.4 ± 0.03
Sept. 21–28               11.8 ± 0.06            11.8 ± 0.03     11.4 ± 0.08           11.9 ± 0.08         12.1 ± 0.08         11.6 ± 0.03          11.7 ± 0.06
July 11–Oct. 3            19.2 ± 0.17            19.0 ± 0.19     18.9 ± 0.12           18.7 ± 0.25         19.3 ± 0.13         19.0 ± 0.32          19.1 ± 0.15

Data are means ± S.E.

indicate that the percentage of tagged fish that die increases                             For the first 5–6 weeks, there was little difference in the mean
markedly with the duration of the study/trial, and our study                           depth occupied by the salmon during the day vs. the night
lasted >2.5 months.                                                                    (although this pattern was still discernable for individuals). This
                                                                                       may have been partially related to the fact that temperatures
                                                                                       above 12◦ C were only present over a very narrow range of
Salmon Distribution and Behavior                                                       depths (i.e., generally in the top 2–3 m; Figure 2). Indeed, earlier
Salmon Depth Distribution                                                              studies suggest that the temperature preference of salmon is
For the first week to 10 days post-implantation, the salmon                            more strongly expressed when temperature stratification is more
remained in the top 0–4 m of the cage and made infrequent                              prominent (Oppedal et al., 2007). In contrast, after ∼ August
excursions into waters deeper than 10 m. However, as surface                           25th, a clear diurnal pattern in mean depth occurred with
temperatures increased, their mean depth increased to 8–10 m,                          fish ∼2–4 m deeper during the day than night. This diurnal
and they made frequent trips to deeper and cooler waters                               pattern of depth distribution has been reported by several
(Figures 1, 3, 4, Supplementary Figure 1). While their depth                           authors for salmon (refer to Oppedal et al., 2011), and may
was influenced by a number of factors (see below), it is                               have been enhanced after August 20th due to the cessation
apparent that when access to a variety of water temperatures                           of feeding and/or reduced feeding. Nonetheless, we did not
was available, they preferred temperatures from ∼14 to 18◦ C,                          observe that the salmon utilized more of the cage depth at
and generally avoided temperatures > 18◦ C. This data fits with                        night (Figure 3) as has been reported by previous authors
the notion that temperature is the primary (most influential)                          (Oppedal et al., 2001; Dempster et al., 2008; Korsøen et al.,
factor affecting salmon depth distribution in sea-cages (Oppedal                       2009).
et al., 2011) and with the preferred temperatures of 13.5◦ C
(Sutterlin and Stevens, 1992) and 16.5–17.5◦ C (Johansson et al.,                      Swimming Activity
2006) reported for Atlantic salmon in net pens. Further, this                          External acceleration generally ranged from 4 to 8 m-g over
data is consistent with temperatures reported for the optimum                          the study and the percentage of time that they were estimated
growth of this species (14–18◦ C: Jobling, 1981; Sambraus                              to be engaged in non-steady (i.e., burst-and-coast) swimming
et al., 2018). When temperatures were at peak levels (∼ July                           was generally below 10–12% (Figures 4E,F). Based on the swim
30th–August 25th), the mean depth of the fish increased (see                           tunnel calibrations performed by Zrini and Gamperl (2021),
above). However, it was clear that most of the fish continued                          these values of EA equate to swimming speeds from 0.4 to
to utilize the entire depth of the cage (i.e., they were not                           1.0 body lengths per second (∼ 25–60 m s−1 ). This range
restricted to, or “crowding” at, particular depths), and that there                    of values is very close to that reported by other authors for
were no abrupt temperature changes with depth (Figures 1, 2,                           adult (large) salmon when using underwater cameras (Korsøen
Supplementary Figure 1).                                                               et al., 2009; Oppedal et al., 2011). There were noticeable

Frontiers in Physiology | www.frontiersin.org                                      8                                           August 2021 | Volume 12 | Article 719594
Gamperl et al. Sea-Caged Salmon During Heat Wave
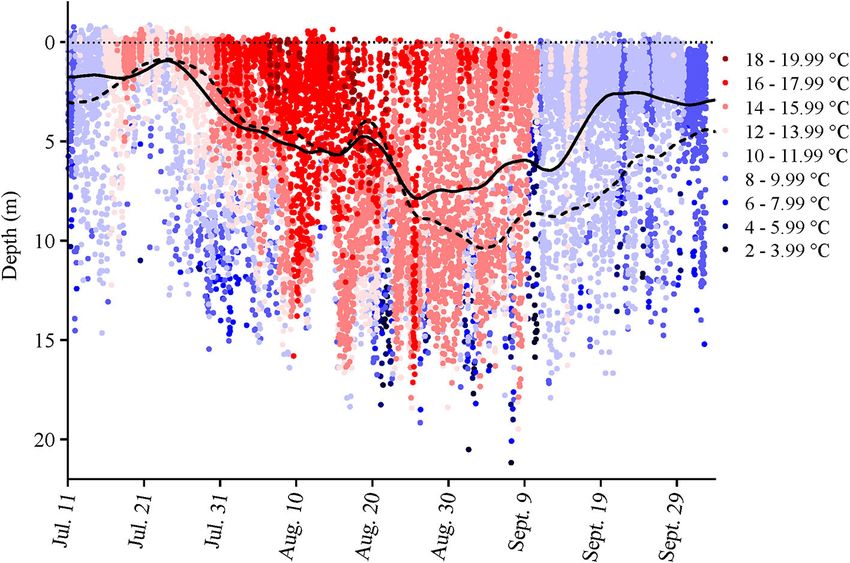
FIGURE 4 | (A–F) Average day-time (open circles) and night-time (filled circles)
values for depth, temperature, heart rate, heart rate variability, external
acceleration, and the percentage of non-steady swimming measured for five FIGURE 5 | Relationships between recorded temperatures and heart rate (A),
fish over the duration of the study. Values are means ± S.E. (N = 5). heart rate variability (B) and external acceleration (C), and between heart rate
1—indicates the day that feeding was stopped or greatly reduced until surface and external acceleration (D). Each plot represents 838 individual data points
water temperatures fell below 18◦ C; 2—indicates the period when there were (B, 209 data points calculated from saved ECGs) recorded over the duration of
mass mortalities in many cage-sites in the region where this cage-site was the study and excludes the first 14 days of data to account for surgical
located. 3—indicates when hurricane Dorian moved over the south coast of recovery (N = 5).
Newfoundland.
the start of the study, rose steadily to ∼8 m-g by August
differences in EA and the percentage of time spent non-steady 25th, remained at this level for ∼2 weeks, and then began to
swimming over the course of the study. EA was ∼4 m-g at decline. Swimming speed has been reported to vary with season
Frontiers in Physiology | www.frontiersin.org 9 August 2021 | Volume 12 | Article 719594Gamperl et al. Sea-Caged Salmon During Heat Wave
(Oppedal et al., 2001), and the observed pattern in EA/swimming takes for fish to completely recover from the implantation of
speed would appear to be related to temperature based on the DSTs. Brijs et al. (2019) and Føre et al. (2021) estimated that
similar pattern of change in these two parameters (i.e., compare it can take as little as 4–6 days for f H to reach baseline/steady
Figures 4B,E) over the course of the study. However, there state values post-surgery/tag implantation. However, based on
was absolutely no relationship between temperature and EA the present f H data, and the long-term data sets provided by Zrini
based on analysis of the mean data (Figure 5C) or of individual and Gamperl (2021) and Hvas et al. (2020), it is clear that f H is
fish (Supplementary Figure 2). Sea-cages are known to have often not stable for at least 2 weeks post-surgery/implantation.
environmental conditions that are highly variable with space This conclusion agrees with the HRV data collected in this
and time (Oppedal et al., 2011), and other factors such as day study. HRV was significantly elevated during the night-time (by
length, water currents, etc., must have influenced fish locomotor up to 2-fold) for the first 17 days post-surgery/implantation
activity. Interestingly, EA and the percentage of values indicating (Figure 4D).
non-steady swimming were highest between ∼ August 25th
and September 8th, particularly during the day. This increase Factors Affecting Heart Rate and HRV
in EA and the percentage of non-steady swimming may have After 2 weeks of recovery, mean f H at 12◦ C was ∼ 47 bpm,
been related to the cessation of, or reductions in, feeding at the and this parameter was clearly dependent on water temperature
cage-site when surface temperatures exceeded 18◦ C (Figure 3). and time of day over the course of this study. For example,
When hungry, fish may increase swimming speed to increase the pattern of changes in mean f H and temperature was very
their chance of finding food (Kadri et al., 1991; Boisclair, 1992). similar (Figures 4B,C); f H during both the day-time and night-
However, the influence of long-term reductions in feeding, or time was significantly related to temperature (p < 0.001) and
food deprivation, on fish activity/swimming speed, and behavior had Q10 values from 9 to 19◦ C of ∼2.0 and 2.6, respectively
has yet to be reported. (Figure 5A); and f H was ∼ 12 bpm higher in the day-time as
compared to the night-time (Figure 5A). The f Hs reported for
Heart Rate and Heart Rate Variability (HRV) our salmon at various temperatures are extremely similar to
Heart Rate Calculations and Quality Analysis those recorded by several authors for free-swimming rainbow
The quality of ECGs recorded decreased over the duration of the trout (O. mykiss) and salmon fitted with data loggers once
tagging trial and was associated with an increase in QI2 and QI3 temperature is taken into account (temperatures 4–14◦ C; Brijs
values. QI2 values indicate that the ECGs had reduced quality et al., 2018, 2019; Hjelmstedt et al., 2020; Hvas et al., 2020,
and QI3 values indicate that no R-R intervals were identified. 2021; Føre et al., 2021; Svendsen et al., 2021). However, they
Reductions in ECG quality could be due to the movement of are much lower than those measured in salmon of similar
the tag during the trial; however, this cannot be substantiated stocks fitted with blood flow probes in respirometers after 1–
as post-mortem dissections were not conducted. While there 2 days of recovery (e.g., see Penney et al., 2014). These latter
was evidence of tag MAL0011 rotating inside Fish 1, this was values are ∼15 bpm higher than measured in the sea-cages,
only associated with changes in the activity measurements and and thus, this cautions against using data from such lab-based
not decreases in ECG quality. It is possible that the sutures experiments to estimate the f H of fish in sea-cages. That there
loosened in the other fish and that the tag moved to a position was a diurnal difference in f H in the present study is also
slightly further from the heart, resulting in reduced quality consistent with the literature (see Aissaoui et al., 2000 and
of the ECGs (Brijs et al., 2018). Nonetheless, QI0 and QI1 references herein). Data from previous studies appear to suggest
were still < 2 bpm from manually calculated values, and thus, that the difference in f H in free-swimming salmon between
this was not a major issue with regard to the accuracy of the day-time and night-time increases with water temperature;
the collected data. The increased number of QI3 ECGs was i.e., it was reported to be ∼5 bpm at 4–5◦ C (Føre et al.,
associated with low f H values later in the summer as the 2021; Svendsen et al., 2021), 10 bpm at 10◦ C (Hjelmstedt
temperature began falling. The dilemma of recording low f H et al., 2020; Hvas et al., 2021), and 25 bpm at 14–15◦ C (Brijs
values with data loggers has been documented previously and et al., 2018). However, our data, where the difference in f H
is a trade-off between memory, battery life, and the maximum was consistently ∼ 12 bpm in the salmon from ∼ 8–19.5◦ C,
usable tag size for a given fish (Brijs et al., 2019; Zrini and does not support this conclusion. Brijs et al. (2018) suggested,
Gamperl, 2021). While a longer recording interval (e.g., 15 s based on other studies, that the primary factor determining
at 100 Hz) is now available with the Star-Oddi’s “long ECG” this circadian difference in f H was diurnal changes in activity.
function and helped to combat this issue in the study, caution However, it is clear that this was not the case in this study
is warranted when working with fish with low intrinsic f H s and where both f H and acceleration (swimming activity/swimming
at low temperatures. speed) were measured simultaneously. External acceleration did
not differ between night and day (Figure 5C), and the R2 -
Time Required for Recovery values on the relationships between f H and EA wereGamperl et al. Sea-Caged Salmon During Heat Wave
TABLE 4 | Average day-time and night-time (gray shading) values for depth, temperature, heart rate, and measures of activity for the sea-caged salmon during particular
1-week–periods: i.e., July 20th−27th, ∼ 2 weeks after tag implantation; August 3rd−10th, period of highest surface water temperatures; August 17th−24th, start of
mortalities in cage-sites in the region; August 27th–September 3rd; period of very mortalities in cage-sites in the region; September 21st−28th, after temperatures cooled
down.
Depth (m) Temp. (◦ C) Heart rate (bpm) Heart rate variability (ms) External acceleration (m-g) Non-steady swimming (%)
July 20–27 1.1 ± 0.2a 12.7 ± 0.1a 51.7 ± 1.9a 109.1 ± 21.4 4.5 ± 0.3a 2.0 ± 0.7
1.8 ± 0.4A 12.3 ± 0.1A 41.9 ± 1.8A 189.1 ± 15.4A 3.7 ± 0.2A 1.6 ± 0.9
Aug. 3–10 5.2 ± 0.7b,c 15.1 ± 0.4b 62.9 ± 2.0b 76.7 ± 5.4 5.3 ± 0.5a,b 3.3 ± 1.8
B B B AB
5.7 ± 0.7 14.9 ± 0.3 55.1 ± 2.1 129.9 ± 9.4 4.6 ± 0.4A,B 4.7 ± 1.9
Aug. 17–24 9.1 ± 0.6d 14.0 ± 0.4a,b 62.2 ± 2.0b 91.2 ± 13.7 7.3 ± 0.8a,b 2.7 ± 1.2
7.6 ± 0.7B 14.5 ± 0.5B 55.7 ± 1.6B 140.2 ± 16.7A,B 7.3 ± 0.9A,B 3.8 ± 2.4
Aug. 27–Sept. 3 8.9 ± 1.1b,d 14.0 ± 0.4a,b 66.4 ± 0.8b 84.1 ± 18.1 10.1 ± 0.6b 10.9 ± 2.4
6.0 ± 0.9BC 14.7 ± 0.3B 56.4 ± 1.0B 107.3 ± 15.7B 9.1 ± 0.7B 9.9 ± 2.2
a,c c c
Sept. 21–28 3.9 ± 1.0 10.1 ± 0.1 42.9 ± 1.2 157.5 ± 35.1 8.1 ± 2.0a,b 4.2 ± 1.5
2.3 ± 0.3A,C 10.2 ± 0.0C 30.8 ± 0.6C 270.8 ± 10.9C 7.8 ± 2.2A,B 1.6 ± 1.0
Values are means ± S.E. Within a column, values without a letter in common are significantly different (P < 0.05), N = 5. Note: data for the day and night were analyzed separately.
Dissimilar lower and upper case letters indicate day-time and night-time values, respectively, that are significantly different.
in f H in fishes are predominantly due to an endogenous Campbell and Egginton, 2007) compared, before the HRV data
circadian rhythm based primarily on external light reception. that can be generated from the ECG data can be appropriately
At present, the mechanism(s) mediating this effect in fish is/are interpreted with regards to the biology/culture of free-swimming
not completely understood. However, Marchant and Farrell fish. For example, why was HRV higher during the night than
(2019) recently showed that the pacemaker cells of the heart during the day given that there was no difference in EA/activity
have both membrane and calcium “clocks,” and suggest that (Figure 5B)?
the latter is involved in the control of heart rate with changes
in temperature. What Does This “Real World Experiment”
Although there was a very weak overall relationship between Tell us?
EA (activity) and f H (Figure 5D), it was clear between August The data reported in this experiment were recorded during a
25th and September 9th that f H , EA and the percentage of heat wave in Newfoundland where surface water temperatures
time spent non-steady swimming were all elevated during the in the sea-cages exceeded 18◦ C for approximately one-half
day. Again, this may be related to the increased swimming of the days in August, oxygen levels in some of the cages
activity of the fish when they were not being fed, as f H increases on the south coast of Newfoundland approached 70% of air
in a linear fashion with swimming speed (e.g., refer to Zrini saturation, and significant (up to 100%) mortalities were reported
and Gamperl, 2021) to meet increased metabolic demands of at some cage-sites. A report commissioned to determine the
this fish. cause of the mortalities (Burke et al., 2020) concluded that
Heart rate variability was high during the first 2 weeks post- these environmental conditions were the primary cause of the
surgery and increased during the day and the night between large number of salmon deaths. However, more recent data
August 30th and when the salmon were harvested. This latter on the effects of these conditions on fish physiology (Gamperl
increase was clearly related to the decrease in water temperatures et al., 2020, Zanuzzo et al., 2020; Beemelmanns et al., 2021a,b,c),
over this period as HRV was negatively correlated at both and contained in this study, do not support this assertion.
times of day with water temperature (Figure 5B). This result For example, the salmon in the cage in which we had fish
is difficult to explain given recent publications showing that did not experience temperatures > 19.5◦ C; large (> 800 g)
HRV consists of oscillatory components caused by periodic salmon from similar stocks have been shown to tolerate elevated
vagal inhibition of the heart beat (Campbell and Egginton, temperatures as high as 21◦ C for prolonged periods when
2007) and that cholinergic tone changes little, or increases combined with water O2 levels of 60–70% saturation (lower than
only slightly, in rainbow trout with temperature (at least until the lowest O2 levels reported in the cages) without mortalities
temperatures approach the critical thermal maximum for the (Gamperl et al., 2020); salmon from Norway and Tasmania can
fish; CTMax ) (Ekström et al., 2014; Gilbert et al., 2019). It is tolerate prolonged exposure to similar temperatures (Hvas et al.,
possible that these disparate results are related to the recordings 2017; Tromp et al., 2018); the critical oxygen tension/limiting
being made on fully recovered free-swimming fish vs. fish in a oxygen saturation (LOS) for Atlantic salmon is ∼63–67% at
swim tunnel shortly after surgery, but doubtful. Clearly, long- 22◦ C (Barnes et al., 2011; Remen et al., 2013), well below
term ECG data need to be recorded under different temperatures the water oxygen level reported in the cages by Burke et al.
and other conditions, and the results of HRV (as calculated in (2020); and all the salmon implanted with data loggers that
this study) and power spectral analyses (Campbell et al., 2006; survived for several weeks post-implantation experienced similar
Frontiers in Physiology | www.frontiersin.org 11 August 2021 | Volume 12 | Article 719594Gamperl et al. Sea-Caged Salmon During Heat Wave
conditions to those reported in the summer of 2019. Thus, there changes in acceleration values if the tag shifts/rotates during
were likely other complicating factors. While the Burke et al. long-term studies (as occurred with DST MAL0011 in the
(2020) report does suggest that algal blooms, sea lice treatments present study).
(and possibly even infectious salmon anemia, ISA) may have Our data, in combination with other recently published data
contributed to the mortalities, the former is unlikely given the (Gamperl et al., 2020; Zanuzzo et al., 2020; Beemelmanns et al.,
minimum water air saturation levels that were reported (> 2021a,b,c; and see references above), also provide vital/key new
70%). However, the salmon at most sites were being treated information on how conditions at salmon cage-sites during the
for sea lice (Burke et al., 2020), and this may have been summer/early fall are likely to impact these fish in Atlantic
a critical/key factor. Overton et al. (2018) reported that sea Canada and suggest that a multi-faceted approach may/will be
lice treatments at cooler temperatures can result in salmon needed to prevent potential losses at salmon cage-sites under
mortalities ranging from 15 to 30%. A recent study showed current climate change scenarios (see IPCC, 2019). Given recent
that “high” levels of lice infestation (6.8 ± 0.4 lice per fish) data which suggest that Atlantic salmon of Saint John River
decreased the survival probability of post-smolt salmon at 19◦ C stock can survive long-term exposure to temperatures of > 21◦ C
by 25% (Godwin et al., 2020). In fact, the interpretation that in combination with moderate hypoxia (60–70% air saturation)
cage-site losses of salmon at high temperatures may result and that unlike fish in Tasmania (Stehfest et al., 2017; Wade
from temperature × pathogen interactions is supported by et al., 2019) have not yet experienced these temperatures, it
recent data for other fishes. For example, although significant is clear that selective breeding for upper thermal tolerance
mortalities occurred in southern Newfoundland when Atlantic (given its effects on food consumption, growth, and stress
cod cage-sites got to 19◦ C at the surface (16–17◦ C at 5 m) biomarkers; Gamperl et al., 2020; Beemelmanns et al., 2021a,b)
in 2003 (Gollock et al., 2006), Zanuzzo et al. (2019) showed is not only needed to improve production in the summer
that the critical thermal maximum (CTmax ) and incremental and to prevent losses that are predicted to get worse given
temperature maximum (ITmax ) of Atlantic cod are much greater rising average ocean temperatures and more frequent/severe heat
than these values (22.5 and 21.7◦ C, respectively), and that ITmax waves. Better vaccines against bacterial and viral diseases and
for this species was not impacted by moderate hypoxia (70% air mitigating strategies/treatments for pathogen outbreaks (incl. sea
saturation). A relationship between increasing water temperature lice) that cause minimal stress must also be developed. This is
and amoebic gill disease (AGD) prevalence has been noted in particularly true since recent studies show that the humoral and
Atlantic salmon cultured in several countries, and Benedicenti cellular immune response of the Atlantic salmon does not appear
et al. (2019) showed that salmon reared at higher temperatures to be impacted by long-term exposure to high temperatures
(10 vs. 15◦ C) had earlier infections and more severe parasite (Zanuzzo et al., 2020); i.e., genetic improvements to enhance
loads. Finally, Genin et al. (2020) suggest that while heat waves these components of the immune response may only have
(“warming events”) may not directly kill coral reef fish, bacterial limited effect.
infections that occur following these events can result in mass
mortality events.
Summary and Perspectives DATA AVAILABILITY STATEMENT
We implanted large (∼2.5 kg) salmon with data loggers/data
storage tags (DSTs) that recorded depth, temperature, ECGs The raw data supporting the conclusions of this article will be
(heart rate), and 3-D acceleration (activity) during the summer made available by the authors, without undue reservation.
of 2019 to better understand how conditions during this time
of year affect their distribution, behavior, and physiology in
sea-cages. This study clearly shows the usefulness of DSTs that
provide information on several parameters simultaneously
ETHICS STATEMENT
(such as those developed by Star-Oddi and the most recent All experimental procedures were performed in compliance with
tag developed through an Australian collaboration; refer the guidelines of the Canadian Council on Animal Care and were
to Shen et al., 2020) for studying aspects of salmon (fish) approved by the Memorial University of Newfoundland’s Animal
biology and welfare in culture. Specifically, this study has Care Committee. Written informed consent was obtained from
provided invaluable information on how various factors the owners for the participation of their animals in this study.
(photoperiod, temperature, and starvation/food restriction)
affect Atlantic salmon in sea-cages. Further, these tags
are continuously undergoing development to improve the
data they collect and their usefulness for studies on the AUTHOR CONTRIBUTIONS
biology of wild and culture fishes. For example, Star-Oddi:
has recently increased the maximum recording length for AG conceived the project, secured funding, and wrote the first
ECGs to 18 s; is now producing tags with the capability draft of the paper. AG, ZZ, and RS designed the experiment.
to record acceleration at 10 vs. 1 Hz [which will allow for ZZ and RS conducted the experiments, analyzed the data, and
the monitoring of a wider array of fish behaviors (Brown revised the manuscript. All authors interpreted the data and
et al., 2013)]; and has developed a method to correct for approved the submission of this article.
Frontiers in Physiology | www.frontiersin.org 12 August 2021 | Volume 12 | Article 719594Gamperl et al. Sea-Caged Salmon During Heat Wave
FUNDING staff of our industry partner for their assistance in planning
the research, experimental logistics, and their assistance at
This research is part of the Mitigating the Impact of the cage-site in Newfoundland. We thank Tasha Harrold for
Climate-Related Challenges on Salmon Aquaculture project management.
(MICCSA) project, and was funded by the Atlantic Canada
Opportunities Agency (781-9658-205222), Innovate NL (5404-
SUPPLEMENTARY MATERIAL
1209-104), the Innovate PEI Graduate and Post-Doctoral
Fellowship Fund, and several industrial partners (Somru The Supplementary Material for this article can be found
Biosciences; the Center for Aquatic Technologies Canada; and online at: https://www.frontiersin.org/articles/10.3389/fphys.
AquaBounty Canada). 2021.719594/full#supplementary-material
Supplementary Figure 1 | Individual depth and temperature profiles for fish 1
(A) −7 (F) created by recording these parameters every 5 min (288 times per day).
ACKNOWLEDGMENTS
Supplementary Figure 2 | Individual day-time (open circles, dotted lines) and
The authors want to thank Asgeir Bjarnason from Star-Oddi night-time (filled circles, solid lines) relationships between heart rate, heart rate
for his advice and technical support, Ellen Peroni for assistance variability, external acceleration, and temperature of individual fish (1: black; 2: red;
with implanting the DST’s in the fish, and the management and 3: green; 4: blue; and 5: purple).
REFERENCES of rainbow trout (Oncorhynchus mykiss) in aquaculture. Aquac 509, 188–197.
doi: 10.1016/j.aquaculture.2019.05.007
Aissaoui, A., Tort, L., and Altimiras, J. (2000). Circadian heart rate changes and Brown, D. D., Kays, R., Wikelski, M., Wilson, R., and Klimley, A. P. (2013).
light-dependence in the Mediterranean seabream Sparus aurata. Fish Physiol. Observing the unwatchable through acceleration logging of animal behaviour.
Biochem. 22, 89–94. doi: 10.1023/A:1007861118404 Anim. Biotelemetry 1, 1–20. doi: 10.1186/2050-3385-1-20
Altimiras, J., and Larsen, E. (2000). Non-invasive recording of heart rate and Burke, H., Gardner, I., and Farrell, A. P. (2020). A Review of the 2019 Newfoundland
ventilation rate in rainbow trout during rest and swimming. Fish go wireless! J. and Labrador South Coast Cultured Atlantic Salmon Mortality Event.
Fish. Biol. 57, 197–209. doi: 10.1111/j.1095-8649.2000.tb00786.x Department of Fisheries and Land Resources, Government of Newfoundland and
Anttila, K., Couturier, C. S., Øverli, Ø., Johnsen, A., Marthinsen, G., Nilsson, G. E., Labrador, Special, Studies, and Reports. Available online at: https://www.gov.nl.
et al. (2014). Atlantic salmon show capability for cardiac acclimation to warm ca/ffa/files/publications-pdf-2019-salmon-review-final-report.pdf (accessed
temperatures. Nat. Commun. 5:4252. doi: 10.1038/ncomms5252 August 1, 2021).
Armstrong, J. D. (1986). Heart rate as an indicator of activity, metabolic Burt, K., Hamoutene, D., Mabrouk, G., Lang, G., Lang, C., Puestow, T., et al. (2012).
rate, food intake and digestion in pike. Eox. Lucius. 29, 207–221. Environmental conditions and occurrence of hypoxia within production cages
doi: 10.1111/j.1095-8649.1986.tb05012.x of Atlantic salmon on the south coast of Newfoundland. Aquacult. Res. 43,
Barnes, R., King, H., and Carter, C. G. (2011). Hypoxia tolerance and oxygen 607–620. doi: 10.1111/j.1365-2109.2011.02867.x
regulation in Atlantic salmon, Salmo salar from a Tasmanian population. Campbell, H. A., and Egginton, S. (2007). The vagus mediates cardio-
Aquac 318, 397–401. doi: 10.1016/j.aquaculture.2011.06.003 respiratory coupling that changes with metabolic demand in a temperate
Beemelmanns, A., Ribas, L., Anastasiadi, D., Moraleda-Prados, J., Zanuzzo, F. nototheniod fish. J. Exp. Biol. 210, 2472–2480. doi: 10.1242/jeb.00
S., Rise, M. L., et al. (2021c). DNA methylation dynamics in Atlantic salmon 3822
(Salmo salar) challenged with high temperature and moderate hypoxia. Front. Campbell, H. A., Klepacki, J. Z., and Egginton, S. J. (2006). A new method in
Mar. Sci. 7:6047878. doi: 10.3389/fmars.2020.604878 applying power spectral statistics to examine cardio-respiratory interactions in
Beemelmanns, A., Zanuzzo, F. S., Sandrelli, R. M., Rise, M. L., and fish. Theor. Biol. 241, 410–419. doi: 10.1016/j.jtbi.2005.12.005
Gamperl, A. K. (2021b). The Atlantic salmon’s stress- and immune-related Clark, T. D., Sandblom, E., Hinch, S. G., Patterson, D. A., Frappell, P.
transcriptional responses to moderate hypoxia, an incremental temperature B., and Farrell, A. P. (2010). Simultaneous biologging of heart rate and
increase, and these challenges combined. G3: Ge. Gen. Genet. 11, 1–23 acceleration, and their relationships with energy expenditure in free-swimming
doi: 10.1093/g3journal/jkab102 sockeye salmon (Oncorhynchus nerka). J. Comp. Physiol. B 180, 673–684.
Beemelmanns, A., Zanuzzo, F. S., Xue, X., Sandrelli, R. M., Rise, M. L., and doi: 10.1007/s00360-009-0442-5
Gamperl, A. K. (2021a). The transcriptomic responses of Atlantic salmon Dempster, T., Juell, J.-E., Fosseidengen, J. E., Fredheim, A., and Lader, P. (2008).
(Salmo salar) to high temperature stress alone, and in combination with Behaviour and growth of Atlantic salmon (Salmo salar L.) subjected to
moderate hypoxia. BMC Genomics 22:261. doi: 10.1186/s12864-021-07464-x short-term submergence in commercial scale sea-cages. Aquac 276, 103–111.
Benedicenti, O., Pottinger, T. G., Collins, C., and Secombes, C. J. (2019). Effects of doi: 10.1016/j.aquaculture.2008.01.018
temperature on amoebic gill disease development: does it play a role? J. Fish. Ekström, A., Jutfelt, F., and Sandblom, E. (2014). Effects of autonomic
Dis. 42, 1241–1258. doi: 10.1111/jfd.13047 blockade on acute thermal tolerance and cardioventilatory performance
Boisclair, D. (1992). An evaluation of the stereocinematographic method in rainbow trout, Oncorhynchus mykiss. J. Therm. Biol. 44, 47–54
to estimate fish swimming speed. Can. J. Fish.Aquat. Sci. 49, 523–531. doi: 10.1016/j.jtherbio.2014.06.002
doi: 10.1139/f92-062 Eliason, E. J., and Anttila, K. (2017). “Temperature and the cardiovascular system,”
Breitburg, D., Levin, L. A., Oschlies, A., Grégoire, M., Chavez, F. P., and Conley, D. in Fish Physiology, The Cardiovascular System, Vol. 36B. eds. A. K. Gamperl,
J., et al. (2018). Declining oxygen in the global ocean and coastal waters. Science. T. Gillis, A. P. Farrell, and C. Brauner (Amsterdam: Elsevier), 235–297.
359:eaam7240. doi: 10.1126/science.aam7240 doi: 10.1016/bs.fp.2017.09.003
Brijs, J., Sandblom, E., Axelsson, M., Sundell, K., Sundh, H., Huyben, D., et al. Food and Agriculture Association of the United Nations, FAO (2020). Salmon’s
(2018). The final countdown: continuous physiological welfare evaluation of Upward Growth Trajectory Grinds to a Halt Over COVID-19. Available online
farmed fish during common aquaculture practices before and during harvest. at: http://www.fao.org/in-action/globefish/market-reports/resource-detail/en/
Aquac 495, 903–911. doi: 10.1016/j.aquaculture.2018.06.081 c/1296665/ (accessed August 1, 2021).
Brijs, J., Sandblom, E., Rosengren, M., Sundell, K., Berg, C., Axelsson, M., et al. Føre, M., Svendsen, E., Økland, F., Gräns, A., Alfredsen, J. A., Finstad, B.,
(2019). Prospects and pitfalls of using heart rate bio-loggers to assess the welfare et al. (2021). Heart rate and swimming activity as indicators of post-surgical
Frontiers in Physiology | www.frontiersin.org 13 August 2021 | Volume 12 | Article 719594You can also read