Mineralogical and chemical properties inversed from 21 lunar day VNIS observations taken during the Chang'E 4 mission
←
→
Page content transcription
If your browser does not render page correctly, please read the page content below
www.nature.com/scientificreports
OPEN Mineralogical and chemical
properties inversed
from 21‑lunar‑day VNIS
observations taken
during the Chang’E‑4 mission
Qinghong Zeng1, Shengbo Chen1,2*, Yuanzhi Zhang3, Yongling Mu1, Rui Dai1, Congyu Yang1,
Anzhen Li1 & Peng Lu1
We report on the mineralogical and chemical properties of materials investigated by the lunar
rover Yutu-2, which landed on the Von Kármán crater in the pre-Nectarian South Pole–Aitken (SPA)
basin. Yutu-2 carried several scientific payloads, including the Visible and Near-infrared Imaging
Spectrometer (VNIS), which is used for mineral identification, offering insights into lunar evolution.
We used 86 valid VNIS data for 21 lunar days, with mineral abundance obtained using the Hapke
radiative transfer model and sparse unmixing algorithm and chemical compositions empirically
estimated. The mineralogical properties of the materials at the Chang’E-4 (CE-4) site referred to as
norite/gabbro, based on findings of mineral abundance, indicate that they may be SPA impact melt
components excavated by a surrounding impact crater. We find that CE-4 materials are dominated
by plagioclase and pyroxene and feature little olivine, with 50 of 86 observations showing higher
LCP than HCP in pyroxene. In view of the effects of space weathering, olivine content may be
underestimated, with FeO and TiO2 content estimated using the maturity-corrected method.
Estimates of chemical content are 7.42–18.82 wt% FeO and 1.48–2.1 wt% TiO2, with a low-medium
Mg number (Mg # ~ 55). Olivine-rich materials are not present at the CE-4 landing site, based on
the low-medium Mg #. Multi-origin materials at the CE-4 landing site were analyzed with regard to
concentrations of FeO and TiO2 content, supporting our conclusion that the materials at CE-4 do not
have a single source but rather are likely a mixture of SPA impact melt components excavated by
surrounding impact crater and volcanic product ejecta.
Through October 25, 2020, the Yutu-2 rover of the Chang’E-4 (CE-4) mission had toured 519.29 m up to 600
days (for 21 lunar days), with the Visible and Near-Infrared Image Spectrometer (VNIS) on board the rover
acquiring 106 in situ reflectance measurements (Fig. 1). This in situ scientific dataset provides a unique perspec-
tive from which to understand the mineralogical and chemical properties of the Von Kármán crater inside the
South Pole–Aitken (SPA) basin on the far side of the m oon1,2. A range of remote-sensing and in situ data, some
based on spectral observations, analysis of geomorphology, and the subsurface structure within Von Kármán
crater, have helped develop understandings of the moon’s history and evolution.
After the CE-4’s safe landing, researchers have reported initial results by interpreting the first lunar-day
VNIS data showing that the materials along the rover route are dominated by olivine and low-calcium pyroxene
(LCP)—suggesting that the Yutu-2 rover may have detected the moon’s mantle m aterial3,4. These results are
consistent with orbital data, confirming that the floor of the SPA is rich in mafic materials5.
However, additional data from the Yutu-2 rover have not indicated the presence of expected mantle materi-
als at the CE-4 landing site, where materials are dominated by plagioclase (Plag) and pyroxene but include little
ays6. As exploration continues to produce more scientific data, we can
olivine (OL), for the first three lunar d
arrive at new and different understandings. Several inversion methods could cause the controversial components
1
College of Geo‑Exploration Science and Technology, Jilin University, Changchun, China. 2CAS Center for
Excellence in Comparative Planetology, Hefei, China. 3Key Laboratory of Lunar and Deep‑Space Exploration,
National Astronomical Observatories, Chinese Academy of Sciences, Beijing, China. *email: chensb@jlu.edu.cn
Scientific Reports | (2021) 11:15435 | https://doi.org/10.1038/s41598-021-93694-8 1
Vol.:(0123456789)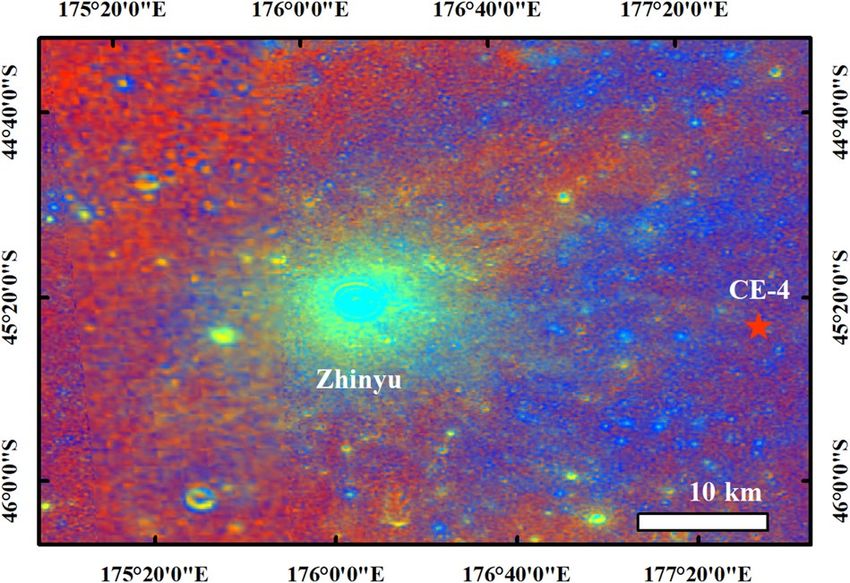
www.nature.com/scientificreports/
Figure 1. The routing path and the VNIS detections of the Yutu-2 rover during the 21 lunar days (except
for the eighteenth lunar day when the Yutu-2 did not move). The number upper the point is the first VNIS
detection of a new lunar day. The base map is from the LROC NAC image (image number M1311886645RC and
M1311886645LC). This map was created in ESRI ArcMap 10.2 (https://desktop.arcgis.com/zh-cn/arcmap/).
found at the CE-4 landing site. Findings of magnesium-rich materials obtaining using the modified Gaussian
method (MGM) may overstate olivine content, because plagioclase and olivine have very similar spectral fea-
tures around 1250 nm, making it difficult to confirm the abundance of plagioclase by MGM deconvolution7,8.
Further studies have considered additional minerals (such as plagioclase and agglutinates) for inversion through
the Hapke radiation transmission model, but different unmixing methods (lookup t ables9 and other empiri-
cal approaches6) may produce unexpected results. Accordingly, more lunar-days’ worth of data are needed to
research mineralogical properties along the rover’s route and support use of an objective unmixing method
based on radiative transfer models.
By contrast, the lunar surface material is affected mainly by space weathering, a natural process that affects
spectral band depths10, hindering precise modeling of lunar mixtures10,11. Notably, various mature materials
such as rock and regolith were found along the Yutu-2 rover’s route6,7,12. The regolith is more mature than
the surrounding rocks13. Olivine and pyroxene, the major mafic minerals of lunar material, have distinctive
spectral characteristics in the visible and near-infrared (VIS/NIS) and short-wave infrared (SWIR) r egions8,14:
for example, pyroxene exhibits absorption at ~ 1000 nm and ~ 2000 nm, whereas olivine has three overlaps in
absorption near 1000 nm but no absorption at 2000 nm. Olivine and pyroxene differ in their sensitivity to space
weathering15, making it difficult to ascertain the extent to which space weathering and mineral composition
influence the spectrum. Thus chemical characteristics (such as iron and titanium content) of the lunar surface
are needed to be concerned except for lunar minerals.
Iron and titanium are two elements of particular interest on the moon and are useful for understanding its
origin and geological evolution. The major rock types can be distinguished by concentrations of FeO and TiO2
content16 supplemented and compared with the results of mineral inversion. Although optical maturity strongly
influences spectral r eflectance10,17–19, there are ways of reducing the effect of space weathering when inversion of
FeO and TiO2 content. Generally speaking, two types of models are used, based on spectral data. One is based
on the statistical relation of reflectance spectra and compositions, such as principal component analysis20,21, the
support vector machine model21, and partial least squares regression22, mathematical methods that show poten-
tial for estimating element content by spectra. However, purely mathematical statistics are limited by mature
differences in the training data, producing artifacts when applied to other regions. The other algorithms were
maturity-corrected by parameterizing spectral properties of sensitivity to iron or titanium and soil maturity
(e.g., Lucey et al. 1 99518, 199816, 200019; Le Mouélic et al. 2 00023), an approach that can normalize the effects
of space weathering, optimized to remove mature effects. Thus FeO and TiO2 content and the optical maturity
parameter (OMAT) of Yutu-2 spectral data can be estimated using Lucey et al.’s m ethod19 to help explain the
moon’s geological background.
In this study, we analyze in situ spectra observed by VNIS spectral data during the first 21 synodic days, with a
view to reporting mineralogical and chemical information for the region of the Yutu-2 rover and offering insights
into the nature and origin of the SPA basin. Based on analysis of the spectral data, we attempt to determine the
mineralogical and chemical properties of the materials at the landing site.
Results
Mineralogy properties observed by Yutu‑2 rover. The VNIS spectra measured by the Yutu-2 rover
show absorption regions around 1000 nm and 2000 nm (Fig. 2b). These absorption characteristics can be used
to distinguish the primary minerals on the lunar surface, including pyroxene (PYX), olivine (OL), and plagio-
clase (Plag), because their absorption positions vary with Fe/Ca/Mg c ontent24–26. As Fig. 2 shows, similarities in
Scientific Reports | (2021) 11:15435 | https://doi.org/10.1038/s41598-021-93694-8 2
Vol:.(1234567890)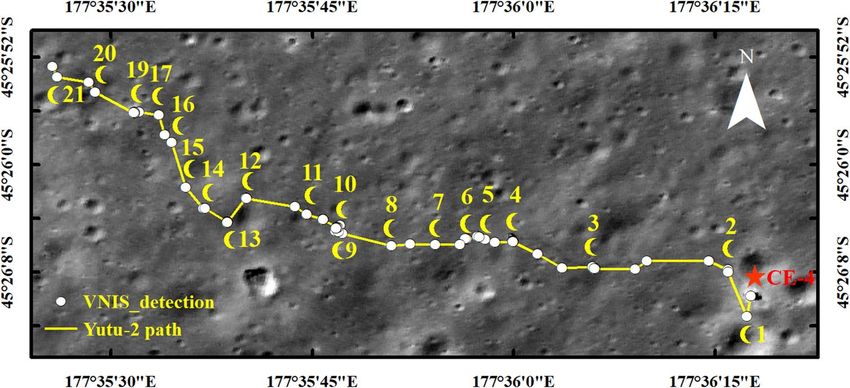
www.nature.com/scientificreports/
Figure 2. Examples of VNIS spectra measured by Yutu-2 rover. (a) The reflectance data with photometric
correction and smoothing. (b) The spectra after continuum removed.
absorption peak position notwithstanding, the band depth of the rock (LE00303) is larger than for other nearby
regolith, indicating similarities of components but differing degrees of space weathering.
To quantitatively infer the abundance of major minerals from the VNIS spectra measured by the Yutu-2 rover,
we use the Hapke radiative model, in combination with a sparse unmixing algorithm, to estimate their relative
content. In view of the space weathering effect, we add the agglutinates as the products of space weathering to
inerals27. Our estimates show an average modeled composition
estimate the relative contents of the primary m
of 50.5% agglutinates (AGG), 16.3% low-calcium pyroxene (LCP), 14.8% high-calcium pyroxene (HCP), 6.1%
olivine (OL), and 12.3% plagioclase (PLG) (Fig. 3a). The modeled mineral abundance of the CE-4 observations
suggests that their main sources are norite/gabbro and olivine norite/gabbro. Furthermore, we see higher LCP
than HCP at most observation sites, consistent with the findings of the recent s tudy7.
Figure 3b shows detailed abundance information for every VNIS detection. Most observations (50 of 86) show
higher LCP concentrations than HCP, indicating that composition variation within a small area of the Yutu-2
route is consistent with that suggested by Huang et al.7 for the CE-4 landing region, based on multiple sources.
Chemistry properties observed by Yutu‑2 rover. From VNIS spectral data, adopting the method used
by Luccy et al.19, we derived FeO and TiO2 content for Yutu-2 in situ measurements, with estimated content of
7.42–18.82 wt% FeO and 1.48–2.1 wt% TiO2 Fig. 4). FeO + TiO2 is consistent with estimates (11–19 wt%) based
on remote sensing data19,28,29. The results show that surface materials have higher FeO content but lower TiO2
content.
Elaborating on the chemical properties of the CE-4 landing site, Fig. 4 plots CE-4 FeO versus T iO2 for major
lunar rock type fields and CE-3 landing site materials. CE-3 data are from Ling et al.30, and lunar rock (mare
basalt and nonmare rock) data are reported by Lucey et al.16, Lindstrom et al.31, and Papike et al.32 LKFM (low-K
Fra Mauro), with basaltic impact melts thought to compose the lower lunar crust33. Figure 4 shows that CE-4
composition is unlike that of any major lunar rock type, but with the range of CE-4 spanning a variety of rock
types—suggesting a complex source for CE-4. (For further discussion, see the next section.) What’s more, CE-4
composition differs from CE-3, with materials at the CE-4 landing site having lower FeO content than CE-3,
indicating that materials at the CE-4 landing site are more mature, consistent with Is/FeO maturity indexes of
~ 82 for the CE-4 landing s ite13 and ~ 53 for CE-334.
Mg number (Mg # = mole percent MgO/(MgO + FeO)) is one of the chemical indexes used to discuss the ori-
gin of lunar samples. The Mg number (Mg # = mole percent MgO/(MgO + FeO)) at the CE-4 site was empirically
estimated by the 1000-nm and 2000-nm band centers, as Fig. 5 shows. We seek to identify mafic compositional
trends and assess whether they are related to band centers, with the magnesium ratio classified as high (Mg
# > 75), medium (Mg # 50–75), or low (Mg # < 50). The materials at the CE-4 site have a relatively low–medium
Mg # (Fig. 5), consistent with the Mg # of ~ 55 derived from the Chang’E-1 Imaging Interferometer (IIM) d ata29.
Scientific Reports | (2021) 11:15435 | https://doi.org/10.1038/s41598-021-93694-8 3
Vol.:(0123456789)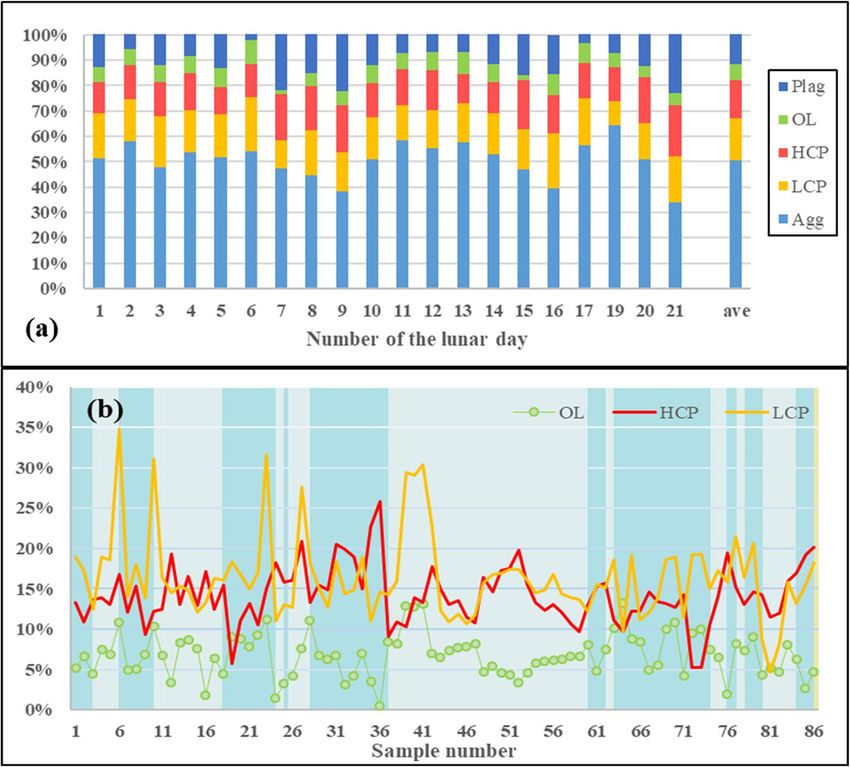
www.nature.com/scientificreports/
Figure 3. (a) The abundance of lunar materials during the first 21 lunar days. The estimated results show an
average modal composition of 50.5% agglutinates (AGG), 16.3% LCP, 14.8% HCP, 6.1% olivine (OL) and 12.3%
plagioclase (PLG). The ave means the average value during the first 21 lunar days. (b) The detailed abundance
information for every VNIS detection during the first 21 lunar days. We use the background of the color bars to
distinguish the observations during a lunar day.
Figure 4. Chemical properties of CE-4 measured materials. The LKFM (11.4–20 wt% FeO, 0.1–0.34 wt% T iO2)
is a rock type thought to compose the lower lunar crust. The lunar mantle (11.4–17.5 wt% FeO and 0.1–0.34
wt% TiO2) compositions are inferred by the experiments at high temperatures and pressure of mare basalt
source regions in the lunar mantle which may lead to the elevation of T
iO2. Mare basalts shows the range of
16.5–22.4 wt% FeO and 0.36–12.99 wt% TiO2.
Scientific Reports | (2021) 11:15435 | https://doi.org/10.1038/s41598-021-93694-8 4
Vol:.(1234567890)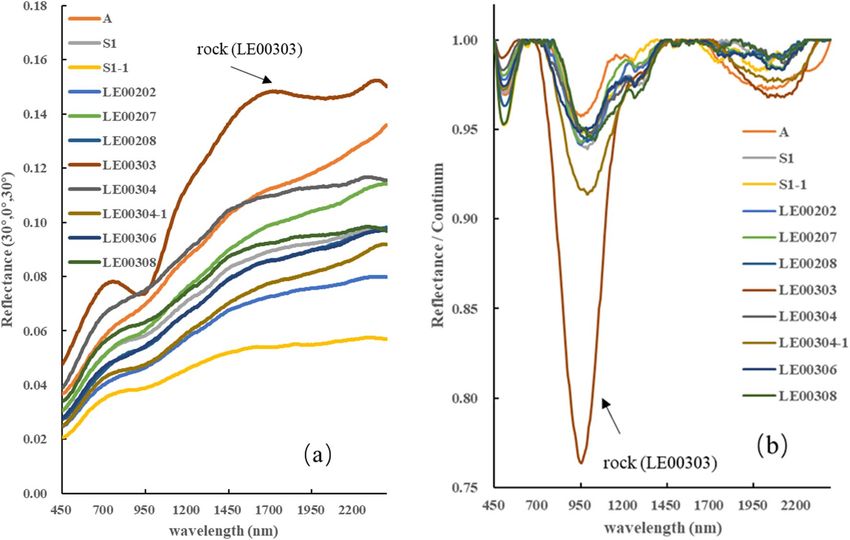
www.nature.com/scientificreports/
1040
Band1 : 1000nm band wavelength
1020
1000 L
CE4
980 High Mg samples
960 Medium Mg samples
M Low Mg samples
940 Mg# trendline
920 H
'High' Mg Med' Mg 'Low' Mg
900
1890 1940 1990 2040 2090 2140 2190
Band2 : 2000nm band wavelength
Figure 5. Comparison of the 1000 nm and 2000 nm band centers for spectra observed by Yutu-2 with the lunar
highland and mare samples. The Mg # trend line was estimated using Apollo mare and highland samples. The
Mg # of lunar samples were calculated using chemical information of MgO and FeO.
Discussions
Space weathering introduces changes to visible and near-infrared reflectance spectra35: because the moon is an
airless body, its surface is altered through irradiation by solar wind and galactic cosmic r ays36, a process that
reduces the strength of mineralogical absorption bands, including the mafic minerals pyroxene and olivine. Vari-
ous types of pits are on the path of the Yutu-2, and the fragments that fill them show varying degrees of space
weathering (Fig. S1), providing a unique perspective on space weathering’s influence on mineral abundance,
based on in situ spectra on the far side of the moon.
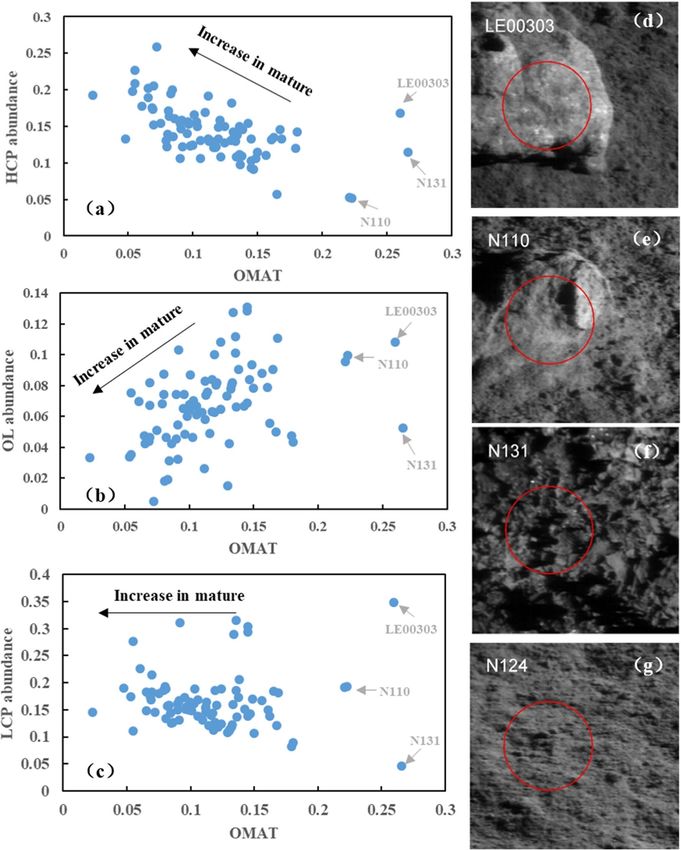
Optical maturity (OMAT) is a spectral parameter used to estimate the degree of space weathering for lunar
soils, based on reflectance properties. We calculated the optical maturity parameter19 and produced a scatterplot
(Fig. 6) of the relationship between OMAT and lunar mafic materials (HCP, LCP, and OL), showing that the three
minerals have different weathering resistances. OL has decreased tendency with increasing maturity, whereas OL
has weak resistance to weathering. LCP has better weathering resistance, whereas HCP shows relative increases
with maturity, because they are in the relative content system, indicating that HCP has better weathering resist-
ance. Because of the effects of space weathering, olivine may be underestimated, so further discussion of the
sources of materials at CE-4 should be combined with the chemical properties.
The CE-4 landing site is in the Von Kármán crater, which formed in the pre-Nectarian era and subsequently
underwent a series of complex geological evolutions37–40. The materials at the CE-4 landing site measured by
Yutu-2 are dominated by pyroxenes and plagioclase, with little olivine seen—suggesting that the rock type is
norite/gabbro. The norite-like surface materials at the CE-4 landing site may contain materials of the noritic
layer during SPA melt pool f ormation41,42, excavated by the surrounding impact craters (e.g., Finsen crater and
Alder crater). Furthermore, no olivine-rich materials were found at the CE-4 landing site with low–medium
Mg #, suggesting that the source might not be the lunar mantle, although the possibility of the mixture’s coming
from the lower crust cannot be ruled out.
By contrast, elevated CE-4 FeO content (Fig. 4) may result from exposure from lunar mantle16, but TiO2
content is significantly higher than the expected mantle composition. The correlation of FeO with TiO2 of CE-4
shown in Fig. 4 could result from the differentiation of the large melt sheet, with the differentiation materials
perhaps containing parts of LKFM (lower crustal composition).
The CE-4 materials have a distinctive chemical characteristic compared with other various mare basalt
(Fig. 4), and the chemical composition at CE-4 may offer insights into the mixing effects of impact melt ejecta
and volcanic products.
We note multiple lava-infilling events45 within the Von Kármán crater, ~ 70 km west of the CE-4 landing
site. Volcanic activity may have peaked in the Late Imbrium and could have continued into the Eratosthenian
epoch45, with multiple lava flooding products excavated by the fresh Zhinyu crater (~ 4 km diameter), ~ 30 km
west of the CE-4 landing site12. The orbital data indicate the presence of a slight impact ray to the CE-4 landing
site from the Zhinyu crater, based on color ratio imaging from Clementine UVVIS data (Fig. 7).
As already discussed, the CE-4 landing site has been affected by the mixing effects of ejecta and volcanic
products. Accordingly, multiple lavas were probably infilled in the bottom of Zhinyu crater and the CE-4 landing
site before the Zhinyu impact event, containing the ejecta and volcanic products from the Zhinyu crater brought
to the surface of the CE-4 landing site.
This paper investigates the mineralogical and chemical properties by in situ spectra as measured by Yutu-2,
finding that the materials detected by Yutu-2 were norite/gabbro. No olivine-rich mantle m aterials3 have been
detected thus far, but plagioclase and pyroxene have been. Agglutinates are abundant, based on the results of
mineral abundance, suggesting that the materials have undergone space weathering effects and reached a mature
state. The chemical compositions of materials at the CE-4 landing site were empirically estimated using in situ
spectra. Chemical properties show that the surface materials have higher FeO (7.42–18.82 wt%) and lower T iO2
Scientific Reports | (2021) 11:15435 | https://doi.org/10.1038/s41598-021-93694-8 5
Vol.:(0123456789)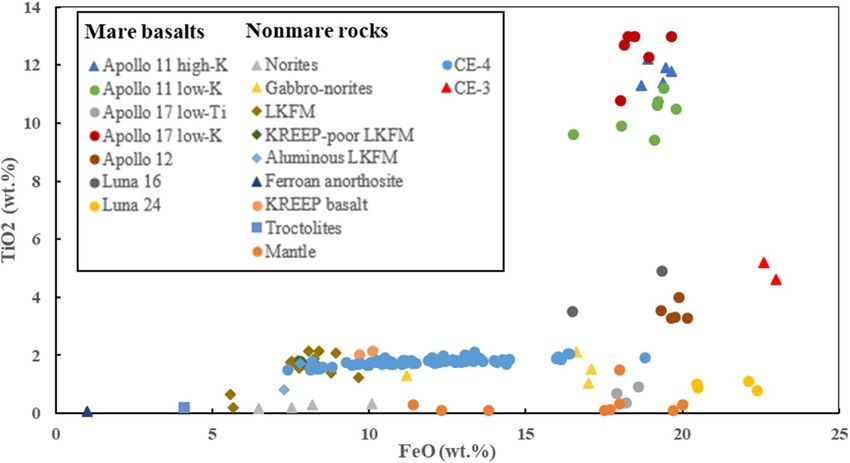
www.nature.com/scientificreports/
Figure 6. The relation between the OMAT and the main lunar minerals (HCP, LCP and OL). (a–c) are the
scatterplots showing the relationship between the OMAT and the main lunar materials. (d–g) are the different
type of lunar materials during the CE-4 routine path, (d, e) are the rock types, (f) is the fragment filled in the pit,
(g) is the normal type of the lunar regolith nearby the Yutu-2, the red circle is the field of view (FOV) for SWIR.
The VNIS images (d–g) were created by our own script in MATLAB 2013a (https://www.mathworks.com/produ
cts/matlab.html).
(1.48–2.1 wt%) content and low–medium Mg number (Mg # ~ 55). Based on analysis of their mineralogical
and chemical properties, the materials measured by Yutu-2 likely originated from SPA impact melt components
excavated by the surrounding impact crater and from the mixing effects of SPA ejecta and volcanic products.
Scientific Reports | (2021) 11:15435 | https://doi.org/10.1038/s41598-021-93694-8 6
Vol:.(1234567890)www.nature.com/scientificreports/
Figure 7. The color ratio image43,44 from Clementine UVVIS data at the CE-4 landing site, showing a slight
impact ray to the CE-4 landing site (red star) from the Zhinyu crater. The map was created in ESRI ArcMap 10.2
(https://desktop.arcgis.com/zh-cn/arcmap/).
Methods
VNIS spectra. The Visible and Near-infrared Imaging Spectrometer (VNIS) is composed of a 256- by 256-
pixel VIS/NIR imager and a short-wave infrared (SWIR) single-pixel non-imaging s pectrometer3,14. The VNIS
is fixed on the front of the rover, offering a 45° viewing angle at a height of 0.69 m. Its spectral range is 450–
2395 nm, with 400 spectral channels at a default 5-nm resolution. The VIS/NIR imager works from 450 to 945
nm, with 300 channels, and the 100-channel SWIR spectrometer works from 900 to 2395 nm, with 10 overlap
channels1,14. The SWIR spectrometer’s field of view is circular, with a center of (96, 128) in the VIS/NIR image
and a diameter of 107 pixels.
VNIS data processing. This section describes VNIS data processing. VNIS spectral data processing began
with level 2B data, which underwent dark current, flat-field, temperature corrections and radiometric and geo-
metric calibration3,46–48. L2B radiance data were converted to reflectance data by solar irradiance, for an airless
planetary surface, with bidirectional reflectance commonly given as radiance factor (RADF) I/F,
πIs ( i )
I/F( i ) = (1)
J( )S( )d
where J( ) is the solar irradiance49, S( ) the spectral response of the VNIS sensor, and Is ( i ) the radiance meas-
ured by Yutu-2 at wavelength i.
To reduce the influence of the geometric circumstances, the photometric correction described in Lin et al.6
was used to correct the data to fit common viewing geometry (incidence angle = 30°, emission angle = 0°, phase
angle = 30°).
Owing to differences in signal-to-noise ratios (SNR) between the VIS/NIR spectrum (37.4 dB) and SWIR
spectrum (44.0 dB)8, a gap is seen at the boundary of the two spectra. With no obvious slope difference at the
overlapping region (900–950 nm), and taking into account SWIR’s higher SNR, we multiplied the VIS/NIR
spectrum by a factor (reflectance ratio of SWIR 900-nm to the VNIS 900-nm) to connect to the SWIR spectrum
and obtain a continuous spectrum. Finally, Savitzky–Golay method was performed during the spectral data
smoothing, shown in Fig. 2.
Estimation of absorption band center. In lunar mineralogical studies, the absorption band center is an
important spectral parameter50, especially for mafic minerals (olivine and pyroxene), which have two obvious
absorption bands, band1 (~ 1000 nm) and band2 (~ 2000 nm). The properties of absorption band centers are
related to mineral structure and chemical composition51.
ethod52 to obtain the continuum-
To calculate the band center, we first used the straight-line continuum m
removed spectra. We then used a sixth-order polynomial to fit the bottom of the continuum-removed absorption
feature around band1 (~ 1000 nm) and band2 (~ 2000 nm)48. The band center is defined as the wavelength at
the minimum point on the polynomial fitted curve. We set three different spectral ranges for band1 and band2
when polynomial fitting, and take the average center values as the final results.
Estimation of the mineral abundances from the spectra. In this study, we used the radiative transfer
model53,54 (see Supplementary Text S1) and the sparse unmixing a lgorithm55,56 to estimate mineral abundance
from the VNIS spectra. To avoid any thermal emission effects, we limited our analysis to the wavelength range
950–1500 nm. First we calculated the imaginary part (k) of the endmembers (shown in Table S1) using the
Hapke model. Next we computed the single scattering (SSA) for each endmember with different particle sizes
Scientific Reports | (2021) 11:15435 | https://doi.org/10.1038/s41598-021-93694-8 7
Vol.:(0123456789)www.nature.com/scientificreports/
(ranging from 5 to 200 nm, with an interval of 5 nm) using the Hapke slab model, constructed as the endmember
library. Finally, we used the sparse unmixing algorithm to unmix the SSA of the Yutu-2 spectra derived by the
Hapke model.
Derivation of iron and titanium abundance. To evaluate the chemical properties of the materials
detected by Yutu-2, we calculated FeO and TiO2 content using the algorithms described by Luccy et al.19. These
approaches were based on returned Apollo and Luna samples. FeO and TiO2 content was calculated from the
best fit curve,
FeO (wt% ) = 31.875θFe − 17.895 (2)
(3)
θFe = −arctan[ R950 /R750 − y0Fe /(R750 − x0Fe )
9.779
TiO2 (wt%) = 1.836 × θTi (4)
(5)
θTi = arctan R415 /R750 − y0Ti /(R750 − x0Ti )
where the origin (x 0Fe , y0Fe ) and (x0Ti , y0Ti ) were set to (–0.1, 1.39) and (–1.08, 0.208), optimized to maximize
the correlation coefficient between content and θFe using the Apollo lunar s amples10,57. R415 was determined by
R415 = 0.95R415 − 0.0013 ( R2 = 0.99).
Data availability
CE-4 VNIS data are available at Data Publishing and Information Service System of China’s Lunar Exploration
Program (http://moon.bao.ac.cn/). All the CE-4 VNIS data IDs are listed in Supplementary Table S3. Additional
data related to this paper are available from the corresponding author upon reasonable request.
Received: 27 February 2021; Accepted: 29 June 2021
References
1. Li, C. L. et al. Detection and calibration characteristics of the visible and near-infrared imaging spectrometer in the Chang’E-4.
Rev. Sci. Instrum. 90(10), 103–106 (2019).
2. Chen, J. et al. Mineralogy of Chang’E-4 landing site: Preliminary results of visible and near-infrared imaging spectrometer. Sci.
China Inform. Sci. 63(4), 1869–1919 (2020).
3. Li, C. L. et al. Chang’E-4 initial spectroscopic identification of lunar far-side mantle-derived materials. Nature 569(7756), 378–382
(2019).
4. Gou, S. et al. Forsteritic olivine and magnesium-rich orthopyroxene materials measured by Chang’E-4 rover. Icarus 345, 113776
(2020).
5. Moriarty, D. P. & Pieters, C. M. The character of South Pole-Aitken Basin: Patterns of surface and subsurface composition. J.
Geophys. Res. Planet 123(3), 729–747 (2018).
6. Lin, H. L. et al. Olivine-norite rock detected by the lunar rover Yutu-2 likely crystallized from the SPA-impact melt pool. Natl. Sci.
Rev. 7(5), 913–920 (2020).
7. Huang, J. et al. Diverse rock types detected in the lunar South Pole-Aitken Basin by the Chang’E-4 lunar mission. Geology 48(7),
723–727 (2020).
8. Gou, S. et al. Lunar deep materials observed by Chang’E-4 rover. Earth Planet. Sci. Lett. 528, 115829 (2019).
9. Hu, X. Y. et al. Mineral abundances inferred from in situ reflectance measurements of Chang’E-4 landing site in South Pole-Aitken
Basin. Geophys. Res. Lett. 46(16), 9439–9447 (2019).
10. Pieters, C. M. et al. Space weathering on airless bodies: Resolving a mystery with lunar samples. Meteor. Planet. Sci. 35(5), 1101–
1107 (2000).
11. Moriarty, D. P. & Pieters, C. M. The character of South Pole-Aitken Basin: Patterns of surface and subsurface composition. J.
Geophys. Res. Planets 123(3), 729–747 (2018).
12. Ma, P. et al. A plagioclase-rich rock measured by Yutu-2 Rover in Von Karman crater on the far side of the Moon. Icarus 350,
569–580 (2020).
13. Gou, S. et al. In situ spectral measurements of space weathering by Chang’E-4 rover. Earth Planet. Sci. Lett. 535, 116117 (2020).
14. He, Z. P. et al. Spectrometers based on acousto-optic tunable filters for in situ lunar surface measurement. J. Appl. Remote Sens.
13(2), 027502 (2019).
15. Weber, I. et al. Space weathering by simulated micrometeorite bombardment on natural olivine and pyroxene: A coordinated IR
and TEM study. Earth Planet. Sci. Lett. 530, 230–242 (2020).
16. Lucey, P. G., Taylor, G. J., Hawke, B. R. & Spudis, P. D. FeO and TiO2 concentrations in the South Pole-Aitken basin: Implications
for mantle composition and basin formation. J. Geophys. Res. Atmos. 103(E2), 3701–3708 (1998).
17. Fischer, E. M. & Pieters, C. M. Remote determination of exposure degree and iron concentration of lunar soils using VIS-NIR
spectroscopic methods. Icarus 111(2), 475–488 (1994).
18. Lucey, P. G., Taylor, G. J. & Malaret, E. Abundance and distribution of iron on the Moon. Science 268(5214), 1150–1153 (1995).
19. Lucey, P. G., Blewett, D. T. & Jolliff, B. L. Lunar iron and titanium abundance algorithms based on final processing of Clementine
ultraviolet-visible images. J. Geophys. Res. 105(E8), 20297–20305 (2000).
20. Pieters, C. M., Stankevich, D. G., Shkuratov, Y. G. & Taylor, L. A. Statistical analysis of the links among lunar mare soil mineralogy,
chemistry, and reflectance spectra. Icarus 155(2), 285–298 (2002).
21. Zhang, X. Y., Li, C. L. & Lü, C. Quantification of the chemical composition of lunar soil in terms of its reflectance spectra by PCA
and SVM. Chin. J. Geochem. 28, 204–211 (2009).
22. Li, L. Partial least squares modeling to quantify lunar soil composition with hyperspectral reflectance measurements. J. Geophys.
Res. 111(E4), pp E04002 (2006).
23. Mouélic, S. L. et al. Discrimination between maturity and composition of lunar soils from integrated Clementine UV-visible/
near-infrared data: Application to the Aristarchus Plateau. J. Geophys. Res. 105(E4), 9445–9455 (2000).
Scientific Reports | (2021) 11:15435 | https://doi.org/10.1038/s41598-021-93694-8 8
Vol:.(1234567890)www.nature.com/scientificreports/
24. Adams, J. B. & Goullaud, L. H. Plagioclase feldspars: Visible and near infrared diffuse reflectance spectra as applied to remote
sensing. Geochim. Cosmochim. Acta 10 (1978).
25. Bowell, E. et al. Application of photometric models to asteroids. Asteroids II(C), 524–556 (1988).
26. Sunshine, J. M. & Pieters, C. M. Determining the composition of olivine from reflectance spectroscopy. J. Geophys. Res. 103(E6),
13675–13688 (1998).
27. Trang, D. & Lucey, P. G. Improved space weathering maps of the lunar surface through radiative transfer modeling of Kaguya
multiband imager data. Icarus 321, 307–323 (2019).
28. Otake, H., Ohtake, M. & Hirata, N. Lunar iron and titanium abundance algorithms based on SELENE (Kaguya) multiband imager
data. In 43rd Lunar and Planetary Science Conference, Vol. 43, 1905 (2012).
29. Ling, Z. et al. Composition, mineralogy and chronology of mare basalts and non-mare materials in Von Kármán crater: Landing
site of the Chang’E-4 mission. Planet. Space Sci. 179, 104741 (2019).
30. Ling, Z. et al. Correlated compositional and mineralogical investigations at the Chang’E-3 landing site. Nat. Commun. 6, 1–9
(2015).
31. Lindstrom, M. M., Marvin, U. B., Holmberg, B. B. & Mittlefehldt, D. W. Apollo 15 KREEP-poor impact melts. In Lunar and Plan-
etary Science Conference 20th (1989).
32. Papike, J. J., Ryder, G. & Shearer, C. K. Lunar samples. Rev. Mineral. Geochem. 36(1), 51–5234 (1998).
33. Spudis, P. D. Apollo 16 site geology and impact melts: Implications for the geologic history of the lunar highlands. J. Geophys. Res.
Solid Earth 89(1), 95–107 (1984).
34. Xiao, L. et al. A young multilayered terrane of the northern Mare Imbrium revealed by Chang’E-3 mission. Science 347(6227),
1226–1229 (2015).
35. Pieters, C. M. & Noble, S. K. Space weathering on airless bodies. J. Geophys. Res. Planets 121(10), 1865–1884 (2016).
36. Brett, W. D. et al. Characterization of space weathering from lunar reconnaissance orbiter camera ultraviolet observations of the
Moon. J. Geophys. Res. Planets 119(5), 976–997 (2014).
37. Fu, X. H., Qiao, L., Zhang, J., Ling, Z. & Li, B. The subsurface structure and stratigraphy of the Chang’E-4 landing site: Orbital
evidence from small craters on the Von Kármán crater floor. Res. Astron. Astrophys. 20(1), 59–70 (2020).
38. Huang, J. et al. Geological characteristics of Von Kármán Crater, Northwestern South Pole-Aitken Basin: Chang’E-4 landing site
region. J. Geophys. Res. Planets 123(7), 1684–1700 (2018).
39. Paskert, J. H., Hiesinger, H. & van der Bogert, C. H. Lunar far side volcanism in and around the south pole–Aitken basin. Icarus
299, 538–562 (2018).
40. Wilhelms, D. E., Howard, K. A. & Wilshire, H. G. Geologic map of the south side of the Moon. In IMAP (1979).
41. Hurwitz, D. M. & Kring, D. A. Differentiation of the South Pole-Aitken basin impact melt sheet: Implications for lunar exploration.
J. Geophys. Res. Planets 119(6), 1110–1133 (2014).
42. Vaughan, W. M. & Head, J. W. Impact melt differentiation in the South Pole-Aitken basin: Some observations and speculations.
Planet. Space Sci. 91, 101–106 (2014).
43. McEwen, A. S. & Robinson, M. S. Mapping of the Moon by Clementine. Adv. Space Res. 19(10), 1523–1533 (1997).
44. Pieters, C. M. & Tompkins, S. Tsiolkovsky crater: A window into crustal processes on the lunar farside. J. Geophys. Res. 14(E9),
21935–21949 (1999).
45. Lai, J. L. et al. First look by the Yutu-2 rover at the deep subsurface structure at the lunar farside. Nat. Commun. 11, 1–9 (2020).
46. He, Z. P. et al. Visible and near-infrared imaging spectrometer and its preliminary results from the Chang’E 3 project. Rev. Sci.
Instrum. 85(8), 083–104 (2014).
47. Liu, B. et al. Reflectance conversion methods for the VIS/NIR imaging spectrometer aboard the Chang’E-3 lunar rover: based on
ground validation experiment data. Res. Astron. Astrophys. 13(7), 862–874 (2013).
48. Wu, Y. & Hapke, B. Spectroscopic observations of the Moon at the lunar surface. Earth Planet. Sci. Lett. 484, 145–153 (2018).
49. Gueymard, C. Direct solar transmittance and irradiance predictions with broadband models. Part I: detailed theoretical perfor-
mance assessment. Sol. Energy 76(4), 513 (2004).
50. Zhang, X. et al. Study of the continuum removal method for the Moon Mineralogy Mapper (M3) and its application to Mare
Humorum and Mare Nubium. Res. Astron. Astrophys. 16, 7–15 (2016).
51. Klima, R. L. et al. New insights into lunar petrology: Distribution and composition of prominent low-Ca pyroxene exposures as
observed by the Moon Mineralogy Mapper (M3). J. Geophys. Res. Planets 116(E6), 2156–2202 (2011).
52. Clark, R. N. & Roush, T. L. Reflectance spectroscopy: Quantitative analysis techniques for remote sensing applications. J. Geophys.
Res. Solid Earth 89(B7), 6329–6340 (1984).
53. Hapke, B. Bidirectional reflectance spectroscopy: 1. J. Geophys. Res. 86, 3039–3054 (1981).
54. Hapke, B. Theory of Reflectance and Emittance Spectroscopy 528 (Cambridge University Press, 2012).
55. Iordache, M.-D., Bioucas-Dias, J. M. & Plaza, A. Sparse unmixing of hyperspectral data. IEEE Trans. Geosci. Remote Sens. 49(6),
2014–2039 (2011).
56. Lin, H. et al. Retrieval of the mineral abundance and particle size distribution at the landing site of Yutu rover with hyperspectral
remote sensing data (Article). J. Remote Sens. 23(5), 831–840 (2019).
57. Taylor, L. A., Pieters, C. M., Keller, L. P., Morris, R. V. & McKay, D. S. Lunar mare soils: Space weathering and the major effects of
surface-correlated nanophase Fe. J. Geophys. Res. 106(E11), 27985–27999 (2001).
Acknowledgements
The authors thank the whole Chang’E-4 team for the successful mission and providing the scientific data. This
study is supported by the Strategic Priority Research Program of Chinese Academy of Sciences (XDB 41000000)
and National Natural Science Foundation of China (41772346).
Author contributions
Q.H.Z. and S.B.C. designed the research. Q.H.Z. wrote the paper. Y.Z.Z. helped with the geologic analysis and
edited the paper. Q.H.Z. performed the calculations. Y.L.M., R.D. and C.Y.Y. helped with the NAC and UVVIS
data processing. A.Z.L., P.L. helped data calibration and mapping. All authors reviewed the manuscript.
Competing interests
The authors declare no competing interests.
Additional information
Supplementary Information The online version contains supplementary material available at https://doi.org/
10.1038/s41598-021-93694-8.
Correspondence and requests for materials should be addressed to S.C.
Scientific Reports | (2021) 11:15435 | https://doi.org/10.1038/s41598-021-93694-8 9
Vol.:(0123456789)www.nature.com/scientificreports/
Reprints and permissions information is available at www.nature.com/reprints.
Publisher’s note Springer Nature remains neutral with regard to jurisdictional claims in published maps and
institutional affiliations.
Open Access This article is licensed under a Creative Commons Attribution 4.0 International
License, which permits use, sharing, adaptation, distribution and reproduction in any medium or
format, as long as you give appropriate credit to the original author(s) and the source, provide a link to the
Creative Commons licence, and indicate if changes were made. The images or other third party material in this
article are included in the article’s Creative Commons licence, unless indicated otherwise in a credit line to the
material. If material is not included in the article’s Creative Commons licence and your intended use is not
permitted by statutory regulation or exceeds the permitted use, you will need to obtain permission directly from
the copyright holder. To view a copy of this licence, visit http://creativecommons.org/licenses/by/4.0/.
© The Author(s) 2021, corrected publication 2021
Scientific Reports | (2021) 11:15435 | https://doi.org/10.1038/s41598-021-93694-8 10
Vol:.(1234567890)You can also read