Miniscope in vivo imaging of neuronal ensembles in the central amygdala in mice - Helda
←
→
Page content transcription
If your browser does not render page correctly, please read the page content below

Master’s Thesis
          Faculty of Biological and Environmental Sciences
                Master’s programme in neuroscience
                        University of Helsinki
                                Finland

Miniscope in vivo imaging of neuronal ensembles in
           the central amygdala in mice

                          A pilot study

                         Maarten Verlé

                 supervisor: Teemu Aitta-aho
                Department of Pharmacology
               Neuropsychopharmacology group
                        January 2021

                                                             1
Faculty: Faculty of Biological and Environmental Sciences

Degree programme: Master’s Programme in Neuroscience

Study track: Neuroscience

Author: Maarten Verle

Title: Miniscope in vivo imaging of neuronal ensembles in the central amygdala in mice

Level: Master’s Degree

Month and year: January 2021

Number of pages: 42

Keywords: Miniscope, in vivo imaging, GRIN lens, central amygdala, GCaMP

Where deposited: Helsingin yliopiston kirjasto, Helsinki University Library

Additional information: This project was conducted in the neuropsychopharmacology laboratory at
the University of Helsinki

Abstract:

Advancements in both calcium indicators and optical instrumentation have led to new in vivo
techniques, such as Miniscopes, capable of recording the spatiotemporal activity of multiple neurons
during unrestrained behaviour in rodents. With these microendoscopic techniques, neuronal
populations can be stably recorded over multiple sessions. As a result, Miniscopes allow for the
investigation of a brain region’s changing activity patterns as a result of disease progression or
behaviour. Recently, open source Miniscope initiatives have led to affordable and accessible versions
of this technique. In addition, the collaborative open-source community facilitates rapidly evolving
modifications, implementations and designs. Notwithstanding the potential and ever-increasing
popularity of Miniscopes, the technique is still in its infancy and not widespread. This study consisted
of a background review and a pilot study attempting to image neuronal ensembles in the central nucleus
of the amygdala (CeA) using the open-source UCLA V3 Miniscope in mice. Despite not being able to
successfully record neuronal activity in the CeA, the study has made progress in generating a protocol
for Miniscope implementation at the Pharmacology department of Helsinki. Moreover, the study
proposes different adjustments that might be implemented in the future. With the continuation of a
synergistic collaboration with the Department of Psychology at the university of Jyväskylä, it is likely
that both departments will be able to effectively implement the Miniscope technique in the foreseeable
future.

                                                                                                      2
TABLE of CONTENTS

Abstract .................................................................................................................................................. 4
Abbreviations: ........................................................................................................................................ 5

1.      Introduction .................................................................................................................................... 6
2.      Background .................................................................................................................................... 6
     2.1 Calcium imaging .......................................................................................................................... 6
        2.1.2 Calcium indicators ................................................................................................................ 8
        2.1.3 Calcium imaging instrumentation ....................................................................................... 11
     2.2 In vivo imaging vs in vivo electrophysiological recording ....................................................... 14
     2.3 Other in vivo indicators ............................................................................................................. 17
        2.3.1 Voltage indicators ............................................................................................................... 17
        2.3.2 Synaptic vesicle release indicators and specific neurotransmitter indicators ..................... 19
     2.4 Miniscope ................................................................................................................................... 20
3.      Objective of the pilot study .......................................................................................................... 22
4.      Materials & Methods ................................................................................................................... 23
     4.1 Miniscope: UCLA V3 ................................................................................................................ 23
     4.2 Mice ........................................................................................................................................... 24
     4.3 Viral injections ........................................................................................................................... 24
     4.4 Miniscope alignment test ........................................................................................................... 25
     4.5 GRIN Lens Implantations .......................................................................................................... 26
     4.6 Baseplating ................................................................................................................................. 27
     4.7 Recording sessions ..................................................................................................................... 29
     4.8 Histology .................................................................................................................................... 29
5.      Analyses ....................................................................................................................................... 30
6.      Results .......................................................................................................................................... 30
7.      Discussion .................................................................................................................................... 34
     7.1 Future Considerations ................................................................................................................ 34
8.      Conclusion ................................................................................................................................... 36

Acknowledgements .............................................................................................................................. 37
References ............................................................................................................................................ 38

                                                                                                                                                           3
Abstract

Advancements in both calcium indicators and optical instrumentation have led to new in vivo
techniques, such as Miniscopes, capable of recording the spatiotemporal activity of multiple neurons
during unrestrained behaviour in rodents. With these microendoscopic techniques, neuronal
populations can be stably recorded over multiple sessions. As a result, Miniscopes allow for the
investigation of a brain region’s changing activity patterns as a result of disease progression or
behaviour. Recently, open source Miniscope initiatives have led to affordable and accessible versions
of this technique. In addition, the collaborative open-source community facilitates rapidly evolving
modifications, implementations and designs. Notwithstanding the potential and ever-increasing
popularity of Miniscopes, the technique is still in its infancy and not widespread. This study consisted
of a background review and a pilot study attempting to image neuronal ensembles in the central nucleus
of the amygdala (CeA) using the open-source UCLA V3 Miniscope in mice. Despite not being able to
successfully record neuronal activity in the CeA, the study has made progress in generating a protocol
for Miniscope implementation at the Pharmacology department of Helsinki. Moreover, the study
proposes different adjustments that might be implemented in the future. With the continuation of a
synergistic collaboration with the Department of Psychology at the university of Jyväskylä, it is likely
that both departments will be able to effectively implement the Miniscope technique in the foreseeable
future.

                                                                                                      4
Abbreviations:
AAV           Adeno-associated virus
AMPAR         α-amino-3-hydroxy-5-methyl-4-isoxazolepropionic acid receptor
AP            Anterior-posterior
CaM           Calmodulin
CaMKII        Ca2+/Calmodulin-dependent protein kinase II
CCD           Charge-couple device
CeA           Central nucleus of the amygdala
CNMF          Constrained non-negative matrix factorization
CMOS          Complementary Metal Oxide Semiconductor
cpGFP         Circular permuted green fluorescent protein
DAQ-software Data acquisition software
DV            Dorsal-Ventral
ER            Endoplasmic Reticulum
FELASA        Federation for Laboratory Animal Science Associations
FP            Fluorescent protein
FRET          Föster resonance energy transfer
GCaMP         GFP/Calmodulin/M13 genetically encoded Ca2+ indicator
GECIs         Genetically encoded calcium indicators
GEPIs         Genetically encoded pH indicators
GETIs         Genetically encoded transmitter indicators
GEVIs         Genetically encoded voltage indicators
GFP           Green fluorescent protein
GRIN          Gradient refractive index
iGluSnFR      Intensity-based glutamate-sensing fluorescent reporter
IVC           Individually ventilated cage
LTP           Long term potentiation
NMDAR         N-methyl-D-aspartate-receptor
Miniscope     Miniaturized head mounted fluorescent microscope
ML            Medial-Lateral
PBS           Phosphate buffered saline
PCA           Principal component analysis
pKa           Dissociation constant
PFA           paraformaldehyde
VGCC          Voltage-gated calcium channel
VSD           Voltage sensing domain

                                                                              5
1. Introduction

Over the past two decades, following the development of genetically encoded fluorescent indicators,
in vivo imaging in the mammalian brain has become increasingly widespread. In these techniques an
optical microscope is combined with molecular probes which are constructed as a means to observe
intracellular calcium dynamics, changes in transmembrane voltage and neurotransmitter release (Lin
& Schnitzer, 2016). As genetically encoded indicators can be stably expressed, the effects of learning
behaviour (plasticity) and disease progression on neuronal dynamics can be investigated directly over
multiple recording sessions. This study consisted of a background review and a pilot study attempting
to image neuronal ensembles in the central nucleus of the amygdala (CeA) using the open-source
UCLA V3 Miniscope in mice.

2. Background

2.1 Calcium imaging

Calcium (Ca2+) is a vastly versatile intracellular messenger that regulates a variety of functions in
virtually every cell of a biological organism. The intracellular Ca2+ concentration is dictated by both
an exchange with the extracellular environment and an exchange with internal stores such as the
endoplasmic reticulum (ER). In neurons, during electrical activity concentration of Ca2+ transiently
rises to levels that are 100 times higher than the resting concentration (Grienberger & Konnerth, 2012).
During this rapid calcium elevation, the ER can act as a buffer preventing Ca2+ ions from reaching the
nucleus (Berridge, 1998). In addition, up to 200 calcium binding proteins are encoded in the human
genome which can act as buffers or effectors shaping the dynamics of freely moving Ca2+ ions
(Berridge et al., 2003). The need to bypass these buffering systems may explain why gene transcription
in neurons and the consolidation of new synaptic connections require repetitive stimulation or a
juxtaposition of events.

                                                                                                      6
In neurons, the dramatic increase in somatic calcium occurs as a reaction to neuronal depolarization.
Therefore, rapid increases in intracellular Ca2+ can be used as an indirect measure for both action
potential and single synaptic response detection, during in vivo and in vitro imaging (Chen et al., 2013;
Jercog et al., 2016; Lin & Schnitzer, 2016). Ca2+ influx as a result of depolarisation is mediated by
multiple routes. For instance, certain excitatory ionotropic neurotransmitter receptors such as the
“coincidence detector” N-methyl-D-aspartate receptor (NMDA-receptor), mediate a calcium influx in
synaptic spines which is thought to be crucial for long term potentiation (LTP) (Lin & Schnitzer, 2016).
LTP refers to the strengthening of synapses based on recent activity. NMDA receptors require both
the binding of glutamate and a simultaneous membrane depolarisation (removing the Mg 2+ block) in
order to effectively open the channel for a calcium influx (Purves et al., 2011). The depolarisation
needed to remove the NMDA receptor’s Mg2+ block is mainly produced by another ionotropic
glutamate receptor, the AMPA receptor. When glutamate is released into the synaptic cleft the highly
Na+- conductive AMPA-receptors are activated first.          The resulting inward flow of Na+ ions
depolarises the cell membrane. This shift in membrane voltage combined with the available glutamate
activates NMDA receptors, leading to an influx of Ca2+. Subsequently the rise in intracellular Ca2+
concentration can increase AMPA receptor trafficking to the membrane through CaMKII activation.
Ultimately this leads to an enhancement of synaptic strength or LTP. AMPA and NMDA receptors are
mainly found at the level of excitatory synapses.

Conversely, throughout the neuron, action potential propagation induces a neuronal surge in
intracellular calcium, which is predominantly mediated by voltage-gated calcium channels (VGCCs)
(Berridge, 1998). VGCCs encompass a large group of ion channels characterized by their voltage
dependent activation (and inactivation) and their high selectivity for calcium ions. VGCC’s are often
classified into high and low voltage activated channels, which can be further subdivided into groups
based on their biophysical and molecular features. Structurally high voltage activated channels are
heteromultimeric channels made out of numerous subunits whereas the low voltage activated channels
are less complex. However, all VGCC’s include an α1 subunit which is responsible for voltage sensing,
the gating mechanism and the conductivity of the pore (Hille, 2001; Simms & Zamponi, 2014). The
types of VGCC channels present and their respective proportions will vary depending on the type of
neuron and the subcompartment of the cell. Moreover, the influence of other calcium mechanisms on
calcium dynamics are equally divergent. As a result, the spatial and temporal components of calcium
signaling are highly diverse in different cellular subcompartments. For instance, at the synaptic
junction, a calcium influx triggers neurotransmitter synaptic vesicle release within microseconds. On

                                                                                                       7
the other hand, in the subcompartment of the nucleus, calcium is crucial for gene transcription and
operates on a time scale of minutes to hours (Berridge, 1998).

The temporal component, the amplitude and the action site are the most crucial factors that determine
the function of a calcium signal. Fluorescent Ca2+ imaging has become a useful tool for monitoring
neuronal activity in cell populations as well as in specific subcompartments of an individual cell (Chen
et al., 2013; Ye, Haroon et al., 2017). Historically, two parallel developments have contributed to state-
of-the-art calcium imaging: the improvement of calcium indicators and the realization of appropriate
instruments (Grienberger & Konnerth, 2012).

2.1.2 Calcium indicators

The first calcium indicators were small fluorescent photoproteins derived from luminescent organisms.
For instance, the photoprotein aequorin which is associated with the green fluorescent protein (GFP)
emitting a green bioluminescent signal when in contact with Ca2+, was isolated from the Aequorea
Victoria jellyfish (Baubet et al., 2000). These indicators provided early insights into calcium processes
and were characterized with a high signal to noise ratio. However, they were arduous to implement.
The proteins were relatively unstable, each molecule would perform only one emission cycle and the
dye had to be loaded into a single cell with a micropipette (Brini, 2008). A new class of indicators,
synthetic chemical indicators, was developed in the 1980’s when calcium chelators were combined
with a fluorescent chromophore. Initially, one of the most popular chemical indicators amongst
neuroscientists was fura-2, as it allowed for a more quantitative measurement of calcium concentration.
Over the years many different indicators in this class were produced. One of the most notable ones
was Oregon Green BAPTA which became popular for its easy implementation and good signal to
noise ratio (Grienberger & Konnerth, 2012). It is important to note that the chemical calcium indicators
are traditionally loaded into single cells with a pipette or single cell electroporation (Sun et al., 2013).
Alternatively, the synthetic chemical dyes can be loaded in bulk, but with numerous disadvantages.
Firstly, the loading of the extracellular dye results in a low contrast between cell populations, making
it difficult to differentiate between different classes of neurons. Additionally, the injection is often
invasive and chronic recordings are arduous as an adequate dye concentration can only be maintained
for a couple of hours (Garaschuk et al., 2006; Grienberger & Konnerth, 2012; Sun et al., 2013).

                                                                                                          8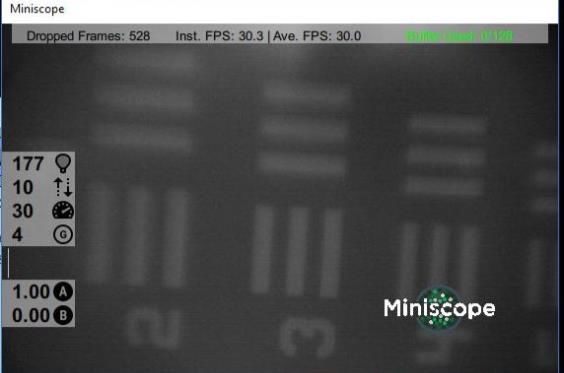
A breakthrough in the recording of neuronal populations (and ensemble activity) came with the advent
of protein based genetically encoded calcium indicators (GECI’s) (Grienberger & Konnerth, 2012).
These engineered proteins with fluorophore domains were constructed in an attempt to address the
drawbacks of chemical dyes. The principal advantage of GECI’s is that they can be genetically inserted
in specific cells through viral injections. A virus incorporating the GECI sequence can integrate itself
into the host genome through viral transduction leading to a chronic, stable expression (Ye et al.,
2017). An ample amount of virus expression is usually obtained 2 to 4 weeks after the viral injection
surgery. The most prominent viral vectors used for GECI expression are the adeno-associated viruses
(AAV’s) (He et al., 2018). Compared to other popular vectors, AAV vectors show a higher diffusion
rate due to the smaller size of the viral particles (Bouard et al., 2009). In addition, AAV vectors are
not restricted to dividing cells but also target quiescent cells, leading to a stable broad expression. They
also elicit a mild immune response and are thought to be non-pathogenic during gene delivery. One
major constraint of using an AAV is its limited packaging capacity. It can only accommodate transgene
constructs of up to 5 kb (compared to 10kb in lentivirus) (Hauck et al., 2003). However, this is not a
problem for the typical calcium imaging experiment as most GECI constructs range between 1-2 kb.

Once expressed, the generic interactions the GECI has with Ca 2+ ions are fairly straightforward. In
principle, when calcium binds to its binding domain it elicits conformational changes in the fluorescent
domains, resulting in an increase of the emitted fluorescent signal when exposed to an appropriate
excitation signal.

The first GECI’s relied on Föster Resonance Energy Transfer (FRET), this refers to a nonradiative
type of energy transfer between an excitable donating fluorophore protein and an acceptor fluorophore
protein. A linker sequence, comprised of Calmodulin (CaM) and a CaM synthetic binding peptide
M13, connects the two fluorophores. The binding of Ca2+ induces a conformational change and reduces
the distance between the two fluorophore proteins. The resulting proximity of the fluorophore proteins
facilitates FRET, leading to an increase in yellow fluorescence (Grienberger & Konnerth, 2012). A
second type of GECI relies on Ca2+ dependent rearrangements within a single fluorophore. The most
prominent family in this second type of GECI’s are the Green fluorescent protein/Calmodulin protein
sensors (GCaMP’s). In 2001, Nakai and colleagues developed the first GCaMP, a circularly permuted
enhanced version of the green fluorescent protein (cpGFP) flanked and in close proximity of CaM and
M13 (Nakai et al., 2001). In protein engineering, circular permutation involves reorganising a protein’s
amino acids resulting in a different connectivity where the original C and N termini are connected
together by a linker (Lin & Schnitzer, 2016). In the GCaMP construct the binding of calcium evokes
a conformational change which ultimately increases fluorescence and brightness by modulating the

                                                                                                          9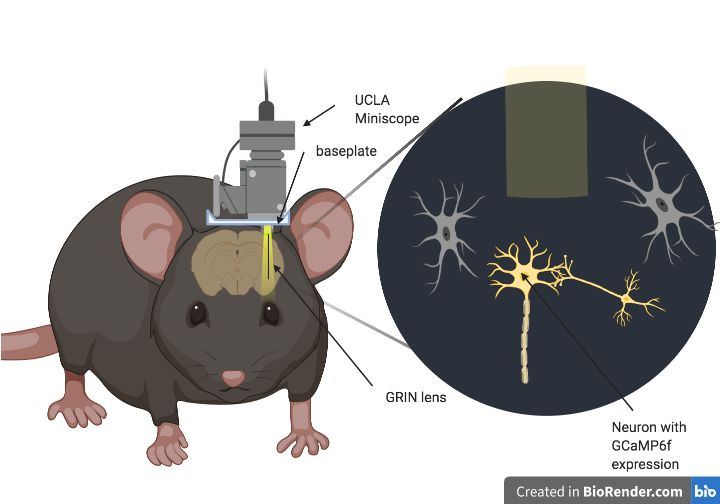
access to the chromophore and influencing the dissociation constant (pKa) (Chen et al., 2013).
Typically, an excitation signal in the blue spectrum of about 480 nm is used to excite the GCaMP
fluorescence (Barnet et al., 2017).
Despite clear advantages in the labelling of different genetically defined classes of neurons and the
possibility of chronic recordings, this first generation of GECI’s and GCaMP’s still had a number of
disadvantages compared to synthetic chemical calcium dyes. For instance, their response kinetics were
drastically slower, limiting the ability to differentiate individual action potentials and firing rate
variations (Sun et al., 2013). They had a relatively low sensitivity or signal to noise ratio F/F0, where
F is the change in fluorescence and F0 is the resting baseline fluorescent value. In addition, the
relationship between Ca2+ concentration and fluorescence was not linear (Ye et al., 2017). Another
limitation of the first GCaMPs was that they were not stable enough for in vivo recordings as
physiological pH and temperature rendered them unstable (Nakai et al., 2001). As a result of these
disadvantages, it was important to carefully consider the required sensitivity needed for the
experimental goals before choosing one of the initial GECI’s over the more sensitive yet invasive
chemical dyes (Chen et al., 2013).
However, over the past years the development and improved performance of GCaMP indicators has
been striking. In 2006, a more stable GCaMP2 was developed allowing for in vivo imaging of mouse
hearts (Tallini et al., 2006). Two years later a GCaMP3 version showed improvements concerning
signal-to-noise ratio, dynamic range and affinity for Ca2+. This resulted in two major advancements
concerning the detection of distinct action potentials and the first transgenic mice generated for
GCaMP (Ye et al., 2017). This was pivotal as it led to a screening for beneficial mutations, leading to
the development of a new family of ultrasensitive GCaMPs (Chen et al., 2013). Namely GCaMP6, a
group of GECI’s which are divided into GCaMP 6s (slow), GCaMP 6m (medium) and GCaMP 6f
(fast) based on their kinetics. The GCaMP6’s with the slowest kinetics show the best signal to noise
ratio. By binding Ca2+ more tightly, they produce longer lasting and stronger signals. However, the
high resolution comes at the cost of sacrificing signalling speed and the ability to identify a high
number of action potentials in quick succession (Jercog et al., 2016). Yet for small numbers of action
potentials, the slower GCaMP 6s produces a 10-fold higher signal compared to GCaMP3. It is
important to note that all GCaMP6 variants have a higher sensitivity compared to popular chemical
dyes such as Oregon Green BAPTA. When it comes to kinetics, the fastest GCaMP6 (GCaMP 6f) is
comparable to Oregon Green BAPTA in its ability to isolate fast action potentials (Chen et al., 2013).
Overall, this has made the GCaMP6 family an incredibly valuable tool for imaging both large groups
of neurons and neuronal subcompartments in live animals over multiple sessions.
10Finally, it’s important to note that an excessive GCaMP expression can cause multiple side effects in
neurons. Some of the transgenic mouse lines, expressing GCaMP, have shown consistent aberrant
electrical activity patterns leading to epileptiform events (Steinmetz et al., 2017). Although the exact
cause of the epileptiform events is not clear, the broad expression of GCaMP during development is
thought to be a major contributing factor. Correspondingly, high levels of viral vector-based GCaMP
transduction can disrupt certain voltage gated Ca2+ channels leading to abnormal activity, neuronal
damage, cell death and a poorer sensing performance (Resendez et al., 2016, Yang et al., 2018).
Conversely, an insufficient expression of the viral vector could impede the capability of extracting
sufficiently powerful Ca2+ signals. As a result, when working with viral vectors prior to any in vivo
experiments, appropriate dilutions should be examined in order to avoid both accumulating high levels
of GCaMP sensors as well as inadequately low ones.
2.1.3 Calcium imaging instrumentation
The capacity to adequately monitor neuronal activity with a calcium indicator does not rely solely on
the intrinsic properties of the indicator itself, but also on the properties of the optical instrumentation
used. The most notable characteristics of the instrumentation include the efficiency and possible noise
sources during the photo-detection process, the intensity of the illumination, the rate of the pixel or
frame acquisition and the resolution. It is important to note that the accuracy of spike detection relies
on more than just the dynamic range of the signal or the signal to noise ratio F/F0. For instance, the
dynamic range of a signal does not account for the temporal waveform of the signal or for the total
number of photon fluxes per optical transient. As a result, an equally effective spike detection can be
obtained with vastly different F/F0 values. (Hamel et al., 2015).
Theories from engineering such as signal detection theory can provide us with a suitable mathematical
framework to discuss and disentangle the cumulative effects of different factors on spike detection
fidelity. In addition, by applying the theory to a time-dependent model, the stochastic nature of
fluorescent emission within the same indicator can be taken into account (Wilt et al., 2013). More
precisely, using signal detection theory, a metric d’ (a Cohen’s d expressing the effect of one action
potential on photon flux) symbolizes the limits of action potential detection. In addition, the use of this
metric can indicate the proportion of the trade-off between false-negative and false-positive spike
detection. Interestingly, the prevalence of both false-positive and false-negative spike detection rates
show a faster than exponential decline with an increase in d’. This is regardless of the relationship
between d’ and optical parameters, which can be linear or polynomial (Hamel et al., 2015).
11This is an important point as it implies that even small advances in cameras and optical hardware (as
well as indicators) can have large effects on the effectiveness of capturing neuronal activity.
In general calcium imaging devices combine a light source, a microscope and a light sensing device in
order to excite and record the fluorescence of the calcium indicator.
Wide-field microscopy usually uses a mercury or a xenon lamp allowing for the alternation of different
excitation wavelengths. The imaging is then captured by intensified cameras, such as a charge-couple
device (CCD) or by using photodiode arrays. The CCD cameras are often the preferred imaging
instrument because of their relatively low read noise and high temporal and spatial resolution. They
are composed of photodiodes compressed into a chip that perform a serial readout of the signals.
However, despite their high resolution, the recording depth for a detailed wide-field microscopy is
limited to about a 100 m. As a result, they are mostly used for in vitro imaging experiments such as
calcium imaging studies in neuronal cell cultures (Grienberger & Konnerth, 2012; Homma et al.,
2009).
Imaging neurons with calcium indicators at deeper depths is usually done through a confocal
microscope. A confocal microscope is a laser scanning microscope which generates an image by
scanning a laser beam over the selection and blocking out-of-focus fluorescence from reaching the
detector through a pinhole (Grienberger & Konnerth, 2012). When using a classical one photon
microscope for imaging relatively deep structures, this pinhole will block signals originating from the
periphery of the point of intertest as well as ballistic photons originating from the confocal plane
leading to a poor resolution. A partial solution for this can be increasing the excitation light power.
However, this will increase photodamage, especially in the nearby non imaged regions. As a result, a
single photon microscope can only penetrate to about 200 µm in highly scattering brain tissue. A two-
photon microscope on the other hand uses 2 cooperating low energy infrared photons for a very
localized excitation. This improved optical sectioning enables a two-photon microscope to image
calcium indicators at depths that are at least twice as deep compared to those obtained with a one
photon microscope (Grienberger & Konnerth, 2012; Hamel et al., 2015; Jung et al., 2004). Moreover,
a better penetration is also facilitated by the fact that typical excitation wavelengths fall within the
infra-red spectrum (Barnett et al., 2017). Since all excited fluorescence photons come from the same
focal spot, there is less photodamage and out-of-focus background flux in the surrounding areas. In
addition to the optical sectioning, the rejection of background fluorescence permits the microscope to
obtain a higher resolution than one photon microscopes despite imaging at a greater depth (Aharoni &
Hoogland, 2019; Homma et al., 2009; Jung et al., 2004).
12However, it is important to note that despite the less impressive dynamic range of one-photon video
data, its capacities in calcium detection are not lower compared to a two-photon microscope. As noted
earlier a distinction must be made between resolution F/F0 and detection (d’). One-photon imaging
offers the advantage of full-frame image acquisition at a rate between 10-100ms. Two photon imaging
on the other hand images each individual pixel serially at a rate of 0.1-3ms per pixel (Jung et al., 2004;
Hamel et al., 2015). This advantage of high-speed full frame imaging allows for the discrimination of
different sometimes overlapping structures with the use of statistical methods, provided that their
underlying activity is occasionally asynchronous. For an effective detection, the analytical statistical
methods must take into account the time varying nature of the fluorescent background signal. These
methods include constrained non-negative matrix factorization (CNMF) and principal component
analyses (PCA) (Aharoni et al., 2019). Ultimately similar detection d’ values can be found for both
two-photon and one photon microscopy, despite the poorer resolution of the latter (Glas et al., 2018;
Hamel et al., 2015). In addition to full frame acquisition, one photon microscopy also has advantages
in its lower cost and relatively easier implementation (Aharoni et al., 2019).
So far, this paper has discussed confocal microscopes with imaging depths under 1 mm, however most
mammalian brain regions of interest are located much deeper (Jung et al., 2004). A more invasive
micro-endoscopic approach can be taken for the imaging of deeper structures. Micro-endoscopy
combines a one- or two-photon laser scanning microscope with the insertion of one or multiple gradient
refractive index (GRIN) lenses (Grienberger & Konnerth, 2012). These lenses are implanted into the
brain tissue and could theoretically be used for recordings at any brain depth (Birkner et al., 2017).
GRIN lenses rely on internal refractive index variations, rather than curved refractive surfaces, to
efficiently guide light back from the recording site (Figure 1). As GRIN lenses do not require a curved
optical surface it becomes relatively inexpensive to fabricate ones with sub-millimeter diameters (Jung
et al., 2004). Interestingly, focal adjustments within the tissue can be made by simply adjusting the
axial position of the laser focus (Wilt et al., 2009).
13Figure 1. A conventional lens with a curved surface on the right and a gradient refractive index (GRIN)
lens on the left. The light rays passing through a GRIN lens are continuously bent. This bending of the
light rays relies on refractive index variations within the lens material itself. Reprinted from photonics
media, by GRINTECH GmbH, 14 December 2020, retrieved from http://www.photonics.com/
Copyright © 2020 by SPIE Europe
There are two main optical imaging paradigms used in studies for in vivo imaging in rodents. Namely,
those where the animal’s head is fixed and more recently, those permitting freely moving behaviour
(Hamel et al., 2015). Micro-endoscopy can be applied in both paradigms, however it is crucial to
consider whether limiting the animal’s behaviour will obstruct or benefit the study. For instance, head-
fixation can be combined with virtual reality, allowing for manipulations which might be unattainable
in a non-constrained animal (Harvey et al., 2009, Stamatakis et al., 2018). However, when using a
virtual environment, the constrained animal will experience different vestibular, tactile and
proprioceptive inputs compared to a non-constrained animal. These can, in addition to elevated stress
levels, lead to deviations from normal neuronal dynamics (Aharoni et al., 2019; Jercog et al., 2016,
Stamatakis et al., 2018). In contrast, recordings in freely moving animals permit a more naturalistic
manifestation of behaviour. These studies usually implement a miniaturized head mounted fluorescent
microscope (Miniscope). This technique will be discussed in more detail in section 2.4 of this thesis.
2.2 In vivo imaging vs in vivo electrophysiological recording
For many decades, the most prominent technique used to monitor the dynamics of neurons in behaving
rodents has been extracellular electrophysiological recording. Despite its role in breakthrough
discoveries and the enduring advantages in temporal resolution, the use of in vivo microelectrodes has
some pronounced limitations (Hamel et al., 2015).
14In vivo imaging techniques can offer some compelling additional information in light of these
drawbacks. Firstly, optical imaging can record up to a thousand neurons at a time, a much higher
number than what would currently be realistic with microelectrodes (Ziv et al., 2013). In addition, both
sparsely and densely organized neurons as well as their connectivity patterns (and subcompartments)
can be reliably tracked for many weeks. In comparison, electrophysiological techniques do not capture
the anatomical location of neurons. As a result, in vivo imaging provides the possibility for a more
intricate analyses of neuronal ensemble activity (Jercog et al., 2016).
It is important to note that the ability to reliably image the same neurons in vivo over an extended
period of time drastically reduces the number of animals needed for an experiment. Since an animal
can be imaged before and after the experimental intervention, each animal can serve as its own control.
This can relieve the confounding effect of interindividual biological variability. In addition, since
encoded indicators can be stably expressed, both longitudinal studies and the use of the same animal
for multiple experiments are possible. This is ethically important as it is in line with the globally
implemented scientific 3R’s (reduction, refinement and replacement) principles originally proposed
by Russell and Burch in 1959 (Lauber et al., 2017).
Another merit of using encoded indicators for in vivo imaging, is that specific types of neurons can be
targeted based on their genetic code. Furthermore, the development of red fluorescent indicators, as
opposed to green ones, opens up the possibility to observe two different types of cells simultaneously
(Douglass et al., 2017; Birkner et al., 2017; Inoue et al., 2014).
Electrophysiological techniques using (micro)electrodes implanted into the extracellular fluid of a
living animal in order to record local field potentials are not able to measure firing rates lower than 0.1
Hz (Harris et al., 2017). This can make it challenging to isolate active neurons with very low spiking
rates. In addition, certain neuron’s unfavorable morphology and weak dipoles could obstruct their
signal to the extracellular electrode. This sampling bias for active cells, could lead to an overestimation
of action potentials in extracellular electrode recordings (Jercog et al., 2016). Compared to
extracellular microelectrodes, spiking estimates of quiet cells observed with in-vivo imaging
approximate intracellular recordings more closely. Hubert and colleagues reported calcium (Ca2+)
transient rates as low as 0.001 Hz in cortical motor neurons (Huber et al., 2012). This was found using
a chronic cranial window in mice, a head-fixed technique where a glass coverslip is installed on the
skull surface after a craniotomy. Thereafter a two-photon microscope can be used to image the
underlying activity while the mouse is awake.
15This is a striking merit as it allows in vivo imaging to detect neurons with very low activity rates,
which would be too inactive to isolate and go undetected in extracellular electrical recordings. As these
identified neurons can be reliably and stably recorded over a period of weeks, the techniques can lend
themselves to an investigation of the relation between changes in neuronal population activity and
behaviour (Hamel et al., 2015).
However, compared to extracellular electrode recordings calcium indicators also have some distinct
disadvantages. All calcium indicators, except for aequorin, act as exogenous calcium buffers
contributing to the buffers already present. As a result, adding calcium indicators may have a somewhat
disrupting effect on local calcium dynamics and this effect would be different between different types
of neurons (Grienberger & Konnerth, 2012; Jercog et al., 2016).
It is also crucial to note that Ca2+ transients are only a proxy for electrical changes in neuronal activity
and do not offer a synchronous representation of a change in voltage. Action potentials initiate Ca2+
channel activation and intracellular buffering. Hence Ca2+ dynamics represent a different biophysical
process than the one responsible for the action potential itself. In other words, intracellular Ca2+
changes are the result of voltage changes and thus, unlike electrophysiological recordings, they do not
reflect a precise temporal resolution of neuronal spikes. For instance, the total duration of a single
action potential can last from 0.5 to 5 ms whereas the slower calcium transients can only be detected
at 30-60ms intervals (Lin & Schnitzer, 2016). One consequence of these slower kinetics is that in vivo
calcium imaging is not able to detect subthreshold voltage dynamics such as membrane
hyperpolarization. The fact that the signal from a fluorescent calcium indicator represents a temporally
filtered version of the electrical signal accounts for the typical expression of the time trace of a cell as
a percentage of change from the baseline fluorescence (Jercog et al., 2016). Moreover, the filtering of
the temporal resolution varies between different Ca2+ indicators according to their kinetic properties
and Ca2+ binding (and unbinding) properties (Helmchen et al., 1996; Jercog et al., 2016). There can
also be random fluctuations in the emission and detection of fluorescence within the same indicator.
This is due to a stochastic phenomenon from quantum physics known as “shot noise” (Wilt et al.,
2013).
Despite these considerations, when combining the two techniques together, simultaneous in vivo
electrical and optical recordings virtually always reveal a useful linear relationship between the peak
amplitude of Ca2+ transients and the responsible action potentials (Jercog et al., 2016; Chen et al.,
2013). Overall, it seems that even though the Ca2+ signal might not be able to perform exact spike
counts during fast firing; it still provides an accurate representation of the firing patterns of a cell.
162.3 Other in vivo indicators
Calcium indicators capitalise on the properties of Ca2+ as a second messenger. A volumetric influx of
Ca2+ transforms the transient signals of action potential generation and ligand-gated channel opening
into a more prolonged biochemical change. In combination with the brightness of contemporary
indicators, this leads to a strong fluorescent signal which is relatively easy to detect. However, as noted
in the previous section this also leads to limitations in temporal precision and the inability to detect
membrane hyperpolarisations or subthreshold depolarisations. In this section we will discuss other
classes of indicators. Despite GECIs currently being the most advanced modality for in vivo imaging,
other indicators are likely to take on a more prominent role in the future.
2.3.1 Voltage indicators
Transmembrane voltage change is the most fundamental biophysical signal when studying neuronal
activity. Moreover, most fluorescent indicators serve as a proxy for these voltage changes. As a result,
efficient voltage indicators that could directly visualise electrical changes in cell populations or at the
single cell level would be very valuable. The changes in a cell’s electrical field are caused by a sub-
millisecond redistribution of a relatively small amount of charged ions, 5 orders of magnitude less
compared to the total amount of ions in a cell. Nevertheless, these ionic currents have a substantial
effect on membrane potential, leading to changes of more than 100mV which can even reverse the
cell’s polarity during an action potential’s peak amplitude (Peterka et al., 2011). Despite these steep
changes in membrane voltage, the resulting electrical field declines exponentially with the distance
from the membrane. This is due to the plasma membrane being very thin and surrounded by charged
molecules. Therefore, a voltage indicator would have to be meticulously localised in order to
effectively record the electrical field. In addition, due to its thinness only a small number of indicators
can be placed inside the membrane without disrupting or damaging it. Hence, very efficient
chromophores are needed to distinguish the fluorescent signal from photon shot noise. Due to these
challenges, contemporary voltage indicators are generally not up to par with state-of-the-art calcium
indicators. However, present-day voltage indicators show a large variety in their designs and
mechanisms each with inherent merits and limitations. (Lin & Schnitzer, 2016; St-Pierre et al., 2015).
17Similar to calcium indicators, the two main voltage indicators are Organic voltage sensitive dyes and
genetically encoded voltage indicators (GEVIs). Despite relatively fast kinetics, Organic voltage-
sensing dyes are often highly phototoxic due to the generation of free radicals or other triplet state
reactions (Peterka et al., 2011). Moreover, the voltage sensitive dies have been unable to capture spike
activity in mammalian cells. The first GEVIs capable of reporting activity in mammalian tissue
appeared in 2007 (Lin & Schnitzer, 2016). Since then, a plethora of different GEVI classes, with
different designs and sensing mechanisms, have been developed. These classes can essentially be
divided into two groups (St-Pierre et al., 2015). A first group of GEVIs rely on voltage sensing
confirmational changes by incorporating natural voltage sensing domains (VSD), such as those found
in voltage gated channels. Several VSD-indicators have been successful at imaging aggregated
population dynamics in living animals (Lin & Schnitzer, 2016). However, the VSD sensors typically
show very slow repolarisation kinetics, making it difficult to differentiate successive action potentials
which are closely spaced together (St-Pierre et al., 2015). Even though design ameliorations have been
made, a mechanistic understanding underlying VSD’s is often still limited making it difficult to
effectuate rational improvements (Lin & Schnitzer, 2016). A second group of GEVIs are the opsin-
based sensors, which exploit retinal chromophores of microbial rhodopsins by relying on voltage-
sensitive photophysical states for activity detection (St-Pierre et al., 2015). Compared to VSD-based
sensors, rhodopsin-based sensors typically show a superior sensitivity and fast kinetics. For instance,
when it comes to detecting a single action potential, some opsin-based sensors show response
amplitudes comparable with calcium indicators. However, these fast GEVIs show a suboptimal
membrane localisation leading to intracellular aggregates. In addition, they do not persist beyond 2ms
leading to the requirement of sampling rates 20 times higher than those used for calcium imaging
(>300Hz) (Lin & Schnitzer, 2016; St-Pierre et al., 2015). Furthermore, the initial opsin-based sensors
had an inherent very low brightness (2 orders of magnitude less compared to the VSD-sensors),
limiting their use in vivo. Interestingly, a solution to this dimness has been found by fusing opsins with
fluorescent proteins (FPs) forming a FRET pair (Zou et al., 2014). This opsin-based FRET design has
led to sensors which are bright enough to detect voltage changes in vivo. However, compared to
standalone opsin indicators their response amplitudes are low and they still show an equally limited
membrane localisation (St-Pierre et al., 2015). Recently, a mutant rhodopsin was identified and
implemented in a redshifted opsin-based FRET. This resulted in a voltage sensitivity improvement,
which was more than twice as high compared to previous opsin-based FRET designs (Xu et al., 2019).
It is clear that the different mechanisms for voltage sensing have opened up the possibility for different
improvements. GEVIs are an emerging group of indicators, which will ultimately lead to the imaging
of neuronal activity with an unparalleled temporal resolution.
182.3.2 Synaptic vesicle release indicators and specific neurotransmitter indicators
The capacity of neuronal cells to efficiently communicate with each other relies on the sub millisecond
release of neurotransmitters into the synaptic cleft (Rizo & Xu, 2015). During membrane
depolarisation, the influx of Ca2+ into the presynaptic terminal triggers the docking, priming and fusion
of vesicles with the membrane, leading to a synaptic vesicle release. During membrane fusion the
transmitters experience a substantial change in pH (Shen et al., 2014). This is due to the pH of the
vesicles being approximately 5.5, whereas the extracellular space has a pH of about 7.5. As a result,
genetically encoded pH indicators (GEPIs) can serve as a fluorescent marker for vesicle release (as
well as for endo- and exocytosis in general). Despite GEPIs being able to detect action potential events
in vitro, scattering and increased autofluorescence constrain its single action potential detecting
capabilities (Lin & Schnitzer, 2016). Nevertheless, GEPIs are inherently capable of visualising
responses over a large number of synapses. This merit led them to being the first sensors used for the
visualisation of population neuronal activity in vivo. Another advantage of visualising vesicle release
is that it can indicate neuronal outputs regardless of an associated postsynaptic processing.
GEPIs can visualize neurotransmitter vesicle release but tell us nothing about the content of the vesicle.
This is an important point as different neurotransmitters operate in different neuronal circuits and have
diverging effects on postsynaptic neuronal activity. As a result, genetically encoded transmitter
indicators (GETIs), which can visualize specific neurotransmitters, are likely to play an important role
in dissecting neuronal circuitry in the future. Moreover, due to the high concentrations of released
neurotransmitters and their associated fast kinetics, neurotransmitters are attractive targets for neuronal
activity sensing in general (Lin & Schnitzer, 2016). GETIs have been developed for the visualization
of the primary excitatory neurotransmitter glutamate. So far, the most responsive one being the
intensity-based glutamate-sensing fluorescent reporter (iGluSnFR), constructed by combining an E.
coli glutamate binding protein and a cpGFP (Marvin et al., 2013). The bright, photostable iGluSnFR
is capable of detecting subthreshold activity and can be used for long-term imaging in vivo. For
instance, iGluSnFR has been used in vivo for a mesoscale mapping of the mouse cortex (Xie et al.,
2016). In this cranial window study iGluSnFR was compared to GCaMP6s, showing a similar response
amplitude, but faster kinetics. Hitherto available GETIs seem only to include glutamate indicators.
However, since bacterial binding proteins also exist for other neurotransmitters, it seems likely that
different indicators will be developed in the foreseeable future (Lin & Schnitzer, 2016).
192.4 Miniscope
The miniature fluorescent microscope (Miniscope) is a relatively new in vivo tool which can image
neuronal activity in real time during unrestrained behaviours. The principal merit of Miniscopes is that
they can provide an elucidating link between behaviour and the underlying neuronal activity of a
specific brain region. As a result, accurate behavioural tracking or quantification are important in order
to correlate the regional activity with the behaviour of interest (Aharoni & Hoogland, 2019).
Miniscopes are essentially portable head-mounted imaging devices which allow the animal to move
freely. In general, except for the GRIN lens, the essential components of a Miniscope are the same as
those of a regular fluorescent microscope. However, there were initially many different approaches
when it comes to the design or which components to include in the head mounted device (Grienberger
& Konnerth, 2012). In comparison to tabletop microscopes, the adjustment of the focal plane is
typically done by shifting the image sensor and not by moving the objective.
Recently a number of low cost open-source building plans for Miniscopes have been released (Aharoni
& Hoogland, 2019). These new Miniscopes provide a less costly alternative to the ones provided by
commercial vendors and are comprised of relatively easily obtainable components and design plans.
These include simple LEDs, complementary metal oxide semiconductor (CMOS) imaging sensors and
GRIN lenses. The emergence of accessible open source Miniscopes has led to a larger user base and a
wider variety of applications for the technique. In addition, the nature of the open-source community
has led to the rapid sharing of new modifications and designs. Due to cost considerations, most
implementations of open source Miniscopes use a single-photon microscope. As a result, the post hoc
algorithmic extraction becomes a crucial step for correctly identifying neuronal activity. Some of the
most prominent open-source projects include the popular UCLA Miniscope, FinchScope, NINscope
and Chendoscope (Aharoni & Hoogland, 2019; de Groot et al., 2020). These all vary in components,
ease of assembly, weight, imaging rate and field of view.
As noted earlier the use of GRIN lenses provides an optical interface which can efficiently relay light
emission between the microscope objective and the neurons of interest. The use of multiple GRIN
lenses is especially useful for imaging deep neuronal structures. Generally, Miniscopes combine both
an implanted GRIN lens and a larger (in diameter) objective GRIN lens. In order to minimize
invasiveness and avoid ablation, the implanted GRIN lenses are typically very small 0,5-2 mm in
diameter. Inflammation, caused by the invasive surgery, is a prominent factor contributing to
20substantial imaging failure rates (Bocarsly et al., 2015). In order to avoid unnecessary inflammation,
a very slow insertion of the implanted GRIN lens is warranted. Moreover, other approaches attempting
to bypass the negative effects of inflammation on successful imaging, include the administration of
the cortisone dexamethasone (in order to avoid surgery related tissue swelling) and the use of a
polyimide thin-walled guide canula which forms a barrier between the GRIN lens and the surrounding
brain tissue (Bocarsly et al., 2015; Zhang et al., 2018). The effect that tissue damage might have on
behaviour should not be disregarded. One study found no effects of an ultrathin GRIN lens
implantation (0,350 mm in diameter) on behaviour (Lee et al., 2016). The lens was inserted at about 1
mm depth into the prefrontal cortex and did not cause any deficits in vestibulo-motor and spatial
memory tests. However, it is important to note that both the thickness of the lenses and the depth of
the implantations were smaller than what would be needed for the imaging of deeper structures.
A number of Miniscope advancements are starting to be implemented or are currently in development
by both commercial vendors and open-source Miniscopes. A first functional improvement regards the
electronic focusing of the lens. This can be done through electrowetting lenses and has already been
achieved with a commercial two-photon microscope (Ozbay et al., 2018). An electronic adjustment of
the focal length reduces the requirement of mechanical adjustment and facilitates the recovery of the
focal plane over multiple imaging sessions. A second improvement involves the possibility to
simultaneously record multiple distinct cell populations using 2 or more indicators with separable
fluorescent wavelengths. For instance, by combining a GCaMP with a red-shifted channel rhodopsin.
A number of studies have started implementing these two-colour fluorescents, investigating how the
dynamics of different neuronal populations within the same region correlate with behaviour (Birkner
et al., 2017, Douglass et al., 2017, Jennings et al., 2019). Recently, the simultaneous imaging of
multiple regions has also become a possibility. De Groot and colleagues have developed an open
source Miniscope (called NINscope), which is sufficiently compact and light and that can concurrently
record from more than one brain region (de Groot et al., 2020). This advancement is very promising
as it is likely to contribute to a better understanding of the inter-regional signalling during behaviour.
The combination of optogenetic stimulation during imaging has also become increasingly prevalent
(Jennings et al., 2019, de Groot et al., 2020, Stamatakis et al., 2018). This is made possible by
incorporating light-driven channels into the Miniscope with spectra that show a minimal crosstalk with
fluorescent indicators. Optogenetics provides the possibility to selectively activate neuronal elements,
allowing for the determination of a causal relationship (Stamatakis et al., 2018). Thus, it is
unsurprising that the combination of both measuring and manipulating neuronal activity with a precise
timescale and cellular resolution could become a powerful tool for the investigation of network
21dynamics and the neuronal basis of behaviour in general. Finally, the popularity of the open-source
projects has led some of them to implement a number of advancements. For instance, the UCLA project
is developing a number of different Miniscopes with a larger field of view, ones that offer the
possibility for wireless recordings and some incorporating simultaneous extracellular
electrophysiological recordings (Aharoni & Hoogland, 2019).
3. Objective of the pilot study
This thesis describes a pilot study that attempts to use the open-source UCLA V3 Miniscope for the in
vivo imaging of neuronal ensembles in the central nucleus of the amygdala (CeA) in mice.
In this study it was planned to use very small GRIN lenses without ablation of brain tissue. Typically,
Miniscope studies require the aspiration of brain tissue as they implement a relatively wide lens (1,8
mm in diameter). Conversely, by using GRIN lenses with a very small diameter (0,5 mm) the aspiration
of brain tissue can be avoided. This makes the access to deeper brain areas more attainable. A number
of studies have successfully applied a microendoscopic technique for the successful imaging of deeper
brain structures (Douglass et al., 2017; Zhang & Li, 2018; Sun et al., 2019; Lee & Han, 2020;
Schwenkgrub et al., 2020). In addition, some provide detailed guidelines concerning their methods
(Resendez et al., 2016; Zhang et al., 2018; Lee & Han, 2020). However, the implemented techniques
and materials are often quite divergent. Moreover, the success rate of imaging deep regions and the
amygdala in particular, seems to be relatively poor (Lee & Han, 2020). This project is therefore to be
seen as a feasibility study for the Neuropsychopharmacology group at the University of Helsinki. If
the imaging would be successful, the Miniscope could be used to record neuronal activity in the CeA
during different experimental paradigms. Primarily, the activation of CeA neuronal ensembles during
binge eating behaviour would be investigated.
With the commencement of a collaboration with the Department of Psychology at the university of
Jyväskylä, 3 animals were sent to the Jyväskylä lab for lens implantation surgery and subsequent
imaging after the viral injections were done in Helsinki. The psychology department in Jyväskylä is in
the process of implementing a commercial Miniscope (from Inscopix) in their research. This
collaboration has already proven fruitful and will likely keep benefitting both parties in the future,
ultimately leading to the optimisation and standardisation of Miniscope protocols.
22You can also read