Locus coeruleus imaging as a biomarker for noradrenergic dysfunction in neurodegenerative diseases
←
→
Page content transcription
If your browser does not render page correctly, please read the page content below

doi:10.1093/brain/awz193                                                                                                                         BRAIN 2019: 0; 1–14           | 1

                                                                                                                                                                                        Downloaded from https://academic.oup.com/brain/advance-article-abstract/doi/10.1093/brain/awz193/5536581 by Deutsches Zentrum fuer Neurodegenerative Erkrankungen user on 22 July 2019
Locus coeruleus imaging as a biomarker
for noradrenergic dysfunction in
neurodegenerative diseases
Matthew J. Betts,1,2 Evgeniya Kirilina,3,4 Maria C.G. Otaduy,5 Dimo Ivanov,6
Julio Acosta-Cabronero,7 Martina F. Callaghan,7 Christian Lambert,7
Arturo Cardenas-Blanco,1,2 Kerrin Pine,3,7 Luca Passamonti,8,9 Clare Loane,10
Max C. Keuken,11,12 Paula Trujillo,13 Falk Lüsebrink,14,15 Hendrik Mattern,14 Kathy Y. Liu,16
Nikos Priovoulos,17 Klaus Fliessbach,18,19 Martin J. Dahl,20 Anne Maaß,1
Christopher F. Madelung,21 David Meder,21 Alexander J. Ehrenberg,22,23
Oliver Speck,1,14,24,25 Nikolaus Weiskopf,3,7 Raymond Dolan,7,26 Ben Inglis,27 Duygu Tosun,28
Markus Morawski,29 Fabio A. Zucca,30 Hartwig R. Siebner,21 Mara Mather,31
Kamil Uludag,32,33 Helmut Heinsen,34,35 Benedikt A. Poser,6 Robert Howard,16
Luigi Zecca,30,36 James B. Rowe,8 Lea T. Grinberg,22,34,37 Heidi I.L. Jacobs,6,38,39
Emrah Düzel1,2,10,* and Dorothea Hämmerer2,7,10,*

*These authors contributed equally to this work.

Pathological alterations to the locus coeruleus, the major source of noradrenaline in the brain, are histologically evident in early stages of
neurodegenerative diseases. Novel MRI approaches now provide an opportunity to quantify structural features of the locus coeruleus
in vivo during disease progression. In combination with neuropathological biomarkers, in vivo locus coeruleus imaging could help to
understand the contribution of locus coeruleus neurodegeneration to clinical and pathological manifestations in Alzheimer’s disease,
atypical neurodegenerative dementias and Parkinson’s disease. Moreover, as the functional sensitivity of the noradrenergic system is
likely to change with disease progression, in vivo measures of locus coeruleus integrity could provide new pathophysiological insights
into cognitive and behavioural symptoms. Locus coeruleus imaging also holds the promise to stratify patients into clinical trials
according to noradrenergic dysfunction. In this article, we present a consensus on how non-invasive in vivo assessment of locus coeruleus
integrity can be used for clinical research in neurodegenerative diseases. We outline the next steps for in vivo, post-mortem and clinical
studies that can lay the groundwork to evaluate the potential of locus coeruleus imaging as a biomarker for neurodegenerative diseases.

1 German Center for Neurodegenerative Diseases (DZNE), Magdeburg, Germany
2 Institute of Cognitive Neurology and Dementia Research, Otto-von-Guericke-University Magdeburg, Magdeburg, Germany
3 Department of Neurophysics, Max Planck Institute for Human Cognitive and Brain Sciences, Leipzig, Germany
4 Center for Cognitive Neuroscience, Free University Berlin, Berlin, Germany
5 Laboratory of Magnetic Resonance LIM44, Department and Institute of Radiology, Medical School of the University of São Paulo, Brazil
6 Department of Cognitive Neuroscience, Faculty of Psychology and Neuroscience, Maastricht University, 6200 MD, Maastricht,
  Netherlands
7 Wellcome Centre for Human Neuroimaging, UCL Institute of Neurology, London, UK
8 Department of Clinical Neurosciences, University of Cambridge, UK
9 Consiglio Nazionale delle Ricerche, Istituto di Bioimmagini e Fisiologia Molecolare (IBFM), Milan, Italy
10 Institute of Cognitive Neuroscience, University College London, London, UK

Received February 22, 2019. Revised April 12, 2019. Accepted May 1, 2019
ß The Author(s) (2019). Published by Oxford University Press on behalf of the Guarantors of Brain.
This is an Open Access article distributed under the terms of the Creative Commons Attribution Non-Commercial License (http://creativecommons.org/licenses/by-nc/4.0/), which permits
non-commercial re-use, distribution, and reproduction in any medium, provided the original work is properly cited. For commercial re-use, please contact journals.permissions@oup.com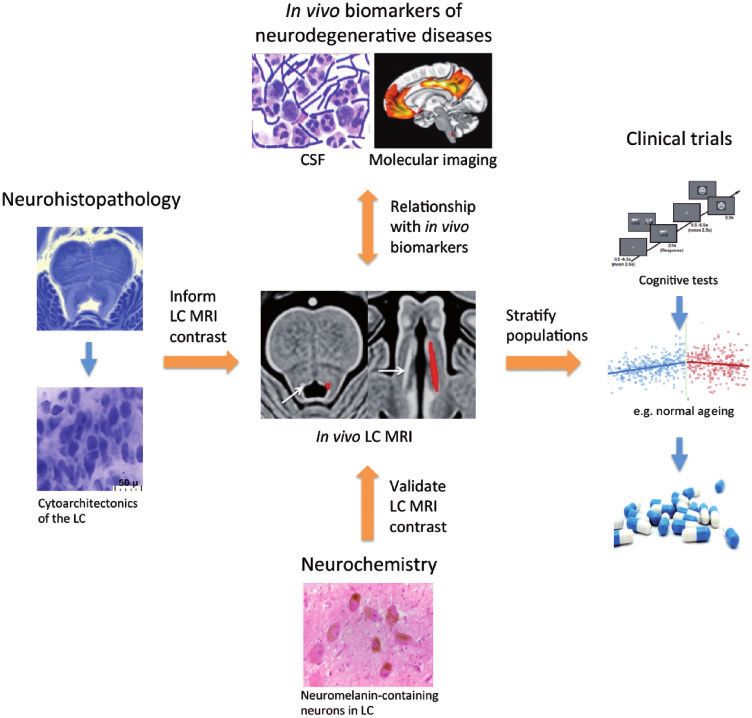
2    | BRAIN 2019: 0; 1–14                                                                                       M. J. Betts et al.

                                                                                                                                      Downloaded from https://academic.oup.com/brain/advance-article-abstract/doi/10.1093/brain/awz193/5536581 by Deutsches Zentrum fuer Neurodegenerative Erkrankungen user on 22 July 2019
11   University of Amsterdam, Integrative Model-based Cognitive Neuroscience research unit, Amsterdam, The Netherlands
12   University of Leiden, Cognitive Psychology, Leiden, The Netherlands
13   Department of Neurology, Vanderbilt University Medical Center, Nashville, TN, USA
14   Department of Biomedical Magnetic Resonance, Institute for Physics, Otto-von-Guericke-University, Magdeburg, Germany
15   Department of Neurology, Otto-von-Guericke University, Magdeburg, Germany
16   Division of Psychiatry, University College London, London, UK
17   Faculty of Health, Medicine and Life Sciences, School for Mental Health and Neuroscience, Alzheimer Centre Limburg,
     Maastricht University, Maastricht, The Netherlands
18   Department for Neurodegenerative Diseases and Geriatric Psychiatry, University Hospital Bonn, Bonn, Germany
19   German Center for Neurodegenerative Diseases (DZNE), Bonn, Germany
20   Center for Lifespan Psychology, Max Planck Institute for Human Development, Berlin, Germany
21   Danish Research Centre for Magnetic Resonance, Centre for Functional and Diagnostic Imaging and Research, Copenhagen
     University Hospital Hvidovre, Denmark
22   Memory and Aging Center, Weill Institute for Neurosciences, University of California, San Francisco, San Francisco, CA, USA
23   Department of Integrative Biology, University of California, Berkeley, Berkeley, CA, USA
24   Center for Behavioral Brain Sciences, Magdeburg, Germany
25   Leibniz Institute for Neurobiology, Magdeburg, Germany
26   Max Planck Centre for Computational Psychiatry and Ageing, University College London, UK
27   Henry H. Wheeler, Jr. Brain Imaging Center, University of California, Berkeley, CA, USA
28   Department of Radiology and Biomedical Imaging, University of California - San Francisco, San Francisco, CA, USA
29   Paul Flechsig Institute of Brain Research, Medical Faculty, University of Leipzig, Leipzig, Germany
30   Institute of Biomedical Technologies, National Research Council of Italy, Segrate, Milan, Italy
31   Leonard Davis School of Gerontology and Department of Psychology, University of Southern California, Los Angeles, CA, USA
32   Centre for Neuroscience Imaging Research, Institute for Basic Science and Department of Biomedical Engineering,
     Sungkyunkwan University, Suwon, Republic of Korea
33   Techna Institute and Koerner Scientist in MR Imaging, University Health Network, Toronto, Canada
34   University of São Paulo Medical School, São Paulo, Brazil
35   Clinic of Psychiatry, University of Würzburg, Wurzburg, Germany
36   Department of Psychiatry, Columbia University Medical Center, New York State Psychiatric Institute, New York, USA
37   Global Brain Health Institute, University of California, San Francisco, San Francisco, CA, USA
38   Division of Nuclear Medicine and Molecular Imaging, Department of Radiology, Massachusetts General Hospital/Harvard
     Medical School, Boston, MA, USA
39   Faculty of Health, Medicine and Life Sciences, School for Mental Health and Neuroscience, Alzheimer Centre Limburg,
     Maastricht University, Maastricht, The Netherlands

Correspondence to: Matthew J. Betts
German Center for Neurodegenerative Diseases (DZNE)
Magdeburg, Germany
E-mail: matthew.betts@dzne.de

Keywords: locus coeruleus (LC); magnetic resonance imaging (MRI); neurodegeneration; noradrenaline (NA), biomarker
Abbreviations: LC = locus coeruleus; MT = magnetization transfer

                                                                      The locus coeruleus (LC) is the major source of nor-
Introduction                                                       adrenaline modulation in the brain and has been shown
The number of individuals over the age of 60 years is pro-         to be involved in regulating a wide range of higher cogni-
jected to rise from 841 million in 2013 to over 2 billion by       tive functions, such as working memory, learning and at-
2050 (World Population Ageing report, United Nations).             tention (Robbins, 1984; Aston-Jones and Cohen, 2005;
As the population has continued to age, age-related neuro-         Benarroch, 2009; Mather et al., 2016), memory consolida-
degenerative diseases have already reached epidemic pro-           tion and retrieval (Sterpenich et al., 2006; Sara, 2009),
portions. Whilst numerous therapeutic strategies are being         vigilance, arousal/wakefulness, rapid eye movement
investigated, current treatments provide only modest symp-         (REM) sleep behaviour, pain modulation, local blood
tomatic relief and do not slow or halt ensuing neurodegen-         flow and immunological mechanisms in the brain (Aston-
eration. A major priority is to develop early disease stage        Jones and Bloom, 1981; Benarroch, 2009; Espay et al.,
biomarkers that can improve the understanding of the               2014; Heneka et al., 2015; O’Donnell et al., 2015).
pathophysiology of neurodegenerative diseases, enable ear-         Conversely, age-related decline within the LC–nor-
lier detection of pathology and facilitate the application of      adrenergic system is associated with reduced cognitive abil-
timely symptomatic interventions.                                  ities relating to episodic memory (Hämmerer et al., 2018,
LC imaging as a biomarker for neurodegeneration BRAIN 2019: 0; 1–14 | 3
Downloaded from https://academic.oup.com/brain/advance-article-abstract/doi/10.1093/brain/awz193/5536581 by Deutsches Zentrum fuer Neurodegenerative Erkrankungen user on 22 July 2019
Jacobs et al., 2018b; Dahl et al., 2019) and reduced cog- et al., 2003; Giguère et al., 2018). Pathological changes in
nitive reserve (Robertson, 2013; Wilson et al., 2013; the LC have also been reported in other neurodegenerative
Clewett et al., 2016; Mather and Harley, 2016). In and neuropsychiatric conditions (Box 1), leading to the
Alzheimer’s disease, tau aggregates are observed first in notion that the LC may be a vulnerable target for path-
the LC, prior to their presence in transentorhinal/entorhinal ology (Sharma et al., 2010). Whether this is related to LC
cortex and neocortex (Braak et al., 2011; Stratmann et al., neurons’ high metabolic need in order to maintain essential
2016; Andrés-Benito et al., 2017; Ehrenberg et al., 2017). physiological functions or the close proximity of the LC to
In Parkinson’s disease, intraneuronal -synuclein burden in the fourth ventricle, exposing it to toxins from the CSF
the LC precedes and may be of even greater magnitude (Mather and Harley, 2016; Weinshenker, 2018), remains
than that in the dopaminergic substantia nigra pars com- to be determined.
pacta (SNpc) (Braak et al., 2003; Dickson et al., 2008). As With the notable exception of most of the basal ganglia,
a result, the degree of Parkinson’s disease-related neuronal the LC projects to large portions of subcortical and cortical
loss is likely just as severe in the LC as in the SNpc (Zarow areas (Berridge and Waterhouse, 2003). Moreover,
Box 1 Role of the LC in neurological disorders
Structural and functional changes in the human LC leading to deficits in noradrenaline may contribute to the pathophysiology and symptomatology
of several neurological disorders:
Alzheimer’s disease
Deposition of tau in and degeneration of the LC occurs early in the asymptomatic phase of Alzheimer’s disease (Braak and Del Tredici, 2012; Arendt
et al., 2015) suggesting that the LC is the initial site of pathology. Accumulation of tau (doubling from Braak stage 0 to 1; Ehrenberg et al., 2017) and
significant volume loss precede neuronal loss in the LC during Alzheimer’s disease progression (Theofilas et al., 2017). Depletion of up to 30% of LC
neurons has been reported in prodromal (mild cognitive impairment stage) Alzheimer’s disease, increasing to 55% with diagnosed dementia (Kelly
et al., 2017). Neuronal loss is particularly prevalent in the rostral/middle portion of the LC (German et al., 1992; Theofilas et al., 2017), correlating
with cognitive dysfunction including memory, perceptual speed, and visuo-spatial ability (Kelly et al., 2017), and with reduced noradrenaline levels in
hippocampus and cortex (Lyness, 2003). Compensatory activity, such as increased metabolism in surviving neurons or reorganization of functional
networks, can occur in early disease stages (Hoogendijk et al., 1999; Jacobs et al., 2015).
Synucleinopathies
In Parkinson’s disease and dementia with Lewy bodies, -synuclein containing Lewy bodies and neuronal cell loss are seen along the entire length of
the LC (German et al., 1992; Theofilas et al., 2017). Intraneuronal Lewy bodies also affect tyrosine hydroxylase (TH) activity, potentially interfering
with normal catecholamine biosynthesis (Tabrez et al., 2012), which may distinguish the effects of Parkinson’s disease/dementia with Lewy bodies
from Alzheimer’s disease (McMillan et al., 2011). It has also been postulated that LC burden precedes substantia nigra involvement in Parkinson’s
disease (Zarow et al., 2003; Braak et al., 2004; Seidel et al., 2015), rendering the LC a good candidate for preclinical diagnosis (Liu et al., 2017).
However, the field lacks a comprehensive analysis detailing the stages of neuronal loss in Parkinson’s disease.
Multiple system atrophy (MSA) is another heterogeneous -synucleinopathy, in which autonomic dysfunction, parkinsonism, and ataxia (Stankovic et al.,
2014; Walsh et al., 2018) are associated with severe neuronal loss in the LC and noradrenergic cardiorespiratory brainstem nuclei (A5, A1) (Benarroch
et al., 2008). An in vivo neuromelanin-sensitive MRI study has shown that LC contrast is reduced in MSA compared to healthy controls and that the ratio
of neuromelanin-sensitive MRI contrast in substantia nigra versus LC could help distinguish MSA from Parkinson’s disease (Matsuura et al., 2013).
Patients with idiopathic rapid eye movement sleep disorder (iRBD) have a strongly increased risk of developing Parkinson’s disease, dementia with
Lewy bodies, MSA and mild cognitive impairment; 75.7% and 90.9% develop a neurodegenerative syndrome 10 and 14 years from the time of iRBD
diagnosis, respectively. Interestingly, iRBD is associated with dysfunction of the LC-noradrenergic system (Knudsen et al., 2018) suggesting that LC
imaging might serve as a valuable biomarker in patients at risk of developing neurodegenerative disease.
Chronic traumatic encephalopathy
In addition to early pathological affection of cortical sulci, substantial LC damage and tau accumulation has also been reported in early disease stages
(Stein et al., 2014). LC pathology may also exacerbate clinical presentation of cognitive complaints and mood disturbances in chronic traumatic
encephalopathy (Stern and Daneshvar, 2013).
Frontotemporal lobar degeneration
Modest LC neuronal loss occurs in both tau- and non-tau- forms of frontotemporal lobar degeneration (Brunnström et al., 2011; Eser et al., 2018),
both in early and late disease stages (Irwin et al., 2016). Clinically, the loss and dysregulation of noradrenaline from LC degeneration may contribute
to cognitive decline, including impulsivity and apathy (Passamonti et al., 2018).
Essential tremor
A neuropathological study (n = 33) revealed Lewy body pathology in the LC in 25% of the cases with essential tremor (Louis et al., 2007).
Noradrenergic LC-cerebellar connections are important for the normal function of Purkinje cells and their inhibitory output (Moises et al.,
1981). Degeneration and ensuing LC dysfunction may modulate Purkinje cell activity and contribute to decreased cerebellar inhibition in essential
tremor (Louis et al., 2007).
Non-degenerative, neuropsychiatric illnesses
LC dysfunction, also without neuronal loss, has also been implicated in post-traumatic stress disorder (Bernard et al., 2011; Pietrzak et al., 2013),
addiction (Bernard et al., 2011), depression (Berridge and Waterhouse, 2003), suicidal behaviour (Roy et al., 2017) and chronic pain (Llorca-Torralba
et al., 2016; Taylor and Westlund, 2017).4 | BRAIN 2019: 0; 1–14 M. J. Betts et al.
Downloaded from https://academic.oup.com/brain/advance-article-abstract/doi/10.1093/brain/awz193/5536581 by Deutsches Zentrum fuer Neurodegenerative Erkrankungen user on 22 July 2019
reminiscent of locally specific connectivity in dopaminergic Magdeburg in 2018. It describes the challenges for establish-
nuclei (Haber and Knutson, 2010), tracing studies in the ing LC MRI measures as a biomarker for diagnosis and
rat suggest that there might be distinct projections from targeting therapeutic interventions in neurodegeneration and
rostrolateral LC to hippocampus, amygdala and septum outlines a strategy for obtaining reliable, biologically vali-
(Van Bockstaele et al., 2006) and from caudal aspects of dated and clinically suitable imaging approaches.
the LC to the spinal cord (Ennis et al., 1991). This may As discovered over a decade ago (Sasaki et al., 2006), the
indicate a stronger involvement of rostrolateral LC in mod- LC is visualized using MRI scanning protocols that are
ulating memory encoding and caudal LC in modulating sensitive to a paramagnetic compound called neuromelanin,
pain perception. which accumulates in noradrenergic neurons, and may be
While the LC is among the first brain structures to demon- taken as an indicator of LC integrity (i.e. cell density).
strate pathology in neurodegenerative diseases, it currently re- While neuromelanin-sensitive MRI is a relatively new tech-
mains unclear how alterations in LC structure and function nique, a number of studies have shown that MRI can detect
influence pathogenesis and symptom progression. In human signal differences in the LC between healthy controls and
studies, neuropsychiatric symptoms associated with LC activity, diseases with known LC involvement (e.g. in major depres-
such as sleep dysfunction, agitation, anxiety, appetite dysfunc- sion, Parkinson’s disease and Alzheimer’s disease as re-
tion and depression, appear as elements of the early clinical cently reviewed by Liu et al., 2017). Given, however, the
phenotypes of neurodegenerative diseases (Assal and substantial interindividual differences in LC measures
Cummings, 2002; Lanctôt et al., 2017; Ehrenberg et al., across healthy older adults (Liu et al., 2017, 2019), further
2018). In animal models, lesions of the LC have been shown studies are required to establish whether LC degeneration
to exacerbate tau and amyloid-b plaque deposition, leading to can be reliably detected in vivo (Liu et al., 2017; Sulzer
depletion of noradrenaline in LC target regions and impaired et al., 2018). Furthermore, to clarify whether interindivi-
cognitive function (Heneka, 2006; Kalinin et al., 2006, 2012; dual variability in LC integrity is related to varying levels
Jardanhazi-Kurutz et al., 2010; Chalermpalanupap et al., 2017; of neuropathologies (e.g. tau, amyloid or -synuclein), stu-
Rorabaugh et al., 2017). Whether the influence of LC degen- dies using LC MRI in combination with in vivo measure-
eration on pathology is directly related to a dysregulation of ments of pathology (e.g. PET and CSF biomarkers) in
noradrenaline, or indirectly related via neuroinflammatory cognitively normal older adults and patients are required.
mechanisms or alterations in additional LC neuromodulators, While these studies are currently underway, first results in
such as brain-derived neurotrophic factor or galanin, requires ageing and early-stage Alzheimer’s disease indicate that LC
further investigation (Chalermpalanupap et al., 2017; Betts MRI contrast is indeed modulated by both tau and amyloid
et al., 2018). Interestingly, there is also evidence of noradrener- pathology. Recent evidence demonstrating that LC MRI
gic hyperactivity in early disease (as reviewed by Weinshenker contrast is associated with CSF amyloid (amloid-b42/40) in
et al., 2018), consistent with a number of reports of elevated early-stage Alzheimer’s disease (Betts et al., 2019) and tau
levels of CSF noradrenaline and/or noradrenaline turnover in pathology at higher levels of amyloid burden using tau and
Alzheimer’s disease (Palmer et al., 1987; Hoogendijk et al., amyloid PET, respectively (Jacobs et al., 2018a), may par-
1999). Thus, hyperactivity in a structurally impaired LC tially explain the interindividual variability in LC integrity
might further accelerate the propagation of neuropathology observed in old age. Interestingly, post-mortem studies
in neurodegenerative disease via noradrenergic projections using 18F-AV-1451 tau PET have also shown off-target
(Weinshenker, 2018). As such, early detection of LC decline binding properties to neuromelanin in the substantia
using in vivo imaging techniques might contribute to earlier nigra (Marquié et al., 2015; Hansen et al., 2016). Thus
diagnosis, and support personalized pharmacological interven- 18
F-AV-1451 may also be capable of imaging neurodegen-
tions to alleviate compensatory hyperactivity of the noradren- eration. However, such changes may be difficult to inter-
aline system and potentially slow down disease progression. pret because of the mixed PET signal generated by on-
Recent advances in non-invasive neuroimaging techniques target binding to tau tangles and off-target binding to neu-
now permit the in vivo assessment of the LC using MRI romelanin, which would likely also be age-dependent.
(Sasaki et al., 2006; Keren et al., 2009; Clewett et al.,
2016; Betts et al., 2017; Priovoulos et al., 2018) opening
the possibility to track LC changes as a biomarker for nor-
adrenergic dysfunction. The utility of this approach for clin- Practical considerations in
ical research will depend on whether LC imaging in
combination with established biomarkers, can help to better
in vivo LC imaging
stage neurodegenerative diseases and characterize biomarker- The intrinsic neuromelanin-driven contrast that allows us
positive individuals before the onset of dementia. LC imaging to visualize the LC using MRI was first identified in vivo as
could also have important implications in clinical trials as a hyperintensity on 2D T1-weighted turbo spin echo (TSE)
stratification tool for predicting treatment success of pharma- images (Sasaki et al., 2006). These hyperintensities corres-
cological intervention studies targeting the noradrenergic pond closely with areas of higher concentration of neuro-
system. This article reports on the consensus reached at the melanin (Keren et al., 2015), suggesting that the high signal
first European Locus Coeruleus Imaging meeting held in intensities in the LC are driven by neuromelanin. In supportLC imaging as a biomarker for neurodegeneration BRAIN 2019: 0; 1–14 | 5
Downloaded from https://academic.oup.com/brain/advance-article-abstract/doi/10.1093/brain/awz193/5536581 by Deutsches Zentrum fuer Neurodegenerative Erkrankungen user on 22 July 2019
of this, a recent study has shown that the neuromelanin the cost of relatively low signal- and contrast-to-noise ratio
concentration in the substantia nigra is linearly related to (SNR and CNR, respectively) due to smaller voxel sizes
neuromelanin-MRI contrast and resting blood flow in the and higher vulnerability to subject motion, which has
substantia nigra (Cassidy et al., 2019). The observation prompted averaging over multiple repetitions. Anisotropic
that LC MRI acquisitions are subject to incidental magnet- voxels, which mimic the shape and orientation of the LC,
ization transfer (MT) effects (Dixon et al., 1990) and that have capitalized on the elongated shape of the LC to in-
dedicated MT preparation increases neuromelanin-related crease SNR and shorten scan times. Given the tilted and
contrast, have led several authors to credit MT as the pri- not perfectly cylindrical nature of the LC, this strategy is
mary source of LC contrast in MRI (Nakane et al., 2008; prone to errors at the most rostral and caudal ends of the
Priovoulos et al., 2018). Recent findings suggest that an structure leading to biases in segmentation and volumetric
interaction of (higher) intracellular water content with measurements (Liu et al., 2017). Alternatively, isotropic ac-
paramagnetic ions (such as neuromelanin) may set the LC quisitions that capture the entire rostrocaudal length of the
apart from its surroundings in MT-weighted imaging LC have also been proposed (Betts et al., 2017; Priovoulos
(Watanabe et al., 2019). Moreover, paramagnetic ions in et al., 2018) and may be more consistent with ex vivo
addition to neuromelanin may contribute to this effect as measurements compared to anisotropic scans (Liu et al.,
structures low in neuromelanin (e.g. periaqueductal grey 2017). While the increased SNR with ultra-high field
matter) demonstrate similar MRI contrast to the LC using MRI (i.e. 5 7.0 T) offers higher attainable spatial resolution
MT-weighted imaging (Cassidy et al., 2019; Watanabe and/or shorter acquisition times, increased specific absorp-
et al., 2019). Despite the different approaches that have tion rates means that higher power acquisitions, e.g. those
successfully visualized the LC (Fig. 1), a precise understand- using MT preparation pulses or high flip angles, might not
ing of the underlying contrast mechanism is thus still lack- be readily available thereby necessitating further optimiza-
ing. As outlined in more detail below, a combination of tion (Priovoulos et al., 2018) (see also Box 2 for recom-
histological and post-mortem imaging studies would pro- mendations on how to use currently available sequences).
vide important insights in this regard. Mechanisms invol-
ving both neuromelanin concentration and macromolecules
in the LC and surrounding tissues may be active simultan-
eously, and a combination of mechanisms may be required
Validating in vivo locus
to explain the contrast patterns seen in normal ageing and coeruleus imaging using
in pathology. A relevant aspect for imaging neuromelanin
is that it is known to scavenge metals both across the life- post-mortem MRI and
span and in disease states (Zecca et al., 2004; Biesemeier
et al., 2016). In vitro studies, albeit with synthetic melanin,
histology
suggest that T1 shortening in the LC may be driven by A key aim of conducting LC imaging in clinical groups is to
compounds of neuromelanin and chelated metals, such as capture in vivo disease-related physiological and structural
iron and copper (Enochs et al., 1989, 1997; Trujillo et al., changes such as reductions in neuronal density. Several val-
2017) impacting the macromolecule-bound pool, rather idation strategies, including a combination of post-mortem
than neuromelanin or iron alone (Langley et al., 2015; magnetic resonance microscopy and histological labelling
Trujillo et al., 2017). It has therefore been proposed that (Forstmann et al., 2017), have thus been proposed to
complexes of neuromelanin-bound paramagnetic ions are shed new light into the underlying biological processes driv-
the primary drivers of LC contrast (Enochs et al., 1989; ing in vivo imaging results. Such approaches, however, are
Nakane et al., 2008; Trujillo et al., 2017); however, neu- also technically challenging. Tissue fixation and embedding
romelanin itself, even free of metals, is paramagnetic media can affect the properties of post-mortem tissue and
(Shima et al., 1997). Indeed, at least in vivo, LC contrast strongly influence the MRI signal (Dusek et al., 2019).
does not seem to benefit from typical iron-sensitive con- Thus, the same tissue properties might be expressed differ-
trasts, such as quantitative susceptibility mapping (QSM) ently in post-mortem and in vivo MRI. For instance, tissue
or apparent R2* (Acosta-Cabronero et al., 2016; Betts fixation causes strong T1 and T2 shortening that is add-
et al., 2016, respectively) (Fig. 1N and R). itionally dependent on the choice of fixative agent and fix-
More recently, MT preparation and/or T1-weighting have ation time (Birkl et al., 2016, 2018). Contrast changes also
been combined, both with short repetition time spoiled gra- arise if the temperature used for post-mortem scanning dif-
dient echo and turbo-flash readouts, to increase spatial fers from 37 C (Birkl et al., 2014). Differences between
resolution and/or shorten the acquisition time compared in vivo and post-mortem tissue could also be driven by
to TSE acquisitions (Chen et al., 2014; Betts et al., 2017; changes in metal oxidation states during fixation or by re-
Hämmerer et al., 2018; Priovoulos et al., 2018). The small distribution of iron and other metals across macromol-
size of the LC has motivated the use of high spatial reso- ecules (e.g. proteins, neuromelanin, etc.) (Shima et al.,
lution, at least in-plane, while high isotropic resolution 1997; Krebs et al., 2014). It should be considered that
minimizes partial volume effects (i.e. inclusion of non-LC iron is bound in brain tissue in different molecular forms
tissue within a putative LC voxel). However, this comes at such as ferritin, neuromelanin, hemosiderin and others,6 | BRAIN 2019: 0; 1–14 M. J. Betts et al.
Downloaded from https://academic.oup.com/brain/advance-article-abstract/doi/10.1093/brain/awz193/5536581 by Deutsches Zentrum fuer Neurodegenerative Erkrankungen user on 22 July 2019
Figure 1 Overview of LC visibility using post-mortem and in vivo MRI. The LC can be imaged in post-mortem tissue using numerous
MRI protocols [arrows indicate the LC, evident as dark spots in T2* (A and G) and bright spots in T1-weighted (E) and MT-weighted (F) scans] in
addition to using histological techniques. (D) The LC is visible as dark spots in a post-mortem slice without any staining, due to neuromelanin
deposits, which are thought to contribute to magnetic resonance visibility of the LC. (C) Myelination in the LC area. The LC and central pontine
grey show very low myelination, but are surrounded by areas with very high and intermediate myelination (green areas), possibly also contributing
to MR visibility of the LC. To image the LC in vivo, T1-weighted (H, O and S) and MT-weighted (I–K) MRI protocols can be used (arrows indicate
the LC, evident as bright spots in T1-weighted and MT-weighted scans). Using these protocols, a decline in LC integrity in Alzheimer’s disease
dementia (S) compared to healthy elderly adults (O) can be identified (Betts et al., 2019). To fine-tune these scan protocols further, it is necessary
to understand the magnetic resonance contrast mechanisms that underlie LC visibility. (L–N and P–R) Quantitative maps which isolate different
magnetic resonance contrast effects (R1, MT and R2* effects), show that LC visibility in T1-weighted as well as MT-weighted scans in vivo is mostly
due to R1 effects (mean LC visibility across 22 healthy older adults extracted from line regions of interest; see inset on right for position of line
regions of interest. Black dots indicate position of maximal signal intensity based on T1-weighted maps. Peaks in signal intensity are apparent in R1
(continued)LC imaging as a biomarker for neurodegeneration BRAIN 2019: 0; 1–14 | 7
Downloaded from https://academic.oup.com/brain/advance-article-abstract/doi/10.1093/brain/awz193/5536581 by Deutsches Zentrum fuer Neurodegenerative Erkrankungen user on 22 July 2019
each having different physico-chemical properties (Ward of released intracellular neuromelanin with the advent of
et al., 2014). Thus, LC contrast observed in vivo using age-related neurodegeneration and onset of disease (Mann
neuromelanin-sensitive MRI at clinical field strength and Yates, 1974). Indeed, post-mortem data suggest that
cannot be easily replicated with post-mortem magnetic res- neuromelanin may be a more suitable indicator of neuronal
onance microscopy at lower temperature (T 4 21 C) and density in older adults (at least 4 55 years) as younger
ultra-high magnetic field strengths (57.0 T). In particular, adults’ LC neurons may not yet be sufficiently pigmented
T2*/R2* measurements of the LC return markedly different with neuromelanin to allow inference on cell numbers in
values in vivo and post-mortem tissue. Whil they often neuromelanin-sensitive MRI (Manaye et al., 1995; Liu
afford the best visibility in post-mortem tissue (Fig. 1A et al., 2019). Nonetheless, further studies are warranted
and G), T2* effects are not evident in individual in vivo to investigate whether higher signal intensities in older
samples and are comparatively weaker than R1 effects in adults invariably represent more intact LC neurons in the
group analyses (Fig.1L–N and P–R). However, by adjusting LC, and whether additional mediating factors for interpret-
acquisition parameters, it is still possible to observe the ing LC-related MRI signals must be considered in different
characteristic T1- and MT-weighted hyperintensity of the age groups or clinical populations. For instance, patho-
LC in in vivo (Fig. 1H–K, O and S) and ex vivo MRI logically altered proteins, such as hyperphosphorylated or
(Fig. 1E and F). To address comparability issues, future aggregated tau, which are well known markers of ageing
post-mortem MRI studies focusing on the LC could com- and neurodegenerative disease as well as non-pathological
bine quantitative T1, T2*, MT and QSM with tight control proteins and lipids, are additional important constituents of
of the post-mortem fixation time and iron and metal neuromelanin pigments (Engelen et al., 2012; Zucca et al.,
concentrations in the fixation solution in order to relate 2018) that accumulate in specific organelles in the LC as
magnetic resonance signal intensities to stereological and occurs in substantia nigra (Zecca et al., 2004; Braak et al.,
quantitative histological measures (e.g. myelin, lipids, neu- 2011; Zucca et al., 2017). However, the effect of these
rons, iron, neuromelanin, copper, and iron- and copper- constituents on LC MRI contrast has not yet been system-
containing proteins). atically explored.
Using a combination of histology and post-mortem MRI
in the LC, a recent study explored whether neuromelanin-
sensitive MRI contrast could serve as a proxy measure of
LC ‘integrity’ (i.e. neuronal density in the LC). The authors
Outlook and conclusion
showed that areas of LC hyperintensity in T1-weighted A major goal of in vivo LC imaging in clinical research is
MRI were co-localized with neuromelanin-rich neurons in to aid differential diagnosis, disease monitoring and strati-
the LC region (Keren et al., 2015), suggesting that LC visi- fication to novel treatments. As such, LC imaging has the
bility in MRI may indeed be driven by the neuromelanin potential to become a component of a precision medicine
content of noradrenergic neurons. Similarly, studies using approach to neurodegenerative diseases. As brain function
neuromelanin-sensitive MRI could show that age-related adapts to ensuing pathology, such as receptor increases in
cross-sectional patterns in in vivo signal intensity across target areas of noradrenergic LC projections or increased
the lifespan (Shibata et al., 2006; Jacobs et al., 2018a; connectivity following a decline in LC function (Herrmann
Liu et al., 2019) replicate the inverted U-shaped cross- et al., 2004; Ye et al., 2015), LC imaging could provide a
sectional development of neuromelanin deposits in the LC stratification tool for predicting treatment success of
observed in post-mortem tissue (Mann and Yates 1974, but pharmacological intervention studies targeting the noradre-
see Ohm et al., 1997; Zecca et al., 2004 for studies report- nergic system (Ye et al., 2015, see also Fig. 2). Once its
ing a stable level of neuromelanin-containing neurons or relationship to pathogenic changes (e.g. -synuclein or tau
linear increase of neuromelanin content in LC tissue aggregation) has been determined, it could also support
across the lifespan, respectively). This inverted U-shaped differential diagnosis and be added to the portfolio of lon-
pattern has been suggested to reflect increasing neuromela- gitudinal monitoring staging tools for neurodegenerative
nin content due to continuous noradrenaline production diseases. Over the next years, we expect substantial pro-
during adulthood prior to ensuing cell death and clearance gress towards these goals through a multidisciplinary
Figure 1 Continued
and to some extent in R2* maps (Hämmerer et al.; 2018a)]. Sequence details/ stains: (A) 7 T T2*-weighted (50 mm resolution) FLASH MRI image
TE = 19 ms; (B) TH staining for LC neurons (dark); (C) Luxol fast blue staining for myelinated fibres in same slice (green); (D) Block face image
after celloidin embedding (LC neurons dark); (E) 7 T T1-weighted (0.2 0.2 2 mm) TSE image (TE/TR/TI = 11/3000/825 ms); (F) 7 T MT-
weighted FLASH MRI image (TE/TR = 5.1/26 ms); (G) 7 T T2*-weighted FLASH image (TE/TR = 21/30 ms) (Otaduy et al., unpublished results);
(H) 3 T T1-weighted (0.4 0.4 3 mm) FLASH image (TE/TR = 3.35–16.95/27) averaged across six repetitions; (I) 3 T MT-weighted
(0.4 0.4 3 mm) FLASH image (TE/TR = 3.35–16.95/30.74); (J) 7 T MT-TFL image (0.4 0.4 0.5 mm); (K) 3 T MT-weighted (1.5 mm3) SPGR
image (TE/TR = 5 ms/30 ms; (O and S) 3 T T1-weighted (0.75 mm3) FLASH image (TE/TR = 5.56 ms/20 ms). Image in J is reproduced with
permission from Priovoulos et al. (2018); O is reproduced with permission from Betts et al. (2017). TE/TR/TI = echo time/repetition time/
inversion time.8 | BRAIN 2019: 0; 1–14 M. J. Betts et al.
Downloaded from https://academic.oup.com/brain/advance-article-abstract/doi/10.1093/brain/awz193/5536581 by Deutsches Zentrum fuer Neurodegenerative Erkrankungen user on 22 July 2019
Box 2 Practical suggestions for in vivo LC imaging
Sequences
The LC is most visible using T1- or MT-weighted structural sequences and can be well characterized using 3 T and 7 T MRI (see Betts et al., 2017;
Priovoulos et al., 2018 and Liu et al., 2017 for a recent review). To date, there is no single ‘best’ sequence for LC imaging: there is a trade-off
between non-quantitative protocols offering easier LC localization, and quantitative magnetic resonance acquisitions that provide more objective
biophysical measures of brain tissue but with lower localization ability compared to dedicated LC sequences.
Voxel size
Owing to the small size of the LC (15 mm in length and 1–3 mm in diameter), larger voxel sizes should be avoided as they result in weaker signals
owing to partial volume effects with tissue outside the LC within the voxel. On the other hand, voxel volumes lower than 0.4–0.5 mm3 run the risk
of lacking sufficient signal-to-noise ratio, given the current sensitivity of neuromelanin-sensitive magnetic resoance sequences. If more accurate LC
volume assessments (with less partial volume contamination) are desired, isotropic voxels sizes are preferable [e.g. 0.75 mm 0.75 mm 0.75 mm are
possible at 3 T (Betts et al., 2017) and 0.4 mm 0.4 mm 0.5 mm at 7 T (Priovoulos et al., 2018)]. These, however, can make identification of individual
LCs harder because of lower signal-to-noise ratio, requiring a group template approach (see below). If reliable identification of individual LCs is
desired but accurate volume assessments are less critical, anisotropic voxel sizes (e.g. 0.5 mm 0.5 mm in plane resolution 2 mm slice thickness)
can be used to exploit the quasi-cylindrical shape of the LC and maximize signal-to-noise ratio at the cost of greater partial volume errors in
peripheral LC voxels (Liu et al., 2017).
Acquisition
It is recommended that the field-of-view is aligned perpendicular to the dorsal edge of the pons such that cylindrical voxels align with the LC.
Motion artefacts
Great care should be taken to reduce head motion during the MRI acquisition. A thin pillow placed on the base of the coil to ensure tight fixation
and patient comfort can help minimize motion and achieve high measurement precision e.g. improving coregistration across/within individuals e.g.
between structural and functional data. Shorter acquisition times which are less prone to motion artefacts can be achieved by using a reduced field-
of-view comprising the brainstem only and by relying on offline-averaging of scans (Chen et al., 2014). Typical scan durations for smaller field-of-view
acquisitions take approximately half the time of whole-brain acquisitions and range between 5 and 9 min at 3 T and 7 T MRI, respectively (Liu et al.,
2017; Priovoulos et al., 2018). However, template-based segmentation approaches (see below) are more challenging with reduced field-of-view
acquisitions than with whole brain scans (but see Dahl et al., 2019).
Post-processing
Semi-automated LC segmentation can be performed through highly iterative co-registration resulting in a high definition group-average template
where the LC can be reliably identified. The resultant template LC region of interest can then be spatially transformed to each individual’s native
space (Betts et al., 2017; Liu et al., 2019). When using template-based approaches however, care must be taken to minimize the impact of
coregistration inaccuracies and additional user intervention might be required. There are at present differing views on whether LC segmentation
should be performed manually or automatically, and on whether LC measurements should encompass the whole structure or favour partial
extraction to avoid potential contamination. Chen et al. (2014) argued that automated segmentation approaches might be less error-prone and
may thus lead to higher consistency across scans and studies, and that visually locating the LC as the highest-intensity voxel at either side of the
fourth ventricle (on the axial plane) might be susceptible to noise-related errors. In contrast, Keren et al. (2009) argued that assessing single voxels
might be more reliable in that it does not rely on boundary definitions or signal intensity thresholding, thereby leading to improved sensitivity to
overall LC differences. To date, however, no study has systematically compared manual and automated methods.
Reference normalization
An important limitation of MRI is that it produces arbitrarily scaled greyscale images that are suboptimal for intersubject comparisons because
normalization to a proximal control region (often the pontine tegmentum) becomes necessary (Betts et al., 2017; Liu et al., 2017; Hämmerer et al.,
2018). However, the reference tissue may also change throughout the lifespan, or be abnormal in neurodegenerative diseases (Keren et al., 2009;
Clewett et al., 2016). Furthermore, asymmetric signal-intensity biases in the LC and surrounding tissue have been reported both in healthy subjects
and Parkinson’s disease patients (Keren et al., 2009; Garcia-Lorenzo et al., 2013; Betts et al., 2017; Tona et al., 2017), in apparent contradiction with
post-mortem studies that show largely symmetric distributions of neuromelanin-pigmented cells in the LC (German et al., 1988; Baker et al., 1989;
Chan-Palay and Asan, 1989; Ohm et al., 1997). It is therefore imperative to avoid instrumental biases such as transmit and receive field inhomo-
geneities, and ensure asymmetries are not introduced by the methodology. To this end, quantitative (parametric) MRI (Weiskopf et al., 2013) has
shown promise by quantifying specific tissue properties in terms of physical units and may now be used for quantitative LC imaging (Fig. 1L–N and
P–R) (Hämmerer et al., 2018a). Moving forward, one may speculate that multi-parametric mapping might be preferred to single-contrast assessments
for a more complete view of LC status and greater insight into underlying contrast mechanisms, especially if performed within the population-
specific time constraints.
Age comparisons and control groups
Owing to an age-related increase in neuromelanin content in LC cells as well as LC signal intensity using neuromelanin-sensitive MRI, LC imaging
may be suboptimal in younger adults, likely due to reduced neuromelanin levels compared to older adults (Zecca et al., 2004, 2006; Liu et al., 2019).
For the same reason, interpreting age differences in LC MRI contrast between young and older adults as age differences in LC integrity may be
problematic. In a large cross-sectional dataset, a decline in LC integrity was only observed at 60 years of age and over (Liu et al., 2019). At present
it is unclear if neuromelanin-sensitive MRI can detect a reduction in LC integrity below this age range. Moreover, within an ageing sample, control
groups must be tightly matched for age to the clinical population under investigation.LC imaging as a biomarker for neurodegeneration BRAIN 2019: 0; 1–14 | 9
Downloaded from https://academic.oup.com/brain/advance-article-abstract/doi/10.1093/brain/awz193/5536581 by Deutsches Zentrum fuer Neurodegenerative Erkrankungen user on 22 July 2019
Figure 2 Establishing LC imaging as a biomarker for noradrenergic dysfunction. LC imaging offers potential as a disease monitoring
and stratification tool to predict the success of novel pharmacological ligands in clinical trials. To achieve this aim, it will be essential to validate
in vivo LC MRI contrast with respect to the concentration of neuromelanin and density of noradrenergic neurons in post-mortem tissue. This will
be important for developing a deeper understanding into how changes in LC MRI contrast both in vivo and in post-mortem tissue correlate with
neuromelanin-bound metals in noradrenergic neurons and is influenced by the neuropathological characteristics of neurodegenerative diseases. In
the clinic, longitudinal LC imaging may be combined with biomarkers (e.g. in CSF or molecular imaging) to assess how changes in LC MRI contrast
may drive clinical and pathological manifestations of neurodegenerative diseases. Source of CSF image: Wikimedia Commons; molecular imaging
figure is adapted from Palmqvist et al. (2017); LC integrity image (middle) adapted with permission from Betts et al. (2017); age effects on LC
integrity image (right) reproduced with permission from Liu et al. (2019).
collaboration of experts in neurodegenerative diseases, ima- imaging to assess how differences in LC synapse density
ging, neuropathology and cognition. relate to LC MRI contrast in neurodegenerative diseases.
As neuromelanin accumulates in the cell bodies of LC Direct and indirect functional measures of LC activity or
neurons, neuromelanin-sensitive MRI can only inform on noradrenaline release can be assessed using high resolution
changes in cell density but not changes in synaptic density functional MRI, pupillometry, PET measures of noradren-
or cell activity. It is known from post-mortem studies that ergic transporter levels (Sommerauer et al., 2018), or by
cell numbers in the LC decline with advancing Alzheimer’s assessing noradrenaline levels in CSF. These measures,
disease pathology (Theofilas et al., 2017). However, prior however, are not short of caveats. PET and functional
to cell loss, changes in synaptic density in the LC and/or MRI measures provide noisy assessments given the small
neuronal activity should be considered. Post-mortem and size of the LC. Moreover, the LC is also know to release
lesion studies suggest that noradrenaline production in re- dopamine and GABA (Kempadoo et al., 2016; Takeuchi
maining LC neurons may increase following degeneration et al., 2016; Breton-Provencher and Sur, 2019), thus dopa-
of LC neurons (for a review see Weinshenker et al., 2018). mine and GABA levels may also need to be assessed in
At present, it is not known whether synaptic density is conjunction with noradrenaline levels when characterizing
altered prior to or in tandem with cell loss in the LC. It LC function. Finally, it can also be difficult interpreting
would be interesting to use novel PET tracers of synaptic functional activation in the LC as an indicator of neuronal
density (Finnema et al., 2016) in combination with LC capacity since activation will not only depend on the10 | BRAIN 2019: 0; 1–14 M. J. Betts et al.
Downloaded from https://academic.oup.com/brain/advance-article-abstract/doi/10.1093/brain/awz193/5536581 by Deutsches Zentrum fuer Neurodegenerative Erkrankungen user on 22 July 2019
number of neurons or synaptic density, but also on the cells in the LC and dopaminergic cells in the substantia
degree in which the LC is engaged during the processing nigra (Zecca et al., 2004; Zucca et al., 2006; Wakamatsu
of the task at hand [i.e. the strength and the nature of the et al., 2015) open further avenues for using in vivo neuro-
experimental manipulation, e.g. as suggested previously by melanin-sensitive MRI to also investigate the involvement
Hämmerer et al. (2018)]. Nonetheless, synaptic density and of the substantia nigra in tandem with the LC in a wide
functional activation may be superior indicators of cogni- range of clinical conditions, i.e. in diseases also affecting
tive impairment than cell pathology (Terry et al., 1991). As the dopaminergic system, such as Parkinson’s disease
the specificity of functional and experimental manipulations (Sulzer et al., 2018).
for the LC increases, these measures may contribute valu- In conclusion, there is rapid progress towards achieving
able additional data on the role of the LC in neurodegen- more sensitive and high-resolution in vivo imaging of the
erative diseases. LC. The methods are non-invasive and fast enough to be
One of the main tasks ahead for LC research lies in well tolerated using high (3 T) or ultra-high (57 T) MRI,
setting up carefully designed longitudinal studies in healthy and can have great potential to inform the effectiveness of
ageing and disease cohorts with deep cognitive and physio- psychopharmacological probes, therapeutic trials, and
logical phenotyping (e.g. the DELCODE study; Jessen physiological monitoring in clinical populations. We antici-
et al., 2018) to assess how LC integrity is related to cog- pate rapid growth in the evidence base for developing LC
nitive symptoms and functional brain changes at the ear- imaging as a biomarker in neurodegenerative diseases.
liest stages of neurodegeneration. Previous work assessing
the reproducibility of LC imaging by quantifying the sta-
bility of LC contrast across two or more independent scan
sessions has revealed moderate to high reproducibility
Funding
(Langley et al., 2017; Tona et al., 2017; Betts et al., M.B. and D.H. were supported by the Human Brain
2017; Dahl et al., 2019). Therefore to achieve reliable lon- Project (SP3 WP 3.3.1) and CRC 779 (Project A7). E.D.
gitudinal testing in the future will require an improvement and D.H. are also supported by the MRC MR/P012698/1.
in the reproducibility and reliability of LC imaging tech- L.Z. and F.A.Z. were supported by the Italian Ministry of
niques. To assess how the LC modulates the function of Education, University,and Research (MIUR) - National
distributed brain networks at rest and during cognitive Research Programme (PNR) - National Research Council
tasks, will require further optimization of existing func- of Italy (CNR) Flagship “InterOmics” Project (PB.P05), by
tional MRI sequences to overcome the challenges of brain- MIUR - PNR - CNR Aging program 2012-2014. L.Z. was
stem imaging (Düzel et al., 2015) and inclusion of also supported by the Grigioni Foundation for Parkinson’s
additional physiological information (see Liu et al., 2017 Disease (Milan, Italy). C.L. is supported by the MRC (MR/
for recommendations). In addition, experimental tasks that R006504/1) and L.P. is supported by the MRC (MR/
elicit robust LC signals require development (Mather et al., P01271X/1). J.R. is supported by the MRC, NIHR,
2016; Liu et al., 2017; Clewett et al., 2018). Wellcome Trust (103838), McDonnell Foundation, AZ-
Second, future studies should test whether LC imaging is Medimmune and Janssen. M.M. is supported by the
related to disease progression in neurodegenerative diseases. German Research Foundation (DFG) priority program PP
This will require characterizing the relationship between LC 2041 (MO 2249/3-1) and the Alzheimer-Forschung-
MRI measures and neuropathology (e.g. with respect to Inititiative e.V., (AFI # 18072). H.J. is supported by a
amyloid, tau or alpha-synuclein using CSF biomarkers or NWO VENI grant [451-14-035], a standard grant of
PET) but also noradrenergic function using noradrenergic Alzheimer Nederland [#15007] and by European Union’s
PET-tracers including those to assess noradrenergic trans- Horizon 2020 Research and Innovation Programme under
porter density (Sommerauer et al., 2018). However, ad- the Marie Sklodowska-Curie Grant agreement [IF-2015-
vances in analysis (to maximize spatial resolution) and GF, 706714]. N.W. received funding from the European
exclusion of potential off-target binding sites (Lee et al., Research Council under the European Union’s Seventh
2018) must accompany ligand development. For optimizing Framework Programme (FP7/2007-2013) / ERC grant
and validating LC MRI further, greater synergy between agreement n 616905, and from the European Union’s
in vivo, post-mortem, in vitro and clinical studies is Horizon 2020 research and innovation programme under
required for a deeper understanding into how LC MRI the grant agreement No 681094, and from the BMBF
contrast relates to the pathophysiology of different neuro- (01EW1711A & B) in the framework of ERA-NET
degenerative diseases (Fig. 2). Such studies will also benefit NEURON. H.R.S. holds a 5-year professorship in precision
from using clinically informed test beds, i.e. populations, medicine at the Faculty of Health Sciences and Medicine,
that show a clear difference in relevant tissue properties, University of Copenhagen, which is sponsored by the
e.g. between young and older adults but also in neurode- Lundbeck Foundation (Grant Nr. R186-2015-2138).
generative diseases, such as Alzheimer’s disease and beyond L.T.G. is funded by NIH R01AG056573, K24AG053435
(Box 1). and the BrightFocus Foundation. R.H. is supported by
Finally, a growing body of knowledge on similarities and the UCLH NIHR Biomedical Research Centre. K.F. is
differences between neuromelanin deposits in noradrenergic supported by the German Research Foundation (DFG)LC imaging as a biomarker for neurodegeneration BRAIN 2019: 0; 1–14 | 11
Downloaded from https://academic.oup.com/brain/advance-article-abstract/doi/10.1093/brain/awz193/5536581 by Deutsches Zentrum fuer Neurodegenerative Erkrankungen user on 22 July 2019
project FL715-1-3. The Wellcome Centre for Human Betts MJ, Ehrenberg AJ, Hämmerer D, Düzel E. Commentary: Locus
Neuroimaging is supported by core funding from the Coeruleus Ablation Exacerbates Cognitive Deficits, Neuropathology,
and Lethality in P301S Tau Transgenic Mice. Front Neurosci 2018;
Wellcome (203147/Z/16/Z). 12: 401.
Biesemeier A, Eibl O, Eswara S, Audinot J-N, Wirtz T, Pezzoli G, et al.
Elemental mapping of Neuromelanin organelles of human
Competing interests Substantia Nigra: correlative ultrastructural and chemical analysis
by analytical transmission electron microscopy and nano-secondary
H.R.S. has received honoraria as speaker from Sanofi ion mass spectrometry. J Neurochem 2016; 138: 339–53.
Genzyme, Denmark and Novartis, Denmark, as a consul- Birkl C, Langkammer C, Golob-Schwarzl N, Leoni M, Haybaeck J,
Goessler W, et al. Effects of formalin fixation and temperature on
tant from Sanofi Genzyme, Denmark and as senior editor MR relaxation times in the human brain: Formalin fixation MR
(NeuroImage) from Elsevier Publishers, Amsterdam, The relaxation mechanisms. NMR Biomed 2016; 29: 458–65.
Netherlands. H.R.S. has also received royalties as book Birkl C, Langkammer C, Haybaeck J, Ernst C, Stollberger R, Fazekas
editor from Springer Publishers, Stuttgart, Germany. The F, et al. Temperature-induced changes of magnetic resonance relax-
Max Planck Institute for Human Cognitive and Brain ation times in the human brain: a postmortem study: temperature
dependency of relaxation times in postmortem brain. Magn Reson
Sciences has an institutional research agreement with Med 2014; 71: 1575–80.
Siemens Healthcare. Birkl C, Soellradl M, Toeglhofer AM, Krassnig S, Leoni M, Pirpamer
L, et al. Effects of concentration and vendor specific composition of
formalin on postmortem MRI of the human brain: formalin and
References postmortem brain MRI. Magn Reson Med 2018; 79: 1111–5.
Braak H, Del Tredici K. Where, when, and in what form does spor-
Acosta-Cabronero J, Betts MJ, Cardenas-Blanco A, Yang S, Nestor PJ. adic Alzheimer’s disease begin? Curr Opin Neurol 2012; 25: 708–
In vivo MRI mapping of brain iron deposition across the adult 14.
lifespan. J Neurosci 2016; 36: 364–74. Braak H, Del Tredici K, Rüb U, de Vos RA, Steur ENJ, Braak E.
Andrés-Benito P, Fernández-Dueñas V, Carmona M, Escobar LA, Staging of brain pathology related to sporadic Parkinson’s disease.
Torrejón-Escribano B, Aso E, et al. Locus coeruleus at asymptomatic Neurobiol Aging 2003; 24: 197–211.
early and middle Braak stages of neurofibrillary tangle pathology. Braak H, Ghebremedhin E, Rüb U, Bratzke H, Del Tredici K. Stages in
Neuropathol Appl Neurobiol 2017; 43: 373–92. the development of Parkinson’s disease-related pathology. Cell
Arendt T, Brückner MK, Morawski M, Jäger C, Gertz H-J. Early Tissue Res 2004; 318: 121–34.
neurone loss in Alzheimer’s disease: cortical or subcortical? Acta Braak H, Thal DR, Ghebremedhin E, Del Tredici K. Stages of the
Neuropathol Commun 2015; 3: 10. pathologic process in Alzheimer disease: age categories from 1 to
Assal F, Cummings JL. Neuropsychiatric symptoms in the dementias. 100 years. J Neuropathol Exp Neurol 2011; 70: 960–9.
Curr Opin Neurol 2002; 15: 445–50. Breton-Provencher V, Sur M. Active control of arousal by a locus
Aston-Jones G, Bloom FE. Activity of norepinephrine-containing locus coeruleus GABAergic circuit. Nat Neurosci 2019; 22: 218–28.
coeruleus neurons in behaving rats anticipates fluctuations in the Brunnström H, Friberg N, Lindberg E, Englund E. Differential degen-
sleep-waking cycle. J Neurosci 1981; 1: 876–86. eration of the locus coeruleus in dementia subtypes. Clin
Aston-Jones G, Cohen JD. An integrative theory of locus coeruleus- Neuropathol 2011; 30: 104–10.
norepinephrine function: adaptive gain and optimal performance. Cassidy CM, Zucca FA, Girgis RR, Baker SC, Weinstein JJ, Sharp
Annu Rev Neurosci 2005; 28: 403–50. ME, et al. Neuromelanin-sensitive MRI as a noninvasive proxy
Baker KG, Törk I, Hornung J-P, Halasz P. The human locus coeruleus measure of dopamine function in the human brain. Proc Natl
complex: an immunohistochemical and three dimensional recon- Acad Sci 2019; 116: 5108–17.
struction study. Exp Brain Res 1989; 77: 257–70. Chalermpalanupap T, Schroeder JP, Rorabaugh JM, Liles LC, Lah JJ,
Benarroch EE. The locus ceruleus norepinephrine system Functional Levey AI, et al. Locus coeruleus ablation exacerbates cognitive def-
organization and potential clinical significance. Neurology 2009; icits, neuropathology, and lethality in P301S tau transgenic mice.
73: 1699–704. J Neurosci 2017: 1483–17.
Benarroch EE, Schmeichel AM, Low PA, Sandroni P, Parisi JE. Loss of Chan-Palay V, Asan E. Alterations in catecholamine neurons of the
A5 noradrenergic neurons in multiple system atrophy. Acta locus coeruleus in senile dementia of the Alzheimer type and in
Neuropathol (Berl) 2008; 115: 629–34. Parkinson’s disease with and without dementia and depression.
Bernard R, Kerman IA, Thompson RC, Jones EG, Bunney WE, J Comp Neurol 1989; 287: 373–92.
Barchas JD, et al. Altered expression of glutamate signaling, Chen X, Huddleston DE, Langley J, Ahn S, Barnum CJ, Factor SA,
growth factor and glia genes in the locus coeruleus of patients et al. Simultaneous imaging of locus coeruleus and substantia nigra
with major depression. Mol Psychiatry 2011; 16: 634–46. with a quantitative neuromelanin MRI approach. Magn Reson
Berridge CW, Waterhouse BD. The locus coeruleus–noradrenergic Imaging 2014; 32: 1301–6.
system: modulation of behavioral state and state-dependent cogni- Clewett DV, Huang R, Velasco R, Lee T-H, Mather M. Locus coer-
tive processes. Brain Res Rev 2003; 42: 33–84. uleus activity strengthens prioritized memories under arousal.
Betts MJ, Acosta-Cabronero J, Cardenas-Blanco A, Nestor PJ, Düzel J Neurosci 2018; 38: 1558–74.
E. High-resolution characterisation of the aging brain using simul- Clewett DV, Lee T-H, Greening S, Ponzio A, Margalit E, Mather M.
taneous quantitative susceptibility mapping (QSM) and R2* meas- Neuromelanin marks the spot: identifying a locus coeruleus bio-
urements at 7 T. NeuroImage 2016; 138: 43–63. marker of cognitive reserve in healthy aging. Neurobiol Aging
Betts MJ, Cardenas-Blanco A, Kanowski M, Jessen F, Düzel E. In vivo 2016; 37: 117–26.
MRI assessment of the human locus coeruleus along its rostrocaudal Dahl MJ, Mather M, Düzel S, Bodammer NC, Lindenberger U, Kühn
extent in young and older adults. NeuroImage 2017; 163: 150–59. S, et al. Locus coeruleus integrity preserves memory performance
Betts MJ, Cardenas-Blanco A, Kanowski M, Spottke A, Teipel SJ, across the adult life span. bioRxiv 2019. https://www.biorxiv.org/
Kilimann I, et al. Locus coeruleus MRI contrast is reduced in content/10.1101/332098v3.
Alzheimer’s disease dementia and correlates with CSF Ab levels. Dickson DW, Fujishiro H, DelleDonne A, Menke J, Ahmed Z, Klos
Alzheimers Dement Diagn Assess Dis Monit 2019; 11: 281–5. KJ, et al. Evidence that incidental Lewy body disease is pre-You can also read