MTA 2022 Preliminary Budget - July Financial Plan 2022-2025 - Volume 1 July 2021
←
→
Page content transcription
If your browser does not render page correctly, please read the page content below
MTA 2022
Preliminary Budget
 July Financial Plan 2022-2025

            Volume 1
            July 2021
OVERVIEW

                      MTA 2022 Preliminary Budget
                      July Financial Plan 2022-2025
                                Volume 1

The MTA’s July Plan is divided into two volumes:

Volume 1 consists of financial schedules supporting the complete MTA-
Consolidated Financial Plan, including an Executive Summary, the baseline
forecast (as detailed in Volume 2 and described below) and certain adjustments
captured below the baseline. These “below-the-line” adjustments include:
Fare/Toll Increases, Policy Actions, and any MTA Efficiencies and Re-estimates.
Volume 1 also includes descriptions of the “below-the-line” actions as well as the
required Certification by the Chairman/CEO, and a description of the MTA
Budget Process.

Volume 2 includes MTA-Consolidated detailed financial and position schedules
as well as the narratives that support the baseline projections included in the
2022 Preliminary Budget and the Financial Plan for 2022 through 2025. Also
included are the Agency sections which incorporate descriptions of Agency
Programs with supporting baseline tables and required information related to the
MTA Capital Program.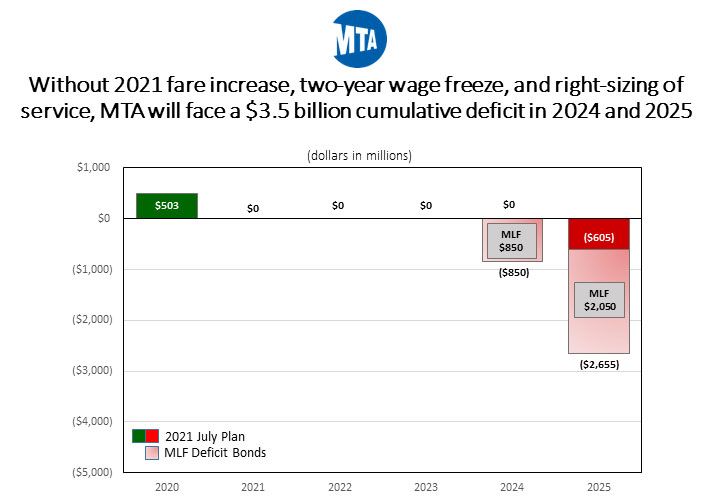
TABLE OF CONTENTS
                                               VOLUME 1

l.     Introduction

         Executive Summary……………………………………………………………………. I-1

ll.    MTA Consolidated Financial Plan

         Where the Dollars Come From and Where the Dollars Go………………………..                                                   II-1
         Financial Plan: Statement of Operations……………………………………………                                                          II-2
         Financial Plan: Cash Receipts and Expenditures………………………………….                                                      II-4
         Reconciliation to Prior Plan...................................................................................   II-5
         Consolidated Subsidies Cash………………………………………………………....                                                              II-7
         Debt Service Affordability Statement after Below-the-Line Adjustments………....                                      II-10

lII.   Plan Adjustments

         Fare/Toll Increases…………………………………………………………………….. III-1
         Management and Policy Actions …………………………………………………….. III-3
         Re-estimates and Other……………………………………………………………….. III-3

IV.    Appendix

         Chairman and Chief Executive Officer Certification…………………………………                                                   IV-1

V.     Other

         The MTA Budget Process…………………………………………………………....... V-1
l. Introduction
Executive Summary

The 2021 MTA July Financial Plan (the “July Plan” or “Plan”), which includes the 2021 Mid-
Year Forecast, the 2022 Preliminary Budget and a Financial Plan for the years 2022 to 2025,
updates the February Financial Plan. Since 2010, MTA financial plans – developed in a
disciplined, consistent, and transparent process – have included the impact of our
continuous pursuit of operational efficiencies and recurring cost reductions which have been
used to temper the amount of revenues needed from biennial fare and toll increases and
governmental subsidies, and have provided funding for the capital program and enhanced
maintenance. When sustainable, Plans have reflected added service, while at the same
time addressing long-term costs such as pensions, health care, paratransit, and debt
service.

This Plan, however, as with all plans beginning with the 2020 July Plan, reflects the impact the
novel coronavirus outbreak and the ensuing pandemic has had on the MTA Region, forcing
the MTA to focus on financial survival while at the same time providing service needed to keep
the region moving during the height of the pandemic, during this late-pandemic period, and
eventually under a post-pandemic “new normal”.

The February Plan

The February Plan projected a cash balance of $5 million in 2021, with deficits of $3,129
million in 2022, $2,441 million in 2023, and $2,403 million in 2024, resulting in a cumulative
deficit of $7.972 billion. Incorporated in these figures were assumptions of ridership and traffic
recovery from the pandemic based on the “worst case” scenario for ridership and the midpoint
of the “best case” and “worst case” scenarios for traffic that were developed for the MTA by
McKinsey & Co. Also included were 4 percent yield increases from fare and toll rate changes
proposed for 2021 and 2023, subject to MTA Board approval.

The February Plan included actions to help reduce deficits the MTA is facing. The 2019 General
Reserve of $165 million and the 2020 General Reserve of $170 million were unexpended and
reserved for use in 2021. Annual Committed to Capital transfers, operating funds earmarked
for capital use, were suspended through 2023, retaining in the operating budget $187 million in
2020, $181 million in 2021, $120 million in 2022 and $114 million in 2023. The Mansion Tax
and the Internet Marketplace Tax, “lockbox” funds restricted for capital, were redirected to the
operating budget, as permitted through 2021 under Public Authorities Law 553-j: $440 million
was used in 2020, with another $525 million budgeted in 2021.

Agency-identified savings in overtime, consulting services and other non-personnel
expenses were expected to total $570 million in 2021, $473 million in 2022, $442 million in
2023, and $448 million in 2024. The February Plan included the aligning of service with
ridership levels, with service reductions of 40% percent for the subway and bus systems and
50% for the commuter railroads, which could accommodate anticipated ridership levels in
2022 and yield savings of $1.27 billion through 2024. Accompanying the service reductions
would be workforce impacts estimated to be 9,367 positions. The proposed service reductions
focused on achieving significant cost reductions, mitigating negative customer impacts, and
providing service responsive to current and projected ridership. Service would be restored
as ridership levels improve, and savings would be $696 million in 2023 and $559 million in
2024. The MTA also proposed a

                                                I-1
permanent wage freeze for all employees, both represented and non-represented, through 2022
which would save $309 million in 2022, $315 million in 2023 and $322 million in 2024.
To cover the budget deficits, the MTA was granted the authority by the 2020-2021 State Enacted
Budget to borrow up to $10 billion in deficit financing through December 2022. The MTA utilized
the Federal Reserve’s Municipal Liquidity Facility (“MLF”), which was established as a source of
emergency financing for state and local governments and public entities to ensure their access to
credit during the COVID pandemic, to borrow the maximum $2.9 billion allowed the MTA under
the program before the lending window closed at the end of 2020. The February Plan anticipated
using $1.65 billion in 2021 in MLF deficit financing proceeds, with the remaining $1.25 billion to
be used in 2022. The MTA expects to issue long-term bonds in 2023 to repay the MLF loan.
The February Plan also assumed reimbursement from the Federal Emergency Management
Agency (“FEMA”) for the estimated $293 million in direct COVID-related expenses incurred from
the start of the pandemic through the end of August 2020, the cut-off date originally established
by FEMA. FEMA typically reimburses 75% of local claim amounts, with the remaining portion
covered by the State; however, with the State experiencing fiscal stress, MTA expects to receive
$220 million in 2021, assuming the remaining 25% will not be received.
The Coronavirus Response and Relief Supplemental Appropriations Act (CRRSAA) was signed
into law on December 27, 2020, and analysis of the statute’s provisions indicate MTA will receive
$4.0 billion in new Federal aid, which was included in the February Plan. At the time the February
Plan was presented, the American Rescue Plan had yet to be enacted, but MTA was hopeful it
would provide the funding to help close the projected budget gap.
However, even with the $2.9 billion in deficit bonding, the $4 billion in CRRSAA Federal Aid, the
assumed service reductions and permanent wage freeze, the MTA was still projecting a
cumulative deficit of nearly $8 billion through 2024.
I-2The July Plan
The first significant financial development since the February Plan was the March 11, 2021
signing into law by President Biden of the American Rescue Plan Act of 2021 (ARPA). The $1.9
trillion package is intended to combat the COVID-19 pandemic, including public health and
economic impacts. While funding has yet to come to the MTA, it is estimated the MTA will receive
about $6.5 billion from ARPA, and this is incorporated into the July Plan.
The second significant development has been the impact of COVID-19 vaccinations on the MTA
region. Capacity restrictions on restaurants, bars, event venues and businesses put in place due
to COVID were mostly removed on May 19, 2021, and all remaining restrictions were eliminated
on June 15 after the state reached its goal of 70% of adults getting at least a first dose of the
vaccine. New York City public schools are scheduled to be open for full in-person instruction in
the Fall. MTA continues to adjust service levels as it moves into the late-pandemic period and
ridership levels continue to show improvement, although ridership remains significantly below pre-
pandemic levels. New York City Subway resumed 24 hours a day service on May 17, 2021, after
subway service was shut down overnight for over a year to allow for a thorough disinfecting of the
system. The Long Island Rail Road currently operates on an 83% pre-pandemic service level.
MNR currently operates on a 67% pre-pandemic service level but will be restoring service on
August 29, 2021 to 83% during the week and 70% on weekends relative to pre pandemic levels.
In the February Plan, ridership was based on the “worst case” scenario developed for the MTA
by McKinsey & Co., while vehicular traffic at B&T facilities was based on the midpoint between
McKinsey’s “best case” and “worst case” scenarios. Since the beginning of 2021, consolidated
MTA ridership has been tracking consistent with the midpoint between the McKinsey scenarios,
while B&T vehicular traffic has been consistently close to the McKinsey “best case” scenario as
restrictions were eased and removed. These factors have led MTA to revise utilization projections
for the July Plan: B&T utilization is now based on the McKinsey “best case” scenario, and
ridership, with the exception of SIR ridership, is based on the midpoint of the McKinsey scenarios.
SIR ridership continues to lag and is being projected under the “worst case” scenario. This
anticipated improvement results in $3.7 billion in additional farebox revenue and $799 million in
additional toll revenue through 2024 when compared with the February Plan. Despite these
positive developments, ridership remains below pre-pandemic levels and McKinsey anticipates a
“new normal” ridership level of between 82% and 91% of pre-pandemic levels, the result of
continuation of hybrid work schedules, with fewer days per week traveling to an office location,
increased online shopping at the expense of brick and mortar locations, slower return of tourism,
and increases in alternative travel, such as walking and bicycling.
The increases in ridership and traffic recovery also favorably impact, by $153 million through
2024, the estimated farebox and toll revenue generated from the proposed 2021 fare increase
and from the 2023 fare and toll increases. Additionally, the 2021 toll increase that went into effect
in mid-April increased toll rates by 6 percent, above the four percent assumed in the February
Plan, and is expected to generate about $175 million over the February Plan estimate.
In addition to farebox and toll revenue, Agency re-estimates include $268 million in “New
Needs” expenses, partially offset by an increase of $94 million from savings programs. Other
Agency re-estimates are $71 million unfavorable compared with the February.
State and local subsidy and dedicated tax receipts also have improved, with revenue $1.4 billion
higher through 2024 compared with the February Plan. However, the impact on the operating
budget is less, as Capital Lockbox revenues, including the Mansion Tax and the Internet
I-3Marketplace Tax, are being redirected back to provide support for the Capital Program, reducing
overall subsides available to cover the operating budget by $515 million.
Committed to Capital support (“PAYGO”) through 2023, which was pulled back at the start of the
pandemic, is also being restored, by $367 million in 2021, $120 million in 2022 and $144 million
in 2023.
Debt service expenses are favorable compared with the February Plan by $293 million, reflecting
the use of highly rated Payroll Mobility Tax (PMT) bonds versus Transportation Revenue Bonds
(TRB), lower interest rates in general, and Federal operating support to MTA alleviating near term
deficits. The coverage period for reimbursement of COVID-related expenses from the Federal
Emergency Management Agency (FEMA) was extended from September 2020 to September
2021, and MTA estimates its additional reimbursement from claims during this extended period
will come to $140 million, which is expected to be realized in 2022.
These changes result in a cumulative Plan deficit of $10.0 billion. ARPA Federal Aid, the deferred
2021 fare increase, the use of $1.3 billion of proceeds from MLF deficit bonds, the assumed “right-
sizing” service reductions and a two-year wage freeze, however, result in financial balance
through the Plan period.
As indicated in the chart above, the July Plan relies not only on federal aid and deficit financing
to close the budget gaps, but three significant policy choices available to the MTA at the direction
of the Board: a fare increase in 2021, the “right-sizing” of service, and implementation of a two-
year wage freeze.
American Rescue Plan Act (ARPA) Federal Aid. With the enactment of ARPA, MTA expects
to receive about $6.5 billion in additional federal aid, in addition to the $4 billion from the CARES
Act and $4 billion from CRRSAA, which are already included in the Financial Plan.
I-42021 Fare Increase. A four percent increase in farebox revenue derived from a fare rate increase
was originally proposed for implementation in March 2021, but a decision was deferred by the
MTA Board. The July Plan proposes a similar increase for implementation in November. Should
the fare increase not be implemented, $819 million in anticipated revenue over the Plan period
would not be available to cover expenses.
Service Reductions. In the February Plan, the MTA had proposed service reductions to align
with the post-pandemic “new normal” ridership levels based on the McKinsey “worst case”
scenario. The proposed service reductions focused on achieving significant cost reductions,
mitigating negative customer impacts, and providing service in response to current and projected
ridership. Service would be restored as ridership levels improve, and savings would be $696
million in 2023 and $559 million in 2024. With ridership trending on a path consistent with the
midpoint between the McKinsey “best case” and “worst case” scenarios, service reductions have
been scaled back and the accompanying expense savings is reduced to $220 million in 2023 and
$206 million in 2024 and 2025.
Two-Year Wage Freeze. In the February Plan, the MTA had proposed a wage freeze through
2022 for all employees, both represented and non-represented, saving an estimated $309 million
in 2022, $315 million in 2023 and $322 million in 2024. With the arrival of ARPA Federal Aid, this
proposed action has been revised. The TWU Local 100 contract, a four-year contract that runs
from mid-May 2019 through mid-May 2022, will be fully honored, as will all other settled contracts.
Bargaining units that typically follow the TWU pattern settlements have either entered into two-
year agreements similar to the first two years of the current TWU contract or are assumed to do
so, and those two-year contract costs are reflected in the July Plan, but followed by a “pause”
until the MTA’s financial picture better comes into focus. Non-represented employees also would
not have wage increases for two years, in 2021 and 2022. Revised savings from this policy action
are estimated to be $171 million in 2022, $174 million in 2023, $191 million in 2024 and $198
million in 2025.
Proceeds of MLF Deficit Bonding. To cover the budget deficits, the MTA was granted the
authority by the 2020-2021 State Enacted Budget to borrow up to $10 billion in deficit financing
through December 2022. The MTA utilized the Federal Reserve’s Municipal Liquidity Facility
(“MLF”), which the Federal Reserve established as a source of emergency financing for state and
local governments and public entities to ensure they have access to credit during the COVID
pandemic, to borrow the maximum $2.9 billion allowed the MTA under the program before the
lending window closed at the end of 2020. The MLF loan is due for repayment in 2023, and the
MTA expects to issue long-term bonds in 2023 to repay the Federal Reserve. In the February
Plan, it was anticipated the MTA would use $1.65 billion of MLF deficit financing proceeds in 2021,
and the remaining $1.25 billion in 2022. The July Plan, with the infusion of the $6.5 billion
in federal aid from ARPA, $819 million from the proposed 2021 fare increase, and savings of
$632 million and $734 million from the Service Reductions and Two-Year Wage Freeze,
respectively, can delay using the proceeds of MLF deficit bonding until 2025, and when $1.3
billion would be needed to close the 2025 deficit.
I-5Should the assumed policy actions not be implemented, ARPA federal aid would need to be used
earlier in the Plan period, all $2.9 billion of proceeds of MLF deficit bonding would be used, and
a deficit of $605 million would remain in 2025.
I-6This would leave the MTA facing a $3.5 billion cumulative deficit in 2024 and 2025.
The “Bottom Line”
In total, the cumulative impact of the changes since the February Plan is a balanced budget
through 2025. But as noted above, despite the receipt of an additional $6.5 billion in federal aid
from ARPA, the July Plan is only balanced assuming the 2021 fare increase is implemented,
service is right-sized, and a two-year wage freeze is implemented. And those assumed actions
alone will not completely cover the deficit during the Plan period: the use of $1.3 billion in MLF
deficit bonding proceeds is needed to close the 2025 deficit.
Risks to MTA’s Financial Future
The MTA faces many challenges as it works to improve its financial future:
Continued aggressive cost cutting. The MTA must remain focused on existing cost control
efforts to avoid “backsliding”. Further savings must be identified to create the financial flexibility
necessary to cover the cost of long-term deficit financing. Remaining transformation savings
actions still must be identified, or the July Plan would worsen by $619 million over the Plan period.
Implementation of biennial fare and toll increases (2021, 2023, 2025). While the MTA works
diligently to control costs, the reality is that combined fares and tolls only cover approximately half
of operating costs (“Farebox Operating Ratio”) and a little more than a third of total expenses,
I-7including capital costs (“Farebox Recovery Ratio”). Moreover, many costs are dependent on
pricing factors outside MTA’s direct control (e.g., energy, health & welfare and pensions)
and many costs are increasing at a rate above the assumed annual increase in fares and
tolls of approximately 2 percent. Over the Plan period, the February Plan assumes a
combined $1.9 billion in additional fare and toll revenue from the projected 2021 fare
increase and from the projected 2023 and 2025 fare and toll increases.
Achieving affordable wage settlements. The MTA is committed to honoring the terms of its
existing contracts. The proposed two-year wage freeze essentially pauses wage increases for the
represented workers who have followed the TWU Local 100 contract in the past while
MTA determines its financial capacity to negotiate affordable wage settlements with its unions.
Aligning Service to “new normal” ridership levels. McKinsey projects that the MTA’s overall
ridership may only recover to 82% to 91% of the pre-pandemic level by the mid-2020s, a
projection that considers changes in travel behavior as more employers allow their staffs to work
remotely, increasing work from home from between one and three days a week, on average, from
the pre-pandemic average of a half-day per week, driving down commutation ridership; non-work
trips are expected to decline due to reductions in retail and leisure trips. Mode shifts, to automobile
and other forms of travel—primarily bicycle and walking for shorter trips—are expected to further
reduce overall ridership. The challenge facing the MTA is not only to provide the level of service
to match the current needs of customers, but also to introduce the appropriate level of service as
ridership returns. Simply returning to pre-pandemic service structure and service levels, without
appropriately matching service with “new normal” demand, will continue the unsustainable
structural fiscal imbalances that must be addressed and corrected.
Clearly, if ridership and traffic exceed the forecasts in the July Plan, the financial forecast
will be more favorable, assumed policy actions in the July Plan may not be necessary and
appropriate actions can be considered in subsequent Financial Plans.
I-8Il. MTA Consolidated Financial Plan
MTA 2022 Preliminary Budget
Baseline Revenues and Expenses After Below-the-Line (BTL) Adjustments
Non-Reimbursable
Where the Dollars Come From …
Other
1%
Other Funding FEMA/ARPA By Revenue Source
Agreements 14% ($ in millions)
5% Farebox
Farebox Revenue $5,044
State & Revenue
Local 28% Toll Revenue 2,257
Subsidies Other Revenue 764
3% Taxes 6,092
Toll
Taxes
Revenue State and Local 559
33%
13% Other Funding Agreements 955
Other 1 (34)
Other Proceeds from MLF 0
Revenue ARPA/FEMA 2,632
4% 2
Total $18,270
Where the Dollars Go …
By Expense Category
By MTA Agency
MTA Gen'l Res
& Adj.
Debt Service 1%
17% NYCT/SIR
Payroll
30% 51%
Debt Service
17%
Non-Labor +
Other Exp Adj
24%
Health & B&T
3% LIRR
Pension Welfare MNR
Overtime 10%
8% 13% 8%
5% HQ/
FMTAC/
Other Labor C&D
MTA Bus
3% 5%
5%
By Expense Category 3 By MTA Agency 3
includes below-the-line adjustments includes below-the-line adjustments
($ in millions) ($ in millions)
Payroll $5,604 NYCT/SIR $9,320
Overtime 893 LIRR 1,881
Health & Welfare 2,354 MNR 1,376
Pension 1,451 MTABC 928
Other Labor 555 HQ/FMTAC/C&D 1,017
Total Labor $10,857 B&T 549
Non-Labor + Other Exp Adj 4,394 Debt Service 3,065
Debt Service 3,065 MTA Gen'l Res & Adjs 180
BTL Adjustments for Expenses 4 (46) BTL Adjustments for Expenses 4 (46)
Total 2 $18,270 Total 2 $18,270
1
Includes cash adjustments and prior-year carryover.
2
Totals may not add due to rounding.
3
Expenses exclude Depreciation, GASB 75 OPEB Adjustment, GASB 68 Pension Adjustment and Environmental Remediation.
4
In the pie chart "By Expense Category," the below-the-line adjustments cannot be segmented by Expense Category. The pie slice
reflects the total adjustments to expenses that are being proposed in this Plan.
In the pie chart "By MTA Agency," the below-the-line adjustments cannot be segmented by Agency . The pie slice
reflects the total adjustments to expenses that are being proposed in this Plan.
Note: The revenues and expenses reflected in these charts are on an accrued basis.
II-1METROPOLITAN TRANSPORTATION AUTHORITY
July Financial Plan 2022 - 2025
MTA Consolidated Accrued Statement of Operations By Category
($ in millions)
Mid-Year Preliminary
Actual Forecast Budget
2020 2021 2022 2023 2024 2025
Non-Reimbursable
Operating Revenues
Farebox Revenue $2,623 $2,826 $4,859 $5,398 $5,483 $5,478
Toll Revenue 1,640 2,140 2,257 2,268 2,274 2,295
Other Revenue 4,571 669 764 826 857 875
Capital and Other Reimbursements 0 0 0 0 0 0
Total Revenues $8,835 $5,635 $7,881 $8,492 $8,614 $8,649
Operating Expenses
Labor:
Payroll $5,306 $5,363 $5,604 $5,709 $5,855 $5,997
Overtime 910 986 893 912 931 950
Health and Welfare 1,304 1,430 1,551 1,647 1,753 1,868
OPEB Current Payments 633 741 803 873 947 1,029
Pension 1,510 1,445 1,451 1,470 1,472 1,503
Other Fringe Benefits 790 938 980 1,019 1,053 1,090
Reimbursable Overhead (380) (425) (425) (416) (422) (425)
Total Labor Expenses $10,072 $10,478 $10,857 $11,214 $11,591 $12,012
Non-Labor:
Electric Power $385 $424 $471 $484 $497 $510
Fuel 103 170 173 170 169 225
Insurance (5) 32 61 98 118 148
Claims 237 353 436 444 454 468
Paratransit Service Contracts 326 396 519 553 588 625
Maintenance and Other Operating Contracts 772 901 975 997 999 1,028
Professional Services Contracts 447 703 621 572 590 602
Materials and Supplies 543 644 733 717 724 740
Other Business Expenses 152 179 199 219 221 231
Total Non-Labor Expenses $2,960 $3,802 $4,188 $4,255 $4,361 $4,578
Other Expense Adjustments:
Other $80 $37 $26 $28 $23 $24
General Reserve 335 170 180 190 195 200
Total Other Expense Adjustments $415 $207 $206 $218 $218 $224
Total Expenses Before Non-Cash Liability Adjs. $13,447 $14,487 $15,251 $15,687 $16,169 $16,814
Depreciation $3,010 $3,126 $3,142 $3,207 $3,255 $3,304
GASB 75 OPEB Expense Adjustment 886 1,576 1,619 1,665 1,702 1,739
GASB 68 Pension Expense Adjustment (65) 7 51 75 (24) 21
Environmental Remediation 122 6 6 6 6 6
Total Expenses After Non-Cash Liability Adjs. $17,401 $19,203 $20,069 $20,640 $21,108 $21,884
Conversion to Cash Basis: Non-Cash Liability Adjs. ($3,954) ($4,716) ($4,817) ($4,953) ($4,939) ($5,071)
Debt Service (excludes Service Contract Bonds) 2,703 2,843 3,065 3,514 3,560 3,614
Total Expenses with Debt Service $16,151 $17,330 $18,317 $19,201 $19,729 $20,428
Dedicated Taxes & State and Local Subsidies $6,686 $7,744 $7,613 $7,930 $8,156 $8,400
Net Surplus/(Deficit) After Subsidies and Debt Service ($629) ($3,952) ($2,823) ($2,779) ($2,960) ($3,379)
Conversion to Cash Basis: GASB Account $0 $0 $0 $0 $0 $0
Conversion to Cash Basis: All Other 648 (862) (34) 280 207 43
Cash Balance Before Prior-Year Carryover $18 ($4,814) ($2,857) ($2,499) ($2,752) ($3,337)
Below the Line Adjustments $0 $4,311 $2,857 $2,499 $2,752 $3,337
Prior Year Carryover Balance 485 503 0 0 0 0
Net Cash Balance $503 $0 $0 $0 $0 $0
II-2METROPOLITAN TRANSPORTATION AUTHORITY
July Financial Plan 2022-2025
Plan Adjustments
($ in millions)
Mid-Year Preliminary
Actual Forecast Budget Plan Plan
2020 2021 2022 2023 2024 2025
Cash Balance Before Prior-Year Carry-over $18 ($4,814) ($2,857) ($2,499) ($2,752) ($3,337)
Fare/Toll Increases:
Fare Increase in November 2021 (4% Yield) $18 $184 $205 $209 $208
Fare/Toll Increase in March 2023 (4% Yield) - - 261 310 311
Fare/Toll Increase in March 2025 (4% Yield) - - - - 276
Subsidy Impacts of 2021, 2023 and 2025 Fare/Toll Increases (1) (6) (21) (17) (31)
Subtotal $17 $179 $445 $501 $764
MTA Initiatives:
MTA Transformation Savings - Not Yet Identified 25 146 151 148 148
Subtotal $25 $146 $151 $148 $148
Management and Policy Actions:
Service Reductions - - $220 $206 $206
Two-Year Freeze (Rep/Non-Rep through 2022)
1 - 171 174 191 198
Subtotal $0 $171 $394 $397 $404
MTA Re-estimates:
East-Side Access $31 $(7) $(58) $(75) $(60)
Headquarters Call Center (3) (0) 1 2 4
State Aid for the 2015-19 Capital Program - 37 38 38 38
Repayment of Revolving Bank Line of Credit - (300) - - -
Subtotal $28 ($271) ($19) ($35) ($18)
Other:
FEMA Reimbursement $220 $140 - - -
CRRSAA Federal Aid 4,000 - - - -
ARPA Federal Aid 22 2,492 1,527 1,740 719
Proceeds of MLF Deficit Bonding - - - - 1,319
Subtotal $4,242 $2,632 $1,527 $1,740 $2,038
TOTAL ADJUSTMENTS $4,311 $2,857 $2,499 $2,752 $3,337
Prior-Year Carry-Over 485 503 0 0 0 0
Net Cash Surplus/(Deficit) $503 $0 $0 $0 $0 $0
1
TWU Local 100 contract, and all other existing contracts, honored. Assumes contracts for all other pattern-following bargaining units conform to the first
two years of the TWU Local 100 contract, followed by two years of a wage freeze.
II-3METROPOLITAN TRANSPORTATION AUTHORITY
July Financial Plan 2022 - 2025
Cash Receipts and Expenditures
($ in millions)
Mid-Year Preliminary
Actual Forecast Budget
2020 2021 2022 2023 2024 2025
Cash Receipts and Expenditures
Receipts
Farebox Revenue $2,575 $2,828 $4,860 $5,397 $5,482 $5,478
Other Revenue 4,569 707 784 847 879 898
Capital and Other Reimbursements 1,931 2,257 2,069 1,994 2,019 2,037
Total Receipts $9,075 $5,792 $7,713 $8,239 $8,380 $8,412
Expenditures
Labor:
Payroll $5,793 $5,971 $6,156 $6,217 $6,372 $6,668
Overtime 1,107 1,201 1,086 1,087 1,107 1,130
Health and Welfare 1,355 1,487 1,605 1,693 1,800 1,916
OPEB Current Payments 625 730 797 866 941 1,022
Pension 1,537 1,513 1,515 1,522 1,523 1,555
Other Fringe Benefits 547 1,237 1,127 1,016 1,047 1,091
Contribution to GASB Fund 0 0 0 0 0 0
Reimbursable Overhead 0 (5) (5) (5) (5) (5)
Total Labor Expenditures $10,963 $12,134 $12,280 $12,396 $12,786 $13,376
Non-Labor:
Electric Power $404 $434 $480 $493 $505 $518
Fuel 112 162 171 168 167 223
Insurance 29 13 70 92 119 153
Claims 240 277 294 300 308 320
Paratransit Service Contracts 344 394 517 551 586 623
Maintenance and Other Operating Contracts 700 871 906 918 924 929
Professional Services Contracts 543 807 651 577 583 614
Materials and Supplies 772 789 870 841 846 862
Other Business Expenses 153 167 178 192 206 223
Total Non-Labor Expenditures $3,297 $3,913 $4,136 $4,132 $4,244 $4,465
Other Expenditure Adjustments:
Other $147 $203 $105 $97 $106 $113
General Reserve 335 170 180 190 195 200
Total Other Expenditure Adjustments $482 $373 $285 $287 $301 $313
Total Expenditures $14,742 $16,421 $16,702 $16,816 $17,331 $18,154
Net Cash Balance before Subsidies and Debt Service ($5,668) ($10,628) ($8,989) ($8,577) ($8,950) ($9,742)
Dedicated Taxes & State and Local Subsidies $7,714 $7,930 $8,461 $8,741 $8,898 $9,093
Debt Service (excludes Service Contract Bonds) (2,028) (2,116) (2,328) (2,663) (2,700) (2,688)
Cash Balance Before Prior-Year Carryover $18 ($4,814) ($2,857) ($2,499) ($2,752) ($3,337)
Adjustments $0 $4,311 $2,857 $2,499 $2,752 $3,337
Prior-Year Carryover Balance 485 503 0 0 0 0
Net Cash Balance $503 $0 $0 $0 $0 $0
II-4METROPOLITAN TRANSPORTATION AUTHORITY
July Financial Plan 2022-2025
MTA Consolidated July Financial Plan Compared with February Financial Plan
Cash Reconciliation after Below-the-Line Adjustments
($ in millions)
Favorable/(Unfavorable)
2021 2022 2023 2024
FEBRUARY FINANCIAL PLAN 2021-2024
NET CASH SURPLUS/(DEFICIT)
$5 ($3,129) ($2,441) ($2,403)
Agency Baseline Re-estimates $1,585 $1,637 $1,126 $648
Revenue
Farebox Revenue 1 1,077 1,399 831 395
Toll Revenue 1 645 154 - -
April 2021 6% Increase in Toll Revenue 99 141 141 144
Rates & Related Assumptions 2 156 135 113 110
COVID Impacts (Revenue and Expenditures) (2) 21 55 (18)
Timing (including 2020) (294) (179) (7) 15
Other Baseline Re-estimates 3 (95) (35) (8) 2
New Needs/Investments ($33) ($87) ($86) ($101)
Maintenance 31 (22) (22) (22)
Service/Service Support (12) (25) (25) (26)
Technology Enhancements (40) (26) (24) (40)
Safety & Security (3) (10) (11) (10)
All Other New Needs (10) (4) (4) (3)
Savings Programs ($10) $34 $30 $39
New BRPs and Re-estimates (including ASAs) (10) 34 30 39
B&T Adjustments ($748) ($288) ($126) ($125)
B&T Net Baseline Impacts 4 (748) (288) (126) (125)
5
General Reserve ($335) $0 $0 $0
Debt Service (Cash) $51 $59 $92 $91
Subsidies (Cash) $344 $571 $578 $720
Metropolitan Mass Transportation Operating Assist (MMTOA) 154 54 39 106
Petroleum Business Tax (PBT) Receipts 16 19 19 18
Real Estate Taxes 317 375 377 368
Payroll Mobility Tax (PMT) 148 - - -
PMT Replacement Funds 20 13 13 13
For-Hire Vehicle (FHV) Surcharge (43) (33) 5 5
2020-24 Capital Program Funding from Lockbox for Debt Service (515) 38 53 57
State Operating Assistance (18-b) 6 - - -
Local Operating Assistance (18-b) (25) - - -
City Subsidy for MTA Bus (131) (142) (8) (39)
City Subsidy for Staten Island Railway (21) 5 (6) (9)
CDOT Subsidy for Metro-North Railroad 36 (13) 5 24
B&T Surplus Transfer 737 369 199 182
Restore Committed to Capital Contribution (367) (120) (114) -
Other Subsidies and Subsidy Adjustments 12 8 (3) (4)
Below-the-Line (BTL) Adjustments ($848) $1,207 $827 $1,131
Fare and Toll Increases:
Adjustments to 2021 and 2023 Fare/Toll Increases 0 57 67 40
Reversal of Toll Increase Incorporated Above-the-Line (44) (78) (85) (85)
MTA Efficiencies:
MTA Transformation Savings - Not Yet Identified - - - -
Management and Policy Actions:
Service Reductions - - (476) (353)
Two-Year Freeze (Rep/Non-Rep through 2022) - (138) (141) (131)
MTA Re-estimates:
Reversal of Below-the-Line Policy Actions Incorporated Above-the-Line 796 - - -
East-Side Access 31 (7) (58) (75)
Headquarters Call Center (3) (0) 1 2
State Aid for the 2015-19 Capital Program - (8) (8) (8)
Repayment of Revolving Bank Line of Credit - - - -
Other:
FEMA Reimbursement - 140 - -
CRRSAA Federal Aid - - - -
ARPA Federal Aid 22 2,492 1,527 1,740
Proceeds of MLF Deficit Bonding (1,650) (1,250) - -
Prior Year Carryover ($11) ($5) $0 $0
JULY FINANCIAL PLAN 2022-2025
NET CASH SURPLUS/(DEFICIT)
$0 $0 $0 $0
* Totals may not add due to rounding
II-5Notes to Cash Reconciliation after Below-the-Line Adjustments:
1 In the July Plan, farebox revenue recovery estimates for NYCT Subway and Bus, MTA Bus, Long Island Rail Road and Metro-North Railroad reflect the midpoint
between the “best case” and “worst case” McKinsey scenarios. Staten Island Railway reflects the “worst case” scenario, and Bridges & Tunnels toll revenue recovery
projections reflect the “best case” scenario.
2 Includes plan-to-plan rate adjustments for health & welfare (employees and retirees), pension, electric power, fuel, etc.
3 Includes updated operating capital, reimbursable, OTPS adjustments, and cash.
4 While B&T Operating Surplus Transfer is captured as a subsidy, B&T's baseline impacts are captured in individual reconciliation categories in the Agency Baseline
Adjustments above. To avoid duplication, B&T's baseline impacts are eliminated within this line. Included within B&T's baseline changes in 2021 and 2022 are
increased toll revenue and labor expense adjustments. Changes for 2023 and 2024 primarily reflect insurance and changes in rates and related assumptions.
5 The 2019 and 2020 unspent General Reserves, which were held in the Plan for cash needs, can now be released with the anticipated receipt of federal ARPA funds
and used to pay back a portion of an MTA intercompany loan.
II-6METROPOLITAN TRANSPORTATION AUTHORITY
July Financial Plan 2022 - 2025
Consolidated Subsidies
Cash Basis
($ in Millions)
Mid-Year Preliminary
Actual Forecast Budget
2020 2021 2022 2023 2024 2025
MMTOA, PBT & Real Estate Taxes
Metropolitan Mass Transportation Operating Assistance (MMTOA) $1,564.0 $2,247.5 $1,924.0 $1,983.6 $2,047.4 $2,112.9
Petroleum Business Tax (PBT) 565.1 582.9 589.9 584.3 582.1 580.5
Mortgage Recording Tax (MRT) 462.7 579.6 598.2 597.9 614.6 635.7
MRT Transfer to Suburban Counties (5.8) (3.9) (6.8) (7.1) (7.5) (7.9)
MTA Bus Debt Service (12.3) (12.3) (12.3) (12.3) (12.3) (12.6)
Interest 5.3 5.3 5.3 5.3 5.3 5.3
Urban Tax 377.0 342.4 437.6 497.8 534.6 574.2
Other Investment Income 1.7 1.7 1.7 1.7 1.7 1.7
$2,957.8 $3,743.3 $3,537.8 $3,651.3 $3,765.9 $3,889.8
PMT and MTA Aid
Payroll Mobility Tax (PMT) $1,560.8 $1,523.5 $1,596.2 $1,762.5 $1,840.6 $1,920.8
Payroll Mobility Tax Replacement Funds 195.4 293.1 244.3 244.3 244.3 244.3
MTA Aid 248.8 273.2 305.0 310.5 310.9 311.2
$2,005.1 $2,089.8 $2,145.4 $2,317.3 $2,395.8 $2,476.2
New Funding Sources
SAP Support and For-Hire Vehicle Surcharge:
For-Hire Vehicle (FHV) Surcharge $223.2 $228.1 $354.2 $392.5 $392.5 $392.5
Subway Action Plan Account 222.1 224.7 300.0 300.0 300.0 300.0
Outerborough Transportation Account (OBTA) 0.0 0.0 50.0 50.0 50.0 50.0
Less: OBTA Projects 0.0 0.0 (50.0) (50.0) (50.0) (50.0)
General Transportation Account 1.1 3.4 54.2 92.5 92.5 92.5
Less: Transfer to Committed to Capital for SAP 0.0 0.0 0.0 0.0 0.0 0.0
2020-24 Capital Program Funding from Lockox for Debt Service: 499.9 9.8 38.1 52.7 64.2 71.4
Central Business District Tolling Program (CBDTP) 0.0 0.0 0.0 1,000.0 1,000.0 1,000.0
Real Property Transfer Tax Surcharge (Mansion Tax) 176.5 185.7 202.0 219.7 239.0 259.9
Internet Marketplace Tax 260.0 343.5 319.1 322.3 324.5 327.7
Less: Transfer Lockbox Revenues to Committed to Capital 63.5 (519.4) (483.0) (1,489.3) (1,499.2) (1,516.2)
New Funding Sources $723.2 $237.9 $392.3 $445.2 $456.7 $463.9
State and Local Subsidies
State Operating Assistance $150.3 $225.5 $187.9 $187.9 $187.9 $187.9
Local Operating Assistance 216.6 194.7 187.9 187.9 187.9 187.9
Station Maintenance 174.8 177.4 181.0 184.5 188.3 192.5
$541.7 $597.6 $556.9 $560.3 $564.2 $568.3
Other Subsidy Adjustments
NYCT Charge Back of MTA Bus Debt Service ($11.5) ($11.5) ($11.5) ($11.5) ($11.5) ($11.5)
Forward Energy Contracts Program - Gain/(Loss) (26.1) 10.1 12.0 0.1 0.0 0.0
MNR Repayment of 525 North Broadway (2.4) (2.4) (2.4) (2.4) (2.4) (2.4)
Committed to Capital Program Contributions 0.0 (367.3) (120.2) (114.1) (108.8) (103.8)
Drawdown of OPEB Trust Proceeds 337.4 0.0 0.0 0.0 0.0 0.0
$297.3 ($371.1) ($122.1) ($127.9) ($122.8) ($117.7)
Subtotal: Taxes & State and Local Subsidies $6,525.1 $6,297.5 $6,510.3 $6,846.2 $7,059.9 $7,280.6
Other Funding Agreements
City Subsidy for MTA Bus Company $354.2 $398.6 $671.6 $720.3 $677.6 $701.5
City Subsidy for Staten Island Railway 39.5 18.6 68.1 60.6 63.1 67.6
CDOT Subsidy for Metro-North Railroad 299.5 324.5 219.7 203.6 205.9 212.7
$693.2 $741.7 $959.5 $984.5 $946.6 $981.8
Subtotal, including Other Funding Agreements $7,218.3 $7,039.2 $7,469.8 $7,830.7 $8,006.4 $8,262.4
Inter-agency Subsidy Transactions
B&T Operating Surplus Transfer $495.3 $890.9 $990.9 $910.3 $891.7 $830.5
$495.3 $890.9 $990.9 $910.3 $891.7 $830.5
TOTAL SUBSIDIES $7,713.6 $7,930.2 $8,460.6 $8,740.9 $8,898.1 $9,092.9
II-7METROPOLITAN TRANSPORTATION AUTHORITY
Summary of Changes Between July and February Financial Plans
Consolidated Subsidies
Cash Basis
($ in Millions)
2021 2022 2023 2024
MMTOA, PBT and Real Estate Taxes
Metropolitan Mass Transportation Operating Assistance (MMTOA) $153.8 $53.7 $38.7 $105.7
Petroleum Business Tax (PBT) 16.0 18.9 19.1 17.7
Mortgage Recording Tax (MRT) 291.6 284.9 257.2 244.0
MRT Transfer to Suburban Counties 2.5 0.0 0.0 0.0
Interest 0.0 0.0 0.0 0.0
Urban Tax 22.9 90.2 119.9 123.6
Other Investment Income 0.4 0.4 0.4 0.4
$487.2 $448.1 $435.3 $491.4
PMT and MTA Aid
Payroll Mobility Tax (PMT) $148.4 $0.0 $0.0 $0.0
Payroll Mobility Tax Replacement Funds 20.2 12.6 12.6 12.6
MTA Aid 0.0 0.0 0.0 0.0
$168.5 $12.6 $12.6 $12.6
New Funding Sources
SAP Support and For-Hire Vehicle Surcharge:
For-Hire Vehicle (FHV) Surcharge ($43.2) ($33.3) $5.0 $5.0
Subway Action Plan Account (44.1) 0.0 0.0 0.0
Outerborough Transportation Account (OBTA) 0.0 0.0 0.0 0.0
Less: OBTA Projects 0.0 0.0 0.0 0.0
General Transportation Account 0.9 (33.3) 5.0 5.0
Less: Transfer to Committed to Capital for SAP 0.0 0.0 0.0 0.0
2020-24 Capital Program Funding from Lockbox for Debt Service: (514.8) 38.1 52.7 57.0
Central Business District Tolling Program (CBDTP) 0.0 0.0 0.0 0.0
Real Property Transfer Tax Surcharge (Mansion Tax) 0.0 0.0 0.0 0.0
Internet Marketplace Tax 4.7 0.0 0.0 0.0
Less: Transfer Lockbox Revenues to Committed to Capital (519.4) 38.1 52.7 57.0
New Funding Sources ($558.0) $4.8 $57.7 $62.0
State and Local Subsidies
State Operating Assistance $5.9 $0.0 $0.0 $0.0
Local Operating Assistance (24.9) 0.0 0.0 0.0
Station Maintenance (1.4) (2.0) (3.0) (3.8)
($20.5) ($2.0) ($3.0) ($3.8)
Other Subsidy Adjustments
NYCT Charge Back of MTA Bus Debt Service $0.0 $0.0 $0.0 $0.0
Forward Energy Contracts Program - Gain/(Loss) 13.3 9.8 0.1 0.0
MNR Repayment of 525 North Broadway 0.0 0.0 0.0 0.0
Committed to Capital Program Contributions (367.3) (120.2) (114.1) 0.0
($354.0) ($110.3) ($114.0) $0.0
Subtotal: Taxes & State and Local Subsidies ($276.8) $353.1 $388.6 $562.2
Other Funding Agreements
City Subsidy for MTA Bus Company ($131.5) ($142.2) ($8.2) ($39.1)
City Subsidy for Staten Island Railway (20.8) 4.5 (5.9) (9.2)
CDOT Subsidy for Metro-North Railroad 35.9 (13.4) 4.6 24.3
($116.4) ($151.1) ($9.5) ($24.0)
Subtotal, including Other Funding Agreements ($393.2) $202.0 $379.1 $538.1
Inter-agency Subsidy Transactions
B&T Operating Surplus Transfer $737.4 $369.1 $198.7 $182.4
$737.4 $369.1 $198.7 $182.4
TOTAL SUBSIDIES $344.2 $571.2 $577.8 $720.5
II-8[THIS PAGE INTENTIONALLY LEFT BLANK]
II-9METROPOLITAN TRANSPORTATION AUTHORITY
July Financial Plan 2022-2025
Debt Affordability Statement after Below-the-Line Adjustments (1)
$ in millions R
Forecasted Debt Service and Borrowing Schedule Notes 2020 ACTL 2021 2022 2023 2024 2025
1, 2, 3
Combined MTA/TBTA Forecasted Debt Service Schedule $2,703.0 $2,842.9 $3,065.3 $3,514.3 $3,559.9 $3,614.1
4
Forecasted New Long-Term Bonds Issued - 988.6 3,382.2 4,335.6 893.5 883.6
9
Forecasted Debt Service by Credit Notes 2020 ACTL 2021 2022 2023 2024 2025
Transportation Revenue Bonds
5
Pledged Revenues $8,777.6 $10,465.6 $12,488.4 $13,100.6 $13,297.9 $13,982.1
10
Debt Service 1,636.3 1,685.9 1,749.3 1,837.6 1,841.6 1,827.1
Debt Service as a % of Pledged Revenues 19% 16% 14% 14% 14% 13%
Dedicated Tax Fund Bonds
6
Pledged Revenues $565.1 $582.9 $589.9 $584.3 $582.1 $580.5
10
Debt Service 388.1 388.1 387.3 391.9 391.5 386.5
Debt Service as a % of Pledged Revenues 69% 67% 66% 67% 67% 67%
Payroll Mobility Tax Bonds
7
Pledged Revenues $1,809.7 $1,796.7 $1,901.2 $2,073.0 $2,151.6 $2,232.0
10
Debt Service - 58.0 223.1 479.8 517.4 523.8
Debt Service as a % of Pledged Revenues 0% 3% 12% 23% 24% 23%
Triborough Bridge and Tunnel Authority General Revenue Bonds
8
Pledged Revenues $1,138.8 $1,603.9 $1,700.9 $1,700.1 $1,695.9 $1,694.6
10
Debt Service 569.9 601.7 588.4 683.4 692.4 757.7
Debt Service as a % of Total Pledged Revenues 50% 38% 35% 40% 41% 45%
Triborough Bridge and Tunnel Authority Subordinate Revenue Bonds
9
Pledged Revenues $568.9 $1,002.2 $1,112.5 $1,016.7 $1,003.5 $936.8
10
Debt Service 102.0 102.1 103.3 103.1 93.7 91.7
Debt Service as a % of Total Pledged Revenues 18% 10% 9% 10% 9% 10%
Triborough Bridge and Tunnel Authority 2nd Subordinate Revenue Bonds
11
Pledged Revenues $466.9 $900.0 $1,009.2 $913.6 $909.7 $845.1
10
Debt Service - - 7.5 12.9 18.5 20.9
Debt Service as a % of Total Pledged Revenues 0% 0% 1% 1% 2% 2%
12
Debt Service Secured by Lockbox Revenues
10
Debt Service $0.0 $0.0 $0.0 $0.0 $0.0 $2.4
2 Broadway Certificates of Participation
Lease Payments $6.7 $7.1 $6.3 $5.5 $4.7 $3.9
Cumulative Debt Service (Excluding State Service Contract Bonds) Notes 2020 ACTL 2021 2022 2023 2024 2025
Total Debt Service before Below-the-Line Adjustments: 1, 2, 3
$2,703.0 $2,842.9 $3,065.3 $3,514.3 $3,559.9 $3,614.1
Fare and Toll Revenues before Below-the-Line Adjustments $4,263.2 $4,966.1 $7,116.4 $7,665.8 $7,756.4 $7,773.2
Total Debt Service as a % of Fare/Toll Revenue 63.4% 57.2% 43.1% 45.8% 45.9% 46.5%
Operating Revenues (including Fare/Toll Revenues) and Subsidies $15,521.1 $13,378.3 $15,493.5 $16,422.0 $16,769.4 $17,048.4
Total Debt Service as a % of Operating Revenues and Subsidies 17.4% 21.3% 19.8% 21.4% 21.2% 21.2%
Non-Reimbursable Expenses with Non-Cash Liabilities $17,401.2 $19,203.1 $20,068.8 $20,639.5 $21,108.5 $21,884.5
Total Debt Service as % of Non-reimbursable Expenses 15.5% 14.8% 15.3% 17.0% 16.9% 16.5%
15
Total Debt Service after Below the Line Adjustments: $2,703.0 $2,842.9 $3,065.3 $3,514.3 $3,559.9 $3,614.1
15
Fare and Toll Revenues after Below the Line Adjustments $4,263.2 $4,984.0 $7,300.6 $8,132.1 $8,275.1 $8,568.0
Total Debt Service as a % of Fare and Toll Revenue after BTL Adjustments 63.4% 57.0% 42.0% 43.2% 43.0% 42.2%
15
Operating Revenues and Subsidies after Below the Line Adjustments $15,521.1 $17,637.0 $18,340.9 $18,432.7 $19,049.3 $19,888.6
Total Debt Service as a % of Operating Rev/Subsidies after BTL Adjs. 17.4% 16.1% 16.7% 19.1% 18.7% 18.2%
15
Non-reimbursable Expenses after Below the Line Adjustments $17,401.2 $19,150.4 $20,059.1 $20,151.0 $20,636.0 $21,387.8
Total Debt Service as a % of Non-Reimbursable Exp after BTL Adjs. 15.5% 14.8% 15.3% 17.4% 17.3% 16.9%
13
2015-19 State Operating Aid (Capital Plan State Share) - Below the Line $0.0 $0.0 $36.7 $38.1 $38.1 $38.1
14
Lockbox Revenues to Fund Certain PMT Bonds Issued for the 2020-24 CP - 9.8 30.6 39.8 45.7 48.1
14
Lockbox Revenues to Fund Interest on TBTA 2nd Subordinate BAN Interest - - 7.5 12.9 18.5 20.9
Debt Service Secured by Lockbox Revenues 12 - - - - - 2.4
Total Debt Service Less State Operating Aid, Debt Service 12, 13, 14
$2,703.0 $2,833.1 $2,990.5 $3,423.4 $3,457.6 $3,504.6
Supported by Lockbox Revenues
Operating Revenues and Subsidies Less
State Operating Aid and Lockbox Revenues $15,521.1 $17,627.3 $18,266.0 $18,341.8 $18,946.9 $19,779.1
Total Debt Service as a % of Operating Revenue/Subsidies Less
17.4% 16.1% 16.4% 18.7% 18.2% 17.7%
State Operating Aid and Lockbox Revenues
Notes on the following page are integral to this table.
II-10Notes
1 Floating rate notes assumed at the variable rate assumption plus the current fixed spread to maturity.
2 Synthetic fixed-rate debt assumed at swap rate; floating rate notes assumed at swap rate plus the current fixed spread to maturity.
3 All debt service numbers reduced by Build America Bonds (BAB) subsidy.
4 All bonds to be issued assume 30-year level debt service with the principal amortized over the life of the bonds, with the following exceptions: 1) PMT Bonds for Deficit Financing which are 30-year bonds,
amortized on a level debt service basis over 20 years, from year 11 to year 30; 2) PMT Bonds for the MTA Bond funded portion of the 2020-24 capital program ($9,792 million portion) which are 30-year bonds,
amortized on a level debt service basis over 20 years, from year 11 to year 30.
5 Transportation Revenue Bonds pledged revenues consist generally of the following: fares and other miscellaneous revenues from the transit and commuter systems, including advertising, rental income and
certain concession revenues (not including Grand Central and Penn Station); revenues from the distribution to the transit and commuter system of TBTA surplus; State and local general operating subsidies;
funds contributed to the General Transportation Account of the NYC Transportation Assistance Fund; special tax-supported operating subsidies after the payment of debt service on the MTA Dedicated Tax Fund
Bonds, and the Payroll Mobility Tax Obligation Resolution Bonds; New York City urban tax for transit; station maintenance and service reimbursements; and revenues from the investment of capital program
funds. Pledged revenues secure Transportation Revenue Bonds before the payment of operating and maintenance expenses. Starting in 2006, revenues, expenses and debt service for MTA Bus have also been
included.
6 Dedicated Tax Fund pledged revenues as shown above consist generally of the following: petroleum business tax, motor fuel tax and motor vehicle fees deposited into the Dedicated Mass Transportation Trust
Fund for the benefit of the MTA; in addition, while not reflected in the DTF pledged revenue figures above, the petroleum business tax, district sales tax, franchise taxes and temporary franchise surcharges
deposited into the Metropolitan Transportation Operating Assistance Account for the benefit of the MTA are also pledged. After the payment of debt service on the MTA Dedicated Tax Fund Bonds, these
subsidies are available to pay debt service on the MTA Transportation Revenue Bonds, and then any remaining amounts are available to be used to meet operating costs of the transit system, the commuter
system, and SIRTOA.
7 Payroll Mobility Tax Obligations pledged revenues consist of Payroll Mobility Tax and Aid Trust Account Receipts.
8 Triborough Bridge and Tunnel Authority General Revenue Bond pledged revenues consist primarily of the tolls charged by TBTA on its seven bridges and two tunnels. Pledged revenues secure TBTA General
Revenue Bonds after the payment of TBTA operating and maintenance expenses, including certain reserves.
9 Triborough Bridge and Tunnel Authority Subordinate Revenue Bonds pledged revenues consist primarily of the tolls charged by TBTA on its seven bridges and two tunnels, after the payment of debt service on
the TBTA General Revenue Bonds.
10 A debt service schedule for each credit is attached as addendum hereto.
11 Triborough Bridge and Tunnel Authority Second Subordinate (2nd SUB) Revenue Bonds pledged revenues consist primarily of the tolls charged by TBTA on its seven bridges and two tunnels, after the payment
of debt service on the TBTA General Revenue and Subordinate Revenue Bonds.
12 Debt service secured by lockbox revenues. Lockbox revenues consist of sales tax revenues, mansion tax and CBDTP revenues.
13 The 2015-19 Capital Plan includes capital projects funded by the State through additional operating aid appropriated to the MTA on an annual basis.
14 Certain PMT and TBTA 2nd SUB debt service to be paid by Lockbox revenues.
15 These totals incorporate the Plan's Below-the-Line Adjustments.
II-11[THIS PAGE INTENTIONALLY LEFT BLANK]
II-12lII. Plan Adjustments
Plan Adjustments

The discussion that follows reflects proposed Plan Adjustments to the Baseline.

Fare/Toll Increases

Fare Increase in November 2021 – An increase in fare rates, yielding a 4% increase in farebox
revenues, is assumed for implementation in November 2021 and is projected to generate an
annualized increase of $209 million in MTA consolidated farebox revenue (as measured
in 2024, when ridership is expected to recover to the “new normal” level). Consolidated
farebox revenue is expected to increase by $18 million in 2021, by $184 million in 2022, by
$205 million in 2023, $209 million in 2024 and by $208 million in 2025.

Increases in farebox revenues generated at MTA Bus and SIR are used to hold down NYC
subsidies that cover the costs associated with these operations. These items are offsets to the
consolidated farebox revenue generated from the fare increase, and are included within
“Subsidy Impacts of 2021, 2023 and 2025 Fare/Toll Increase”; when these subsidy offsets are
factored in, the net change to the MTA from the proposed 2021 increase is $17 million in 2021,
$179 million in 2022, $197 million in 2023, $201 million in 2024 and $200 million in 2025. These
net projections when compared with the February Plan are lower by $5 million in 2021, and
higher by $50 million in 2022, $31 in 2023 and $16 million in 2024.

Fare and Toll Increase in March 2023 – An increase in fares and tolls, yielding a 4% overall
increase in farebox and toll revenues, is assumed for implementation in March 2023 and is
projected to generate a $310 million annualized increase in MTA consolidated farebox and toll
revenues, with consolidated farebox and toll revenues expected to increase by $261 million in
2023, $310 million in 2024 and $311 million in 2025. Factoring in the MTA Bus, SIR and B&T
adjustments included in “Subsidy Impacts of 2021, 2023 and 2025 Fare/Toll Increase” (10%
of all B&T surplus toll revenues are delayed for distribution to NYCT and the Commuter
Railroads, per MTA Board policy, until B&T results are audited), the net increase to the MTA
is $248 million in 2023, $301 million in 2024 and $302 million in 2025. Compared with the
February Plan, net projections are higher by $29 million in 2023 and $23 million in 2024.

Fare and Toll Increase in March 2025 – An increase in fares and tolls, yielding a 4% overall
increase in farebox and toll revenues, is assumed for implementation in March 2025 and is
projected to generate a $327 million annualized increase in MTA consolidated farebox and toll
revenues, with consolidated farebox and toll revenues expected to increase by $276 million in
2025. Factoring in the MTA Bus, SIR and B&T adjustments included in “Subsidy Impacts of
2021, 2023 and 2025 Fare/Toll Increase”, the net increase to the MTA is $262 million 2025.

                                              III-1
MTA Consolidated Utilization
MTA Agency Fare and Toll Revenue Projections, in millions
Including the Impact of Fare & Toll Yield Increases
Mid-Year Preliminary
Forecast Budget
2021 2022 2023 2024 2025
Fare Revenue
Long Island Rail Road Baseline $292.003 $556.959 $630.0 $648.7 $659.8
2021 Yield Increase $1.956 $22.278 25.200 25.948 26.394
2023 Yield Increase $0.000 $0.000 22.404 26.986 27.449
2025 Yield Increase $0.000 $0.000 0.000 0.000 24.404
$293.959 $579.238 $677.6 $701.6 $738.1
Metro-North Railroad 1 Baseline $255.216 $514.836 $581.0 $584.2 $588.6
2021 Yield Increase $0.990 $12.494 14.208 14.286 14.399
2023 Yield Increase $0.000 $0.000 11.380 13.402 13.518
2025 Yield Increase $0.000 $0.000 0.000 0.000 11.847
$256.207 $527.330 $606.6 $611.9 $628.3
MTA Bus Company 2 Baseline $123.248 $178.962 $193.9 $197.2 $196.6
2021 Yield Increase $0.814 $7.158 7.755 7.888 7.864
2023 Yield Increase $0.000 $0.000 6.875 8.204 8.179
2025 Yield Increase $0.000 $0.000 0.000 0.000 7.250
$124.062 $186.120 $208.5 $213.3 $219.9
New York City Transit 3 Baseline $2,153.425 $3,604.150 $3,987.4 $4,047.2 $4,027.9
2021 Yield Increase $14.072 $142.062 157.614 160.318 159.547
2023 Yield Increase $0.000 $0.000 139.117 166.669 165.867
2025 Yield Increase $0.000 $0.000 0.000 0.000 146.413
$2,167.497 $3,746.212 $4,284.2 $4,374.2 $4,499.8
Staten Island Railway 2 Baseline $1.874 $4.507 $5.4 $5.5 $5.5
2021 Yield Increase $0.013 $0.180 0.218 0.221 0.221
2023 Yield Increase $0.000 $0.000 0.193 0.230 0.230
2025 Yield Increase $0.000 $0.000 0.000 0.000 0.203
$1.887 $4.688 $5.8 $6.0 $6.2
Total Farebox Revenue Baseline $2,825.767 $4,859.414 $5,397.8 $5,482.9 $5,478.5
2021 Yield Increase $17.845 $184.174 204.994 208.662 208.425
2023 Yield Increase $0.000 $0.000 179.968 215.490 215.243
2025 Yield Increase $0.000 $0.000 0.000 0.000 190.118
$2,843.612 $5,043.588 $5,782.7 $5,907.0 $6,092.3
Toll Revenue
Bridges & Tunnels 4 Baseline $2,140.345 $2,256.999 $2,268.0 $2,273.5 $2,294.7
2021 Yield Increase $0.000 $0.000 0.000 0.000 0.000
2023 Yield Increase $0.000 $0.000 81.364 94.579 95.459
2025 Yield Increase $0.000 $0.000 0.000 0.000 85.614
$2,140.345 $2,256.999 $2,349.4 $2,368.1 $2,475.8
TOTAL FARE & TOLL REVENUE
Baseline $4,966.112 $7,116.413 $7,665.8 $7,756.4 $7,773.2
2021 Yiel/d Increase $17.845 $184.174 204.994 208.662 208.425
2023 Yiel/d Increase $0.000 $0.000 261.333 310.070 310.702
2025 Yiel/d Increase $0.000 $0.000 0.000 0.000 275.732
$4,983.957 $7,300.586 $8,132.1 $8,275.1 $8,568.0
1 Metro-North Railroad utilization figures include both East of Hudson and West of Hudson services.
2 MTA Bus and Staten Island Railway revenues from fare increases are used to reduce NYC subsidies to MTA Bus and
3 New York City Transit utilization figures include Paratransit and Fare Media Liability.
4 Distribution of 10% of B&T surplus toll revenue is delayed to subsequent year per MTA Board resolution.
III-2MTA Initiatives
MTA Transformation Savings – Not Yet Identified – In 2019, the MTA procured the services of
a management consulting firm to review operations throughout the organization and
recommend changes to simplify and streamline internal processes, clarify roles and
responsibilities across the Agencies, and solidify accountability so that the MTA can efficiently
deliver the safe and reliable service its customers deserve. Although the pandemic had
delayed the full implementation of the Transformation Plan, savings were realized from
ongoing vacancies and the MTA hiring freeze; these savings were incorporated into Agency
baselines in the February Plan. Unidentified transformation savings of $25 million in 2021,
$146 million in 2022, $151 million in 2023, and $148 million in 2024 remained, and are
unchanged in the July Plan.
MTA Management and Policy Actions
Service Reductions – In the February Plan, the MTA had proposed service reductions to align
with the post-pandemic “new normal” ridership levels based on the “worst case” ridership
recovery scenario. The proposed service reductions focused on achieving significant cost
reductions, mitigating negative customer impacts, and providing service in response to current
and projected ridership. Service would be restored as ridership levels improve, and savings
would be $696 million in 2023 and $559 million in 2024. With ridership trending on a path
consistent with the midpoint between the “best case” and “worst case” recovery scenarios,
service reductions have been scaled back to align with the more favorable ridership
expectations and the accompanying expense savings are reduced to $220 million in 2023 and
$206 million in 2024 and 2025.
Two-Year Wage Freeze – In the February Plan, the MTA had proposed a wage freeze through
2022 for all employees, both represented and non-represented, saving an estimated $309
million in 2022, $315 million in 2023 and $322 million in 2024. With the arrival of ARPA Federal
Aid, this proposed action has been revised. The TWU Local 100 contract, a four-year contract
that runs through mid-May 2022, will be fully honored, as will all other settled contracts.
Bargaining units that typically follow the TWU pattern settlements have either entered into two-
year agreements similar to the first two years of the current TWU contract or are expected to
do so, and those two-year contracts will also be honored, but followed by a pause until the
MTA financial picture comes into focus. Non-represented employees would not have wage
increases for two years. Revised savings from this policy action are estimated to be $171
million in 2022, $174 million in 2023, $191 million in 2024 and $198 million in 2025.
MTA Re-estimates
State Aid for the 2015-19 Capital Plan – Pursuant to the State’s $7.3 billion funding
commitment for the 2015-2019 Capital Program, as authorized through legislation enacted in
2016, State Aid will be $37 million in 2020 and $38 million in each year thereafter. This is a
decrease of $23 million over the Plan period compared to the February Plan.
Repayment of Revolving Bank Line of Credit – To provide liquidity, the MTA drew on its line of
credit in 2020; the line of credit is expected to be repaid in 2022.
Other Adjustments
FEMA Reimbursement – The February Plan included reimbursement from the Federal
Emergency Management Agency (“FEMA”) for the estimated $293 million in direct COVID-
III-3You can also read