Mutagenicity Ames assessment of Artemisia
←
→
Page content transcription
If your browser does not render page correctly, please read the page content below
Mutagenicity Ames assessment of Artemisia
 annua and Artemisia afra

 A Major Qualifying Project Report

 Submitted to the Faculty of

 WORCESTER POLYTECHNIC INSTITUTE

 in partial fulfillment of the requirements

 for the Degree of Bachelor of Science

 By

 ___________________________________________

 Jessica Marquez

 Approved:

 ____________________________________________

 Dr. Pamela J. Weathers, Advisor
Jessica Marquez

Acknowledgement
I would like to thank Professor Weathers for giving me the opportunity to work on this project and for
being my advisor. She has been incredibly kind and patient with me during this process and has given so
many opportunities all while holding me to a high academic standard. I never could have finished this
project without her help.

Many thanks to Melissa Towler for her guidance in the lab and patience throughout the course of this
project.

A special thanks to the Weathers lab team for their feedback and help on this project.

Thank you to Tomás Ringer-Silva for all the support and feedback throughout this project.

 1
Jessica Marquez

Table of Contents
Acknowledgement ........................................................................................................................................ 1
Table of Tables ............................................................................................................................................. 4
Table of Figures ............................................................................................................................................ 4
Abstract ......................................................................................................................................................... 5
1.0 Background ............................................................................................................................................. 6
 1.1 Artemisia ............................................................................................................................................. 6
 1.1.1 Artemisia annua ........................................................................................................................... 6
 1.1.2 Artemisia afra ............................................................................................................................ 12
 1.2 Artemisinin ....................................................................................................................................... 13
 1.2.1 Artemisinin Derivatives ............................................................................................................. 14
 1.2.2 Artesunate .................................................................................................................................. 14
 1.2.3 Artemether ................................................................................................................................. 14
 1.2.4 Dihydroartemisinin .................................................................................................................... 14
 1.3 Ames Test ......................................................................................................................................... 14
 1.4 Ames Test Process ............................................................................................................................ 15
 1.5 TA Strains ......................................................................................................................................... 17
 1.6 Ames mutagens ................................................................................................................................. 18
 1.7 Multi-well Ames Test ....................................................................................................................... 19
 1.8 Rationale ........................................................................................................................................... 19
2.0 Hypothesis and Objectives .................................................................................................................... 21
 2.1 Hypothesis......................................................................................................................................... 21
 2.2 Objectives ......................................................................................................................................... 21
3.0 Methodology ......................................................................................................................................... 22
 3.1 Plant Materials .................................................................................................................................. 22
 3.2 Bacterial strains and their cultivation................................................................................................ 22
 3.3 Protocol ............................................................................................................................................. 22
 3.4 Analysis............................................................................................................................................. 23
 3.5 Statistical analysis ............................................................................................................................. 23
4.0 Anticipated Results ............................................................................................................................... 24
 4.1 Mutagenic ......................................................................................................................................... 24
 4.2 Unanticipated Results ....................................................................................................................... 24

 2
Jessica Marquez

5.0 Results ................................................................................................................................................... 25
 5.1 Raw Data........................................................................................................................................... 25
 5.2 MR Ratio........................................................................................................................................... 26
6.0 Discussion ............................................................................................................................................. 27
 6.1 ANOVA ............................................................................................................................................ 28
 6.1.1 Error and Uncertainty................................................................................................................. 29
7.0 Conclusion ............................................................................................................................................ 29
8.0 Cited references ....................................................................................................................................30
9.0 Appendices............................................................................................................................................ 34
 9.1 Appendix A: Recipes ........................................................................................................................ 34
 9.1.1 Vogel-Bonner medium E (50x).................................................................................................. 34
 9.1.2 0.5 mM histidine/biotin solution ................................................................................................ 34
 9.1.3 Sodium phosphate buffer, 0.1 mM, pH 7.4 ................................................................................ 35
 9.1.4 Glucose solution (10% v/v) ........................................................................................................ 35
 9.1.5 Ampicillin solution (0.8% w/v) .................................................................................................. 35
 9.1.6 Minimal glucose plates .............................................................................................................. 36
 9.1.7 Histidine/Biotin plates (Master plates for non R-factor strains) ................................................ 36
 9.1.8 4-Nitroquinoline 1-oxide (4NQO) ............................................................................................. 37
 9.2 Appendix B: Materials and Reagents................................................................................................ 37
 9.2.1 Materials .................................................................................................................................... 37
 9.2.2 Reagents ..................................................................................................................................... 38
 9.2.3 Equipment .................................................................................................................................. 38
 9.3 Appendix C: Statistic Analysis of Results ........................................................................................ 39

 3
Jessica Marquez

Table of Tables
Table 1 Acute toxicities of A. annua SAM components............................................................................... 8
Table 2 Flavonoid Subgroups ..................................................................................................................... 10
Table 3 Ames tested artemisinic derivatives............................................................................................... 14
Table 4 The genotype of TA strains............................................................................................................ 18
Table 5 TA100 SAM .................................................................................................................................. 25
Table 6 TA98 SAM .................................................................................................................................... 25
Table 7 TA98 SAM .................................................................................................................................... 26
Table 8 TA100 SEN.................................................................................................................................... 26
Table 9 TA98 SEN...................................................................................................................................... 26
Table 10 Mutagenicity Assay Results (n≥3) ............................................................................................... 27
Table 11 - TA 100 w A. Annua .................................................................................................................. 39
Table 12 - TA 100 w A. Afra ...................................................................................................................... 39
Table 13 - TA 98 w A. Annua .................................................................................................................... 39
Table 14 - TA 98 w A. Afra ........................................................................................................................ 39

Table of Figures
Figure 1 Leaves of A. annua ......................................................................................................................... 7
Figure 2 Basic structure of a flavonoid (open access) .................................................................................. 9
Figure 3 Camphor found in A. annua (open access) ................................................................................... 11
Figure 4 Structure of coumarin (open access) ............................................................................................ 11
Figure 5 Scopoletin found in A. annua (open access)................................................................................. 12
Figure 6 Chlorogenic acid found in A. annua (open access) ...................................................................... 12
Figure 7 (a) Artemisinin, (b) Artesunate, (c) Artemether, and (d) Dihydroartemisinin.............................. 13
Figure 8 The overall process of the Ames test ............................................................................................ 17
Figure 9 4-Nitroquinoline 1-oxide (4NQO) ................................................................................................ 19

 4
Jessica Marquez

Abstract
Artemisia annua and Artemisia afra are putative cost-effective antimalarial drugs. It is therefore
necessary to understand the possible lasting genetic effects they could have on a patient and the
patient’s children via testing. One of these tests is the mutagenicity assay, also called the Ames
test. The Ames test is done by using genetically modified Salmonella typhimurium strains to
determine if the test sample can restore the gene function of the modified strain through
mutation, which allows the bacteria to grow. Colonies are counted and compared to negative
controls to suggest the sample’s mutagenicity. In this assay for A. annua and A. afra, it was
anticipated that the Ames test would validate that the plant extracts are non-mutagenic due to
previous clinical trials that showed no negative effects. From this assay on A. annua and A. afra,
there is implied non-mutagenicity. Further testing is required, but the assay suggests that further
testing would show similar results and supports the promotion of future research into uses for A.
annua and A. afra and their derivatives. Results of this assay also will impact a request for an
Investigational New Drug FDA approval as the Ames test is one of the steps required to prove
the infusions are non-mutative to patients.

 5
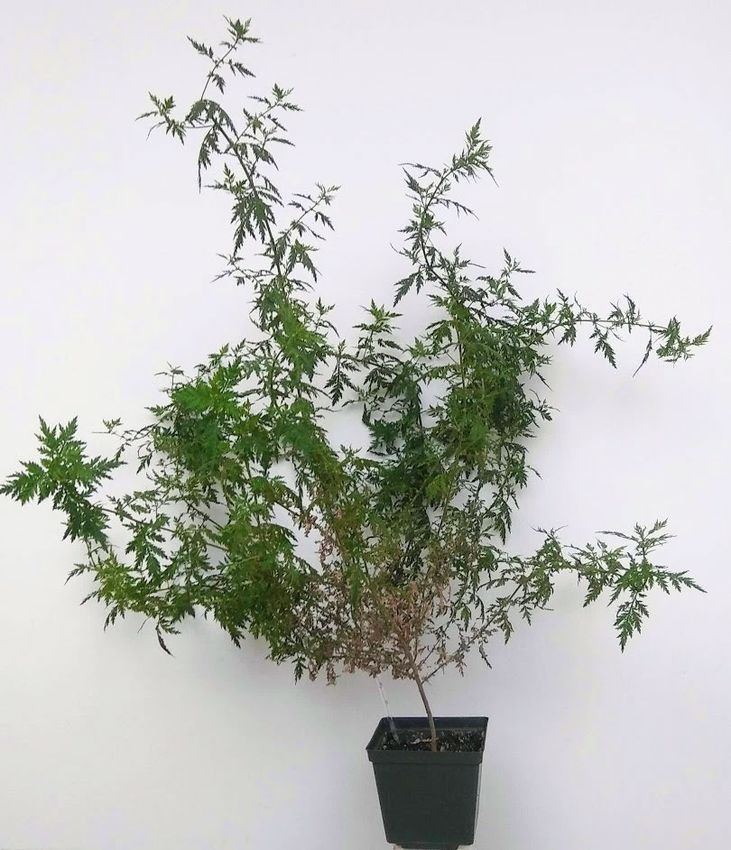
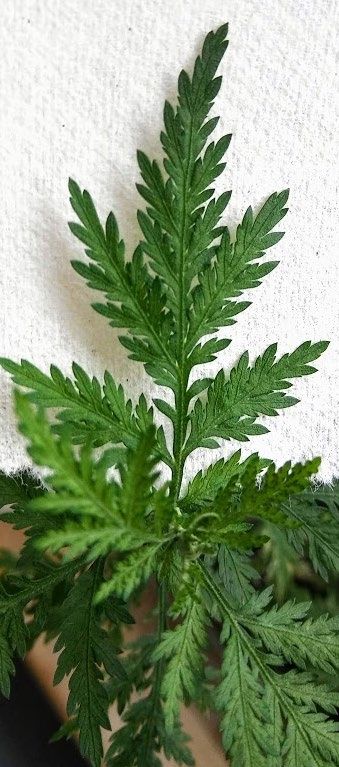
Jessica Marquez

1.0 Background
When marketing consumables such as medicine, rigorous testing is necessary to ensure the safety
of those who take it. The US Food and Drug Administration (FDA) has requirements for the
approval of consumables and one of these tests is mutagenicity assays. This assay will focus on
the antimalarial plants, Artemisa annua and Artemisia afra. Malaria is a disease caused by
mosquito-borne parasites which enter the blood cells and, if left untreated, may develop into
severe complications or even death (CDC - Parasites - Malaria, 2020). This global issue is
especially deadly in areas where medical treatment is more difficult to attain. Therefore, a
solution that could be grown locally and used as treatment could be vital in lowering the death
toll.

1.1 Artemisia

This proposal aims to study the mutagenicity of Artemisia sp., specifically Artemisia Annua L.
and Artemisia afra tea infusions. Artemisia sp. have been used throughout history to help fight
malaria and many other illnesses (Newman et al., 2015), which indicates the importance of
determining any possible mutagenicity of the plant. While there is not much mutagenicity testing
done with the plants in this genus, the ethnopharmacological history of each species has not
related any major ill effects despite centuries of use.

This proposal will focus on A. annua and A. afra as they have been tested directly in clinical
trials as a low-cost cure for malaria. Both A. annua and A. afra infusions are polytherapies due to
the seeming synergy of artemisinin with other phytochemicals within the plant that produces
better outcomes than ASAQ against malaria (Munyangi et al., 2019; Mueller et al., 2004).

1.1.1 Artemisia annua

The first plant to be tested is Artemisia annua L. (Figure 1). Grown natively in Asia, A. annua
has been used in Chinese medicine to treat fevers and inflammation for several millennia (Hsu,
2006). A. annua produces the sesquiterpene lactone, artemisinin, which is a potent antimicrobial
used to treat a variety of infectious diseases, especially malaria (Weathers et al., 2014). In Figure
1, the woody stems and small, pointed leaves are shown. These leaves are picked and dried for
medicinal use.

A. annua provides up to 1.5% artemisinin in dry plant material (Kumar et al., 2004) while A. afra
only contains trace amounts (Liu et al., 2009). Another aspect of A. annua is the flavonoids that
are reported to work synergistically with artemisinin to become more effective in the human
body (Rasoanaivo et al., 2011).

 6
Jessica Marquez

 Figure 1 Leaves of A. annua

The flavonoids in A. annua leaves have been linked to suppression of cytochrome P450
(CYP450) enzymes that alter the liver metabolism of artemisinin in the body, which seems to
allow artemisinin delivered through dried leaf annua to be distributed to tissues in higher
concentrations in vivo (Desrosiers et al., 2020). These flavonoids are linked to a beneficial
immunomodulatory activity in patients afflicted with parasitic and chronic diseases (Ferreira et
al., 2010). A. annua contains artemisinin which, when combined with these flavonoids, is
reported to have a synergistic reaction that allows for the plant to work more effectively in
people (Ferreira et al., 2010). When tested individually, specific phytochemicals known to be
part of the inhibition of artemisinin showed weaker results than the whole plant extract in
preforming the same function (Desrosiers et al., 2020). The plant is often consumed by first
drying the leaves and then steeping about 5 g/L in boiled water to make a tea infusion. In
previous clinical trials testing the effects of this plant against malaria, patients were treated by
drinking 0.33 L of an infusion of 5 g of dried leaves per L of hot water every 8 hours for 7 days
(Munyangi et al., 2019). A. annua cured malaria faster and more effectively than artesunate-
amodiaquine (ASAQ), another anti-malarial treatment, in clinical trials, and it also appeared that
the tea infusion treatment was able to break the cycle of malaria by eliminating gametocytes in
the parasitic life cycle (Munyangi et al., 2019).

Another aspect of the plant to consider is the individual components that make up the resulting
infusion, as shown in Table 1. To the best of my knowledge, none of the phytochemicals shown
in Table 1 are mutagenic.

 7
Jessica Marquez

 Table 1 Acute toxicities of A. annua SAM components

 Components LD 50 Delivery Species Source
 (mg/kg) Route

 Artemisinin 5,576 P.O. Rat http://datasheets.scbt.com/sc-
 202960.pdf
 Dihydroartemisinic N/A N/A N/A N/A
 acid
 Arteannuin B 400 P.O. Rat https://books.google.com/books?id
 =iQlmDAAAQBAJ&dq=arteannui
 n+b+ld50&source=gbs_navlinks_s
 Artemisinic acid N/A N/A N/A N/A
 α-Pinene 3,700 P.O. Rat http://datasheets.scbt.com/sc-
 239166.pdf
 Eucalyptol (1,8 2,480 P.O. Rat Jenner et al. 1964
 cineole)
 Camphor 1,310 P.O. Mouse https://www.caymanchem.com/ms
 dss/23175m.pdf
 Chlorogenic acid 10 I.P. Mouse https://www.caymanchem.com/ms
 dss/70930m.pdf
 Rosmarinic acid 561 I.V. Mouse https://pubchem.ncbi.nlm.nih.gov/
 compound/Rosmarinic-
 acid#section=Toxicity
 Scopoletin 3,800 I.P. Rat https://www.caymanchem.com/ms
 dss/20042m.pdf
 Artemetin N/A N/A N/A N/A
 Casticin N/A N/A N/A N/A
 Chrysoplenol-D N/A N/A N/A N/A
 Chrysoplenetin N/A N/A N/A N/A
 Eupatorin N/A N/A N/A N/A
 Kaempferol 980 P.O. Rat https://www.tandfonline.com/doi/p
 df/10.3109/13880209.2014.98230
 1
 Luteolin 180 I.P Mouse https://www.caymanchem.com/ms
 dss/10004161m.pdf
 Myricetin 1410 I.P. Mouse Lewis (ed.) 2004
 Quercetin 161 P.O. Rat http://datasheets.scbt.com/sc-
 206089.pdf
PO, Oral; IP, Intraperitoneal; IV, Intravenous; N/A, Not available

 8
Jessica Marquez

Flavonoids

Flavonoids are a group of compounds with variable phenolic structures found in plants. These
compounds are an important part of nutraceutical, pharmaceutical, medicinal, and cosmetic
applications (Panche et al., 2016). These compounds are divided into groups depending on the C
ring into the subgroups of flavones, flavonols, flavanones, flavanonols, flavanols or catechins,
anthocyanins and chalcones (Panche et al., 2016).

 Figure 2 Basic structure of a flavonoid (open access)

The C ring in this molecule could be altered in the following ways as described in Table 2.
Flavones have a double bond between positions 2 and 3 and a ketone in position 4 of the C ring,
and often have a hydroxyl group in position 5 of the A ring. Flavonols have a hydroxyl group in
position 3 of the C ring. Compared to flavones, flavanones are only structural different by the
saturated C ring. The flavanols hydroxyl group is always bound to position 3 of the C ring and
there is no double bond between positions 2 and 3. Anthocyanins are defined by the hydroxyl
groups on the A and B rings. Chalcones are known as the open-chain flavonoids as they are
defined by a lack of C ring.

 9
Jessica Marquez

 Table 2 Flavonoid Subgroups

 Subgroup Subgroup flavonoid structures Examples verified in A. annua
 featuring C ring cv. SAM

Flavones Apigenin

Flavonols

Flavanones Not as yet detected.

Flavanols (aka Kaempferol
catechins)

Anthocyanins Not as yet detected.

Chalcones Not as yet detected.

 10
Jessica Marquez

While flavonoids are not completely understood, these compounds have antioxidant effects and
exhibit anti-inflammatory, anti-mutagenic and anti-carcinogenic properties (Panche et al., 2016).
In A. annua the majority of phenolics extracted consist of flavonoids such as 10 species of
flavones and 28 flavonols (Ferreira et al., 2010).

Monoterpenes

Monoterpenes are a terpene subgroup that contains two 5C isoprene units.
Natural monoterpenes found in plants are associated with secretory or
storage structures, e.g. glandular trichomes, and these compounds are
usually formed in plastids (Goodger et al., 2009, p.). The over 20
monoterpenes found in A. annua show distinct roles of the products
produced when tested through phytohormone and wounding treatments
(Ruan et al., 2016). Camphor, shown in Figure 3, is one example of a
 Figure 3 Camphor
monoterpene found in A. annua.
 found in A. annua
 (open access)

Coumarins

Coumarins are a family of benzopyrones found in nature of oxygen-containing heterocycles
(Matos et al., 2015). They contain the basic framework found in Figure 3.

 Figure 4 Structure of coumarin (open access)

These compounds are medical candidates for drugs with strong pharmacological activity, low
toxicity and side effects, less drug resistance, high bioavailability, broad spectrum, better
curative effects, etc., (Matos et al., 2015). Coumarin derivatives have also been applied to
address many pharmacological targets in a selective way, such as selective enzyme inhibitors,
and more recently, a number of selected targets (multitarget ligands) involved in multifactorial
diseases, such as Alzheimer’s and Parkinson’s diseases (Stefanachi et al., 2018). Figure 5 shows
scopoletin, a coumarin commonly found in A. annua.

 11
Jessica Marquez

 Figure 5 Scopoletin found in A. annua (open access)

Polyphenolic acids

Polyphenols are composed of two groups tannins and flavonoids. While flavonoids have
previously been discussed, tannins can also be broken down into hydrolysable and condensed
tannins (Ferreira et al., 2010). A total of 40 phenolic compounds were identified or tentatively
characterized in the methanol extract of A. annua (Han et al., 2008). These phenolic acids
include chlorogenic acid as seen in Figure 5, quinic acid, and coumaric acid (Ferreira et al.,
2010). More specifically, in the A. annua SAM cultivar, chlorogenic acid has been identified.
Chlorogenic acid is an ester formed from cinnamic acids and quinic acid and is also known as 5-
O-caffeoylquinic acid (Clifford, 2000).

 Figure 6 Chlorogenic acid found in A. annua (open access)

1.1.2 Artemisia afra

Common to South Africa, A. afra is also a known ethnopharmacological plant. This species has
been used for years as a treatment for bronchial issues, diabetes, colds, headaches, and swelling
(Liu et al., 2009). While only the rare cultivar has at most trace amounts of artemisinin, A. afra
was still effective against malaria as shown in a recent clinical trial (Munyangi et al., 2019). In
that clinical trial, A. afra infusions were prepared similar to A. annua; 5 g of dried leaves and
twigs were steeped in 1 L of boiling water. A. afra performed similarly to A. annua in that, even
though A. afra contains only trace amounts of artemisinin, which is considered the main

 12
Jessica Marquez

antimalarial compound, almost all patients who were treated with A. afra had the same
therapeutic response as those treated with A. annua (Munyangi et al., 2019). Gruessner et al.
(2020) discussed those levels of artemisnin in A. annua and A. afra used int hat study and argued
that there was more than enough bioavailable artemisnin to treat malaria the lowest antimalarial
threshold of which is ~10 µg/L.

1.2 Artemisinin
The chemical derivative found in A. annua, artemisinin (Figure 2), and its derivatives are
reported to be active against a range of diseases such as many parasites, some viruses,
Pnuemocystis carinii, and a number of human cancer cell lines (Efferth, 2007).

To enhance its bioavailability, artemisinin has been chemically modified into several derivatives
including artesunate (AS), artemether (AM), and dihydroartemisinin (DHA) (Figure 2). While
those derivatives are used in combination with other antimalarial drugs to treat malaria and other
diseases, the focus of this study will primarily be A. annua and A. afra.

 Figure 7 (a) Artemisinin, (b) Artesunate, (c) Artemether, and (d) Dihydroartemisinin

Despite low bioavailability of pure AN, it is highly bioavailable when delivered orally as dried
leaves of the plant (Weathers et al., 2011; Desrosiers et al., 2020).

 13
Jessica Marquez

1.2.1 Artemisinin Derivatives

Artemisinin is a natural part of A. annua; its multiple semi-synthetic derivatives are semi-
synthetic and not naturally found in the plant. Consequently, AS, AM, and DHA will not be
tested in this mutagenicity assay because they have already been analyzed via the Ames test as
shown in Table 2 (Tu, 2017).

 Table 3 Ames tested artemisinic derivatives

 Artemisinin Derivative Mutagenicity Results
 AS negative
 AM negative
 DHA negative

1.2.2 Artesunate

Artesunate chemically is composed of three main rings similar to artemisinin, one of which is a
seven membered ring that contains a peroxide bridge. The structure of the ring is slightly
different from artemisinin also due to the oxygen in the ring that is in the same plane as the rest
of the molecule structure. Artesunate is synthesized from DHA. After the oxygen attached to the
carbon 10 from the artemisinin molecule has been substituted for a hydroxide to make DHA, a
base is switched for the hydroxide and the ring opens to create the final AS.

1.2.3 Artemether

When the lactone in artemisinin has been converted to the corresponding lactol methyl ether the
product formed is artemether (Artemether (CHEBI:195280), n.d.). It is used in combination with
lumefantrine as an antimalarial for the treatment of multi-drug resistant strains of falciparum
malaria as the artemether component is absorbed rapidly and biotransformed to
dihydroartemisinin (White et al., 1999).

1.2.4 Dihydroartemisinin

Dihydroartemisinin is the active metabolite of all artemisinin compounds. The proposed
mechanism of action of artemisinin involves cleavage of endoperoxide bridges by iron in blood
cells, producing free radicals which damage biological macromolecules (Cumming et al., 1996).

1.3 Ames Test

The Ames test is a bioassay done in vitro to understand the risk of mutagenicity of drugs,
reagents, and other substances. While a mutagenic sample may directly cause cancer in a patient,

 14
Jessica Marquez

it could also lead to possible unknown defects in later generations. Therefore, mutagenicity
testing is an essential step before releasing a drug for commercial use.

The Ames test, published by Bruce Ames’s laboratory in 1973, provides a procedure for rapid
and simple chemical mutagenicity testing and supplies information on the metabolism of non-
mutagenic chemicals to their potentially DNA-reactive forms (Zeiger, 2019). Following the
original publication, many tests demonstrated the efficacy of the Ames test and its validity in
predicting the likelihood of a chemical being carcinogenic.

The test works by using genetically modified Salmonella typhimurium strains to determine if the
sample can restore the gene function of the modified strain through mutation, which allows the
bacteria to grow. The S. typhimurium strains each have a slightly different modified histidine
operon that prevents it from synthesizing histidine; strains are grown on an agar plate with
minimal histidine to allow for a few replications. Only the bacteria that revert to synthesizing
histidine for itself will be able to thrive on the plate. The control plates are necessary for
comparing the test plate with growth of spontaneous natural revertants, which tend to be low in
number and relatively constant (Mortelmans & Zeiger, 2000).

1.4 Ames Test Process
The original Ames test has gone through alterations that made it easier to gather necessary
information, quicker, and with better similarity to in vivo human processes. Unlike animal and
human biology, bacteria do not use cytochrome P450s to metabolize chemicals, therefore, liver
S9 mix later was added to the Ames test to gather additional information on how the tested
substance would interact and metabolize in the human body (Mortelmans & Zeiger, 2000). The
S9 mix is a specific fraction of homogenized liver and more recently is now prepared from a
pool of human liver microsomes.

To perform the Ames test, Typhimurium Ames (TA) strains should be prepared ahead of the test
along with fresh mutagen for each experiment along with the positive and negative controls.
While the negative controls will always be autoclaved water, the positive controls may differ
depending on whether S9 mix has been added for metabolic activation.

The positive controls without the S9 mix include sodium azide, 2-nitrofluorene, and mitomycin.
Sodium azide (NaN3) is acutely toxic and influences the bacterial strains by inhibiting cell
division with a greater inhibitory effect on DNA synthesis (Cieśla et al 1974). Sodium azide
targets the central nervous system in humans and it is also a cytochrome oxidase inhibitor which
is a nitriding agent and an inhibitor of terminal oxidation (PubChem, n.d.).

A bacterial mutagen, 2-nitrofluorene, and mitomycin, a chemotherapy drug, will modify the
Salmonella strains to induce reversion via frameshift mutations. (Molina & Peterson, 1980).
Mitomycin is a highly reactive bis-electrophilic intermediate when converted upon reduction and
this allows it to alkylate cellular nucleophiles (Paz et al., 2012). However, due to the decision to

 15
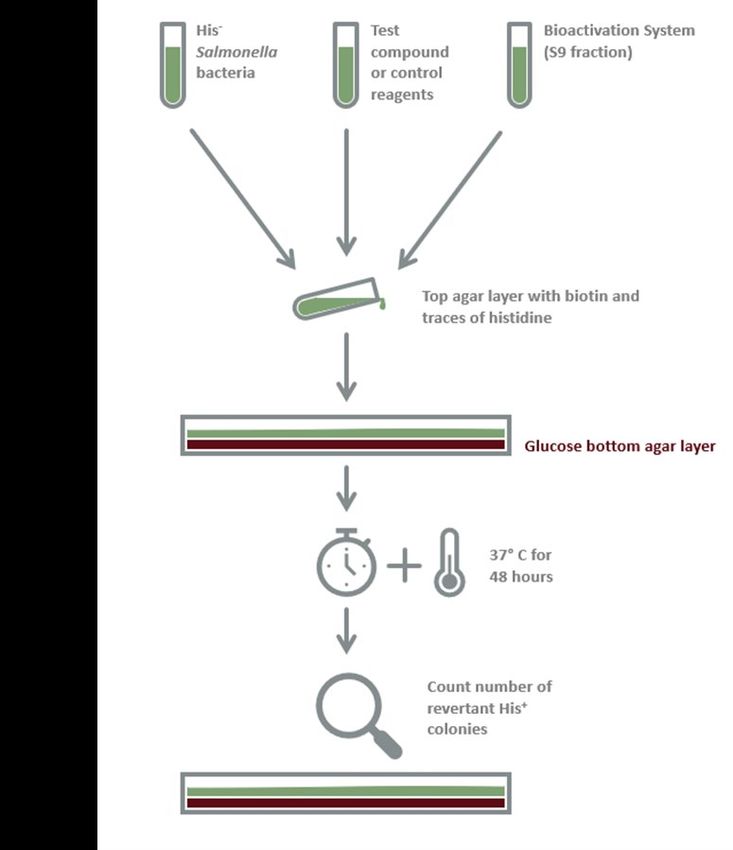
Jessica Marquez

focus on TA98 and TA100 strains for this project, mitomycin will not be used as it has no effect
on these strains (Hamel et al., 2016). When ingested, 2-nitrofluorene can take a minor metabolic
pathway, which results in the formation of hydroxylated nitrofluorenes; these chemicals,
although not detected individually, appear to be the mutagenic metabolites of 2-nitrofluorene
(Humans, 2014). Then the 2-anthramine mutagen is used for the positive controls with S9 mix,
as this mutagen stimulates mutations in the TA strains and allows the cultures to grow.

Following controls, preparation of minimal glucose agar plates occurs just before they are
needed for culture growth. During experimental procedure mixtures are added to each plate of
TA culture, histidine/biotin (his/bio) solution, test sample or control sample, and S9 mix, as
shown in the diagram of the Ames test in Figure 3 below.

 16
Jessica Marquez

 Figure 8 The overall process of the Ames test

The plates are then covered with sterile aluminum foil to protect the light sensitive biotin in the
samples and the plates are incubated for 48 hours at 37° C. After 48 hours, natural revertants are
visible to the naked eye and can be counted and easily compared with test samples. Once the
procedure is finished, the number of colonies on the test plates are compared to those on the
negative control and analyzed as described in section 3.4.

1.5 TA Strains

Each strain of TA has different histidine mutations that allow them to detect a range of
mutagenic agents with different mechanisms of action. These mutations make the TA more
susceptible to mutations that ease the testing process such as uvrB deletion, that with the
exception of TA102, codes for the DNA repair system (Mortelmans, 2019). These histidine
auxotrophic mutants should be analyzed for their spontaneous mutation rate before use, and
strains should be checked before each experiment as each strain can react differently. For
example, TA102 is biotin independent and will grow regardless of biotin levels (Mortelmans,
2019).

There are also deep rough (rfa) marker mutations for strains that cause a defective
lipopolysaccharide layer of the bacterial surface, which allows larger MW chemicals to readily
permeate the membrane of these strains (Mortelmans & Zeiger, 2000). In TA1535 and TA1538,
the introduction of plasmid pKM101 results in the corresponding isogenic strains of TA100 and
TA98 also with strains TA97, TA102, and TA104 (Mortelmans & Zeiger, 2000). This mutation
also enhances chemical mutagenesis due to the increase in a recombinational DNA repair
mechanism, which often results in errors.

Table 3 shows common TA strains and their specific histidine mutation. With each mutation is a
reversion event that explains how the mutagen would have to affect the bacteria in order to revert
the bacteria to its his+ form.

 17
Jessica Marquez Table 4 The genotype of TA strains Strain Histidine Reversion Event Target DNA Plasmid R-factor Mutation TA98 D3052 Frame shift CGCGCGCG pKM101 +R CGC GCG C GCG CG TA100 G46 Base Pair Substitution GGG pKM101 +R GAG/CTC GGG/CCC TA102 G428 Transition/Transversion TAA pKM101, +R TAA TTA pAQ1 One of the differences between TA102 and the others is that its target DNA has AT base pairs instead of GC. The mutation resides on the multi-copy pAQ1 in TA102 and this becomes a good marker for the presence of plasmid due to the tetracycline resistance it confers (Mortelmans & Zeiger, 2000). For this study testing Artemisia extracts and pure artemisinin, TAs with a base pair substitution and frameshift will be chosen that also have pKM101 plasmid mutations as shown in Table 3. TA100 and TA98 strains were shown sufficient in identifying about 90% of the mutagens in a selection of chemicals where 36% were mutagenic (Zeiger et al., 1985). Therefore, TA100 and TA98 will be used. 1.6 Ames mutagens Mutagens used for Ames testing depend on the bacterial strain used, therefore in this project the mutagen 4-nitroquinoline 1-oxide (4NQO) will be used as it has a strong effect on both TA100 and TA98 (Hamel et al., 2016). This chemical is highly mutagenic and carcinogenic and is able to mimic the effects of ultraviolet light on numerous living organisms by binding covalently to cellular macromolecules (Ikenaga et al., 1975). 18
Jessica Marquez

This molecule becomes mutagenic when metabolized by the bacteria into 4-
hydroxyaminoquinoline 1-oxide, which forms large purine adducts that can be corrected by
nucleotide excision repairs. In TA100, 4NQO completes a base pair substitution at the histidine
 mutation site G46. For TA98, this compound makes
 a frame shift on D3052.

 The molecular formula for this compound is
 C9H6N2O3 and is a quinoline N-oxide that carries a
 nitro substitution at position 4 as seen in Figure 4
 (PubChem, n.d.). This compound is a yellow solid
 and does not solubilize easily in water and therefore
 when the compound is prepared for testing as the
 positive control it needs to be dissolved in DMSO
 before being added to the mix.

 Figure 9 4-Nitroquinoline 1-oxide
 (4NQO)

1.7 Multi-well Ames Test

Along with the plate tests, there is another option for a multi-well system, which although more
costly for materials, allows quicker results with less waste. This test follows the same logic as the
normal Ames test by finding mutagenic properties in tested substances by finding reversions in
Salmonella samples. The major difference with this test is that the data collection at the end of
the incubation process is done by counting how many wells have changed color via a pH
indicator rather than counting colonies on plates.

A drop in pH during this test is a metabolic signal of replicating bacteria, which would only
occur if the bacterial strain mutated to his+. Due to the ability to easily replicate tests with this
process, it is faster for comparing a variety of TA strains against possible mutagenic samples.

1.8 Rationale
Due to the relevancy of A. annua and A. afra as cost-effective antimalarial drugs across the
globe, it is necessary to understand the possible lasting genetic effects they could have on a
person or their offspring. Results of this assay also may impact a request for an Investigational
New Drug (IND) FDA approval.

In a double-blind, randomized clinical trial with over 900 patients, A. annua and A. afra were
found to be more effective and with far fewer adverse side effects than one of the several the
medications currently used to treat malaria, artesunate-amodiaquine (Munyangi et al., 2019).

 19
Jessica Marquez

With broad availability and efficacy, these two plant species could cost effectively treat millions
of people, so it is important to be sure of possible long-term effects before using it on large
numbers of ill people.

 20
Jessica Marquez

2.0 Hypothesis and Objectives
2.1 Hypothesis

A. annua and A. afra have been used throughout history and have a good reputation as herbal
medicines. They have also been used in multiple clinical trials with no negative outcomes and
often performed better than the synthesized artemisinin derivatives. Additionally, the Ames
results for artemisinin and its derivatives were negative, which supports the probability of both
Artemisia species also not being mutagenic. Therefore, I anticipate that the Ames test will
validate that the plant extracts are non-mutagenic.

2.2 Objectives

 1. Determine the concentration of A. annua and A. afra teas that are non-mutagenic and safe
 for human consumption by measuring the extremes of toxicity for both plant species.

 2. Compare mutagenic results of both Artemisia sp. with artemisinin.

 21
Jessica Marquez

3.0 Methodology
3.1 Plant Materials

Samples of Artemisia annua SAM cultivar (voucher MASS 00317314) garden harvested in 2018
and A. afra SEN cultivar (voucher LG0019529) harvested August of 2016 will be used to make
tea for this test with a range of dilutions. Following the drug administration in the large scale
clinical trial to cure malaria, the standard dilution will be 5 g of dried plant matter per 1 L of
water (Munyangi et al., 2019). Along with this dilution, samples at 10 and 15 g/L of water will
also be tested and depending on the results, the range of dilutions may change during
experimentation to find possible upper and lower extremes of toxicity.

3.2 Bacterial strains and their cultivation

TA strains were chosen as shown in section 1.3 and they can be purchased either in kits for the
multi-well assay or separately from companies such as MolTox at
http://moltox.com/index.php?main_page=index&cPath=5_27. It should be noted that these
strains of Salmonella are very sensitive and accidental contamination can result in skewed
mutagenic results or loss of the bacterial strain.

3.3 Protocol

For each assay, a set of diluted A. annua and A. afra teas was prepared at the concentrations of 5
g, 10 g, and 15 g/L each. Each experiment had at least three replicate plates and would be
compared to literature for mutagenicity of artemisinin samples. Since full liter samples were not
needed, 200ml of tea infusion samples were prepared and frozen at 4°C for use.

Prior to beginning the assay, preparations of the TA strains are necessary. A fresh colony of each
of the S. typhimurium strains TA 98 and 100 were inoculated into nutrient broth 15-18 hours
prior to performing the experiment. Each strain was grown separately in 10 ml Erlenmeyer
flasks. These samples of liquid culture were incubated at 37°C for at least 12 hours in an
incubator shaker at 120 rpm for aeration to achieve 1 x 10⁹ bacterial cells. Samples were taken
and measured for their optical density at 600nm and 650nm to reach between 0.8 and 1 OD,
respectively.

Fresh mutagen solutions should be prepared for each experiment. These solutions are used for
the positive controls in the experiments without S9 mix and requiring 1 µg/ml 4NQO. The recipe
for this mutagen is listed in Appendix A, section 9.1.8.

Following this, preparation of the minimal glucose agar plates is done just before use with 900ml
of distilled water, 15g of agar, 20ml of 50x VB salts, and 50ml of 10% glucose all per liter of the
final solution as shown in Appendix A section 9.1.6. Of this solution, 25 ml should be poured

 22
Jessica Marquez

into each Petri dish and once each gel cools and solidifies, the plates can be stored in sealed
plastic bags at 4°C for several weeks and be allowed to warm to room temperature before use.
Also note that if the plate shows excess moisture before use, they can be left in a stationary
incubator at 37°C overnight.

In labeled, sterile glass tubes, 0.5 ml of sodium phosphate buffer, 0.05 ml test sample or control
sample, and 0.1 ml TA culture were added and mixed. If working with S9, the metabolic
activation mix would be added in place of the sodium phosphate buffer. The 0.05ml of positive
control is made up of 0.045ml of distilled water, and 5µl of 4NQO solution. However, because
the 4NQO solution is composed of mostly DMSO as shown in the recipe in Appendix A, another
control was made for DMSO, which comprised of 45.5µl distilled water and 4.5µl of DMSO to
reach the same final concentration of DMSO as the positive control.

Each test tube was mixed and then its contents incubated at 37°C for 20 minutes. Then, 2ml of
melted top agar maintained between 43°C and 48°C is mixed into each test tube and poured onto
a Petri plate and spread across the surface using an L-shaped spreader. Once the agar solidified
(~ 3 minutes), the plates were inverted and left in the incubator for 48 hours at 37 °C. At this
point, revertant colonies are visible and can be counted and compared easily.

3.4 Analysis

After incubation for 48 hours, the number of colonies on the test plates were compared to those
on the negative control plates. If there is mutagenic activity, the concentration of the tested
sample should increase in a dose-dependent manner, and a mutagenicity ratio (MR) is calculated
(Vijay et al., 2018).

The number of revertant colonies per plate are counted and then applied to the formula below to
find the MR of the test sample (Maron & Ames, 1983)

 =

A positive MR > 2.0 implies a mutagenic result, and a negative MR < 2.0 implies a non-
mutagenic result (Vijay et al., 2018).

3.5 Statistical analysis

Once colonies were counted and recorded for each section, statistical analysis was performed
using the ANOVA method with a significance of p ≤ 0.05. The averages of each section for a test
where calculated and from these values, the sums of squares, degrees of freedom, mean squares,
between treatments, and errors were determined. The F statistic was computed by taking the ratio
of the between treatment variability to the error variability and determines the validity of the

 23
Jessica Marquez

hypothesis. Here ANOVA was used to determine how similar each test would be to the negative
control.

4.0 Anticipated Results
4.1 Mutagenic

A. annua and A. afra contain flavonoids that are harmful when ingested in high concentrations
such as camphor, therefore, the higher the concentration of tea being tested the more likely there
may be an increase in mutagenicity. This experiment will most likely result in showing a slow
upward curve of mutagenicity for all tested extracts with most of the dilutions showing little to
no mutagenicity at all.

Considering that the plant has been used for centuries with no reported long-lasting negative
effects, it is expected there will be no mutagenicity of the plant extracts. If there is no
mutagenicity detected in this assay, these results will be able to support the promotion of future
research into safe uses for A. annua and A. afra and their derivatives.

4.2 Unanticipated Results

There is still a possibility that this mutagenicity assay will show that the teas are mutagenic in
nature, which may cause detrimental side effects in people. If the Artemisia samples do show
mutagenicity it will most likely be at higher concentrations, which would reveal that there is an
upper limit to the concentration allowed for use before it becomes harmful through its potential
mutagenicity.

 24
Jessica Marquez

5.0 Results
While this assay was cut short due to the coronavirus pandemic, assays were completed at least
once for each combination of TA strains and test compound. The raw data collected each have an
average number of colonies on the test sections that were similar if not equal to the collected data
for the negative control, therefore, this suggests there was no mutagenicity before any analysis or
calculations are done.

5.1 Raw Data

As stated in the methods, each test should have at least three replicates per section. To save space
and time the number of replicates was reduced to three from the original four replicates of the
first test. In each table the bacterial strain and either A. annua SAM or A. afra SEN cultivar are
labeled at the top. The sections are divided up by the contents of each plate and then counted for
the number of colonies on each plate.

For the positive control plates, the plate was divided into four quarters and one quarter was
counted before being multiplied by four. This is acceptable due to the fact that there were large
numbers of colonies (too numerous to fully count), and colonies tended to grow evenly across
the plates. Furthermore, the specific number of colonies per positive control plate was not
necessary information for MR calculations. Rather, the positive control is a test to compare the
high extreme of what a highly mutagenic compound would produce and ensure that implied non
mutagenicity by the test compounds is not a result of defective bacteria that could not be
mutated.

 Table 5 TA100 SAM

 Negative 1g/200mL tea 2g/200mL tea 3g/200mL tea Positive DMSO
 Control (ct) (ct) (ct) (ct) Control (ct) Control (ct)
 9 9 12 7 319 10
 9 10 11 12 372 12
 10 6 12 8 320 10
 15 17 9 11 440 N/A

 Table 6 TA98 SAM

 Negative 1g/200mL tea 2g/200mL tea 3g/200mL tea Positive DMSO
 Control (ct) (ct) (ct) (ct) Control (ct) Control (ct)
 4 7 3 4 375 4
 12 8 7 8 320 11
 7 7 13 11 423 3

 25
Jessica Marquez

 Table 7 TA98 SAM

 Negative 1g/200mL tea 2g/200mL tea 3g/200mL tea Positive DMSO
 Control (ct) (ct) (ct) (ct) Control (ct) Control (ct)
 7 6 5 8 440 8
 8 13 11 10 318 7
 8 7 7 4 483 4

 Table 8 TA100 SEN

 Negative 1g/200mL tea 2g/200mL tea 3g/200mL tea Positive DMSO
 Control (ct) (ct) (ct) (ct) Control (ct) Control (ct)
 8 6 4 5 324 4
 8 6 7 6 419 8
 14 7 11 12 380 9

 Table 9 TA98 SEN

 Negative 1g/200mL tea 2g/200mL tea 3g/200mL tea Positive DMSO
 Control (ct) (ct) (ct) (ct) Control (ct) Control (ct)
 8 9 11 13 389 7
 13 12 16 14 415 16
 12 8 5 11 355 11

5.2 MR Ratio

The mutagenicity ratio discussed in section 3.4 was used to complete ratios for each test. First
the average of all the plates per tea section of one test repetition was taken, then each dilution
colony average was compared to the negative control average of that test repetition. If each test
dilution showed no implied mutagenicity, the test was averaged as non-mutagenic. Table 9
shows the results of these tests as all MRs were calculated to be less than two and often
determined to be very close to a MR of one which suggests that there is no difference in
mutagenicity between the tea dilutions and distilled water.

 26
Jessica Marquez

 Table 10 Mutagenicity Assay Results (n≥3)

 Treatment Set Average MR ± SE Mutagenicity

 TA 98 w A. annua 1.05 ± 0.09 None

 TA 98 w A. afra 1.03 ± 0.12 None

 TA 100 w A. annua 0.98 ± 0.07 None

 TA 100 w A. Afra 0.71 ± 0.05 None

As expected and discussed in section 4.1, these findings imply that A. annua and A. afra are non-
mutagenic.

6.0 Discussion
This study suggested that Artemisia annua and A. afra are not mutagenic However, more tests
need to be done to ensure non-mutagenicity, especially regarding how the infusions could react
once metabolized by liver microsomes. While the phytochemicals extracted in A. annua
infusions inhibit the liver CYP450 enzymes that metabolize artemisinin, almost nothing is
known about its tissue distribution and elimination (Desrosiers et al., 2020). Further investigation
on these findings would likely support an absence of mutagenicity although FDA approval likely
would require mutagenicity testing with liver microsomes. When completing a mutagenicity test
to the standards of the FDA as a decision marker for safety of human consumption, more than
two strains of bacteria should be used. For the test to be completed fully, S9 liver microsomes
are needed to show how it would possibly interact with CYP450s. However, further testing
should also show no mutagenicity based on the results of this project. These additional steps will
be necessary for these affordable and accessible anti-malarial treatments to gain approval for
widespread use.

Further investigation should be made with the liver S9 mix, which is liver tissue homogenate in
which S9 hepatocytes minimize the mammalian metabolic activation formed in the liver that
accounts for how drug interactions with the liver can make the drug more mutagenic (Vijay et
al., 2018). The addition of this mix with TA strains shows how a substance might be
carcinogenic in humans.

As the individual compounds found in both species of Artemisia have shown no mutagenicity,
the further testing of all compounds through these infusions has implied that synergistically they

 27
Jessica Marquez

also would not show any mutagenic effects as well. Even with the discussed LD50s of each
compound in the plant, when ingested they would not approach toxic concentrations.

While there are certain phytochemicals in both Artemisia sp. which are toxic in high
concentrations, such as camphor, within the tea infusions they do not reach harm inducing levels.
For example, the LD50 of camphor is 1310 mg/kg when delivered orally to a mouse, whereas
concentration of camphor in A. annua leaves obtained from various places ranged from 100
mg/kg of leaf to 600 mg/kg (Rosine Desiree et al., 2016). Because doses are made at 5g of leaves
per liter of water in clinical trials, the concentration of camphor stays far below dangerous
concentrations.

Similarly, with chlorogenic acid, which is commonly found in black and green teas (Camellia
sp.), the levels of concentration necessary to reach health threats would not be attained through
the Artemisia sp. tea infusion doses. The LD50 as stated in section 1.1.1, is 10 mg/kg via
intraperitoneal injection in rats. For higher concentrations of tea, this might be a factor in
mutagenicity. In a regular dose, this would not reach high enough concentrations to become an
issue. One might consider multiple doses could reach potentially harmful levels, however that is
unlikely as chlorogenic acid, found at high levels in black tea, is processed a few hours in the
liver.

One monoterpene, thujone, found in A. afra is toxic in high amounts and has a LD50 of 192
mg/kg in rats from a α- and β-thujone mixture. In A. annua, thujone is not found unless extracts
are cross contaminated with A. afra.

While the basic ratio of mutagenicity is optimistic, further analysis is necessary to prove that this
possible conclusion is viable. In order to determine whether the data collected is enough to
suggest non-mutagenicity the Analysis of Variance or the ANOVA method was used.

6.1 ANOVA

The ANOVA method is used when the hypothesis is about a difference in means between more
than one type of treatment. This method is the correct choice because this project is testing for a
lack of effect. In other words, the null hypothesis for this project is that the means of the counts
in the different treatments are different. If that null hypothesis is rejected, then the alternative
hypothesis that the means are the same can be accepted.

The procedure for the ANOVA method is similar to other variance methods but is made more
difficult because there are several different treatments that need to be tested. This means that the
calculations need to consider sizes, standard deviations, and means for each comparison group
and then between every comparison group.

 28
Jessica Marquez

The ANOVA method was used with a 95% confidence interval. This method uses sum-of-
squares to determine variance, so it is distributed in an F-distribution. Because of this, the
ANOVA method uses an F score to reject or accept the null hypothesis.

The ANOVA tables for the four different treatments are shown below, in Tables 10, 11, 12, and
13. The F-values on the far right are compared to a critical F value that is calculated separately.
The claims made in Table 9 that none of the treatments resulted in mutagenicity is derived from
the relationship between the F value and the critical value. Increasing the number of data points,
the confidence interval could be improved.

6.1.1 Error and Uncertainty

The error and uncertainty of this project in part came from the bacteria itself. The TA strains of
bacteria are destabilized to allow mutations to easily occur. This is what allows the negative
control plates to still have colonies living on the plate from mutating on their own. This mutation
is somewhat at random but occurs in low amounts which is how the test matter can be tested for
both the spontaneous revertants that happen naturally and the induced revertants which are
created from the test materials mutagenic influence.

7.0 Conclusion
No mutagenicity of either A. annua or A. afra tea infusions however further studies are needed.
This study found no mutagenicity in either A. annua or A. afra. Limitations in sample size and
sampling precision mean that more studies will be needed in order to conclusively determine the
mutagenicity of A. annua and A. afra. In order to meet FDA approval for medicinal use of A.
annua and A. afra, studies will need to adhere to specific FDA guidelines around mutagenicity
assays. Because this study was able to demonstrate the statistical significance of its results, it
preliminary evidence of safety and can be considered a good model for further studies.

 29
Jessica Marquez

8.0 Cited references
Artemether (CHEBI:195280). (n.d.). Retrieved June 6, 2020, from
 https://www.ebi.ac.uk/chebi/searchId.do?chebiId=CHEBI:195280

Artemether (CHEBI:195280). (n.d.). Retrieved June 6, 2020, from
 https://www.ebi.ac.uk/chebi/searchId.do?chebiId=CHEBI:195280

Cieśla, Z., Mardarowicz, K., & Klopotowski, T. (1974). Inhibition of DNA synthesis and cell
 division in Salmonella typhimurium by azide. Springer-Verlag.
 https://doi.org/10.1007/BF00271148

Clifford, M. N. (2000). Chlorogenic acids and other cinnamates – nature, occurrence, dietary
 burden, absorption and metabolism. Journal of the Science of Food and Agriculture,
 80(7), 1033–1043. https://doi.org/10.1002/(SICI)1097-0010(20000515)80:73.0.CO;2-T

Cumming, J. N., Ploypradith, P., & Posner, G. H. (1996). Antimalarial Activity of Artemisinin
 (Qinghaosu) and Related Trioxanes: Mechanism (s) of Action. In J. T. August, M. W.
 Anders, F. Murad, & J. T. Coyle (Eds.), Advances in Pharmacology (Vol. 37, pp. 253–
 297). Academic Press. https://doi.org/10.1016/S1054-3589(08)60952-7

Desrosiers, M. R., Mittleman, A., & Weathers, P. J. (2020). Dried Leaf Artemisia Annua
 Improves Bioavailability of Artemisinin via Cytochrome P450 Inhibition and Enhances
 Artemisinin Efficacy Downstream. Biomolecules, 10(2), 254.
 https://doi.org/10.3390/biom10020254

Efferth, T. (2007). Willmar Schwabe Award 2006: Antiplasmodial and Antitumor Activity of
 Artemisinin - From Bench to Bedside. Planta Medica, 73(04), 299–309.
 https://doi.org/10.1055/s-2007-967138

Ferreira, J. F. S., Luthria, D. L., Sasaki, T., & Heyerick, A. (2010). Flavonoids from Artemisia
 annua L. as Antioxidants and Their Potential Synergism with Artemisinin against Malaria
 and Cancer. Molecules, 15(5), 3135–3170. https://doi.org/10.3390/molecules15053135

Goodger, J. Q. D., Cao, B., Jayadi, I., Williams, S. J., & Woodrow, I. E. (2009). Non-volatile
 components of the essential oil secretory cavities of Eucalyptus leaves: Discovery of two
 glucose monoterpene esters, cuniloside B and froggattiside A. Phytochemistry, 70(9),
 1187–1194. https://doi.org/10.1016/j.phytochem.2009.06.004

Gruessner, B.M., Cornet-Vernet, L., Desrosiers, M.R., Lutgen P., Towler, M.J., Weathers P.J. It
 is not just artemisinin: Artemisia sp. for treating diseases including malaria and
 schistosomiasis. Phytochem Rev (2019) 18:1509-1527.

 30
You can also read