Network-based protein structural classification
←
→
Page content transcription
If your browser does not render page correctly, please read the page content below
Network-based protein structural classification
                                            Khalique Newaz1,2,3 , Mahboobeh Ghalehnovi1,+ , Arash Rahnama4,+ , Panos J. Antsaklis4 ,
                                            and Tijana Milenković1,2,3,*
                                            1 Department   of Computer Science and Engineering, University of Notre Dame, Notre Dame, IN 46556, USA
                                            2 InterdisciplinaryCenter for Network Science and Applications, University of Notre Dame, Notre Dame, IN 46556,
                                            USA
arXiv:1804.04725v7 [q-bio.MN] 15 Mar 2020

                                            3 Eck Institute for Global Health, University of Notre Dame, Notre Dame, IN 46556, USA
                                            4
                                              Department of Electrical Engineering, University of Notre Dame, Notre Dame, IN 46556, USA
                                            * Corresponding author (email: tmilenko@nd.edu)
                                            + These authors contributed equally to this work

                                            Experimental determination of protein function is resource-consuming. As an alternative, computational prediction of protein
                                            function has received attention. In this context, protein structural classification (PSC) can help, by allowing for determining
                                            structural classes of currently unclassified proteins based on their features, and then relying on the fact that proteins with
                                            similar structures have similar functions. Existing PSC approaches rely on sequence-based or direct 3-dimensional (3D)
                                            structure-based protein features. In contrast, we first model 3D structures of proteins as protein structure networks (PSNs).
                                            Then, we use network-based features for PSC. We propose the use of graphlets, state-of-the-art features in many research
                                            areas of network science, in the task of PSC. Moreover, because graphlets can deal only with unweighted PSNs, and be-
                                            cause accounting for edge weights when constructing PSNs could improve PSC accuracy, we also propose a deep learning
                                            framework that automatically learns network features from weighted PSNs. When evaluated on a large set of ∼9, 400 CATH
                                            and ∼12, 800 SCOP protein domains (spanning 36 PSN sets), the best of our proposed approaches are superior to existing
                                            PSC approaches in terms of accuracy, with comparable running times.

                                            1     Introduction
                                            1.1    Motivation and related work.
                                            Proteins are major molecules of life, and thus understanding their cellular function is important. However, doing so experi-
                                            mentally is costly and time-consuming1. Instead, computational approaches are often used for this purpose, which are much
                                            more efficient because they leverage on the fact that (sequence or 3-dimensional (3D)) structural similarity of proteins often
                                            indicates their functional similarity2 ; note that here we refer to as broad notion of protein structural similarity as possible, i.e.,
                                            as captured by any existing method. One type of such computational approaches is protein structural classification (PSC)3.
                                            PSC uses structural features of proteins with known labels (typically CATH4 or SCOP5 structural classes) to learn a classifi-
                                            cation model in a supervised manner (i.e, by including the labels into the process of training the model). Then, the structural
                                            feature of a protein with unknown label can be used as input to the classification model to determine the structural class of the
                                            protein. This information can in turn be used to predict function of a protein based on functions of other proteins that belong
                                            to the same structural class as the protein of interest. In this paper, we focus on the PSC problem.
                                                Note that there exists a related computational problem which can help with protein function prediction – that of protein
                                            structural comparison6. However, unlike PSC: 1) protein structural comparison uses structural features of proteins with known
                                            or unknown labels in unsupervised rather than supervised manner (i.e., it ignores any potential label information), and 2) it
                                            uses the features to compute pairwise similarities between the proteins in hope that highly-similar proteins will have the same
                                            label (where the labels are used only after the fact), rather than predicting the label of a single protein. In other words, both the
                                            goals and working mechanisms of PSC and protein structural comparison are different. Hence, the two approach categories
                                            are not comparable to and cannot be fairly evaluated against each other.
                                                Since proteins with high sequence similarity typically also have high 3D structural and functional similarity, traditional
                                            PSC approaches have relied only on sequence-based protein features7, 8 . A popular baseline (i.e., naive) sequence feature
                                            is the amino acid composition (AAComposition), which measures relative composition of different amino acid types in a
                                            protein sequence6. Another popular still baseline though somewhat more comprehensive sequence feature is the di-amino
                                            acid composition (DAAComposition), which measures relative composition of different ordered di-amino acid combinations
                                            in a protein sequence9. Some other, even more comprehensive sequence features include the position-specific scoring matrix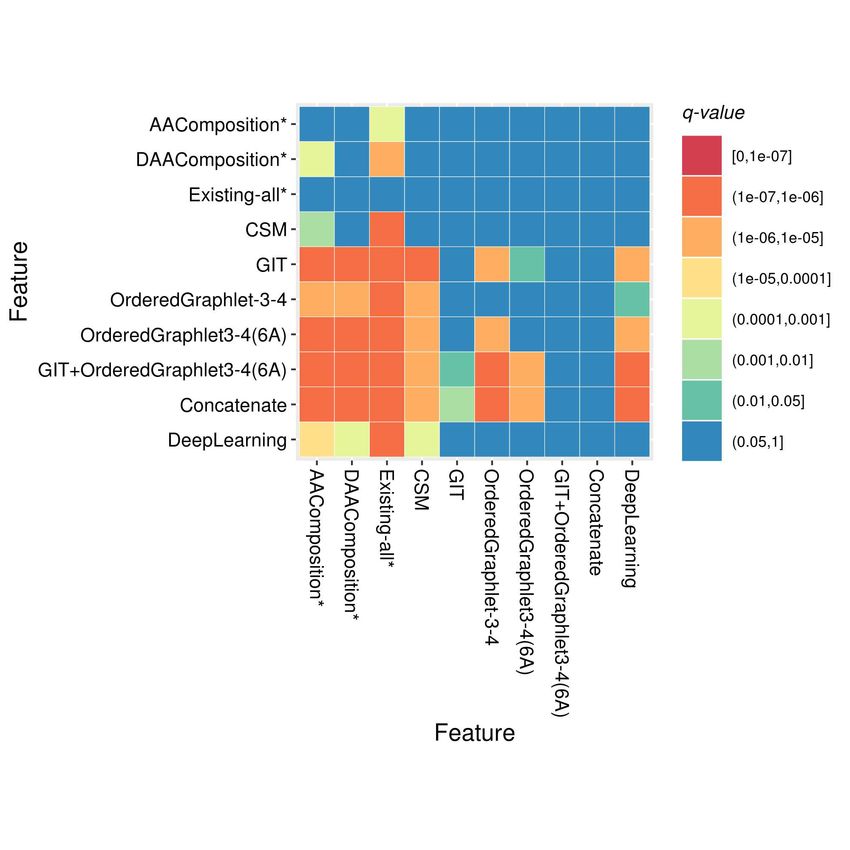
(PSSM)10 , three-state secondary structure (SS) profile11, and Hidden Markov Model (HMM) profile12 , all of which were
recently used by a PSC approach called SVMfold7 . SVMfold integrates the above three sequence features to represent a
protein sequence and then uses support vector machine (SVM) as the classification algorithm to perform PSC. Among the
most recent sequence-based PSC approaches are MV-fold13 and DeepFR14 . MV-fold integrates four sequence features: the
same three sequence features that are also used by SVMfold, plus some physicochemical information in the form of pseudo
amino acid composition (PseAAC). DeepFR predicts contacts between residues of a protein sequence and then uses these
predicted contacts along with a deep convolutional neural network for PSC. SVMfold, MV-fold, and DeepFR methods were
compared against each other in the MV-fold study. MV-fold was comparable to SVMfold and it outperformed DeepFR. So,
SVMfold is still among the best sequence-based protein features.
     Although sequence features have been extensively used for the purpose of PSC, it has been argued that proteins with
low sequence similarity can still show high 3D structural and functional similarity15 . On the other hand, proteins with high
sequence similarity can have low 3D structural and functional similarity16. Hence, PSC based on 3D-structural as opposed to
(or in addition to) sequence features could more correctly identify the structural class of a protein17.
     Typically, 3D-structural approaches extract features directly from the 3D structures of proteins and then use these direct
3D structural features (i.e., coordinate positions of the atoms in the 3D space) to compare proteins17, 18 . Interestingly, recent
3D-structural PSC approaches have focused on classification based on protein pairs3, 19, 20 . For example, they consider a pair
of protein structures – one with known label (class) and the other one with unknown label, and if the proteins are similar
enough in terms of their 3D-structural (and possibly also sequence) features, they assign the known label of the currently
classified protein to the currently unclassified protein. As such, these approaches fall somewhere in-between PSC (because
both are supervised, but PSC analyzes a single protein at a time) and protein structural comparison (because both focus on
protein pairs, but protein structural comparison is unsupervised). Therefore, they are not comparable to and cannot be directly
evaluated against approaches that solve the PSC problem as defined in our study.
     In addition, several fully unsupervised approaches have also been proposed that use 3D-structural features to compare
protein structures21, 22 . For example, recently, a 3D-structural feature called Tuned Gauss Integrals (GIT)23 was used to
cluster proteins into structurally similar groups22.
     In contrast to the direct 3D-structural features, protein 3D structures can first be modeled using protein structure networks
(PSNs), in which nodes are amino acids and edges link amino acids that are spatially close enough to each other. Then,
network-based features can be extracted from the PSNs and used in the task of PSC. A popular concept in this regard is
the notion of protein contact maps24 , which are nothing but an alternative representation of PSNs. A contact map is the
representation of an n amino acid-long 3D protein structure into an n × n 2-dimensional matrix C. In a contact map C, Ci j has
a value of 1 if the amino acids i and j are within a pre-defined distance cutoff, i.e., they are in contact, and 0 otherwise. A
recent approach that used contact map-based features for PSC is the cutoff scanning matrix (CSM)25 .
     Unlike contact maps that are “simple” network representations, there exists a different category of PSN features that are
based on graph-theoretic concepts, i.e., that measure different network properties. One such baseline PSN feature is Existing-
all, which integrates seven network properties to represent a PSN6 . Another popular PSN feature that counts different types of
network patterns is the concept of graphets; graphlets are subgraphs or small lego-like building blocks of complex networks26.
     We believe that the graph-theoretic PSN-based PSC is promising. This is because we recently proposed an unsupervised
protein structural comparison approach called GRAFENE that relies on graphlets as PSN features of a protein6. Given a set
of PSNs as input, GRAFENE first extracts different versions of graphlet features from each PSN. Then, it quantifies structural
similarity between each pair of the PSNs by comparing their features in an unsupervised manner. GRAFENE outperformed
other state-of-the-art 3D-structural protein comparison approaches, including DaliLite27 and TM-align28.
     In this work, we use the graphlet-based PSN features for the first time in the task of supervised PSC, with a hypothesis
that they will improve upon state-of-the-art non-graphlet PSN features and non-PSN features that have traditionally been used
in this task. Note that there exists a supervised approach that used graphlets to study proteins29. However, it did so in the task
of functional classification of amino acids, i.e., nodes in a PSN, rather than in our task of structural classification of proteins,
i.e., PSNs. Also, this approach only used the concept of regular graphlets, while we also test a newer concept of ordered
graphlets30 (see Methods), which outperformed regular graphlets in the GRAFENE study6 .
     In general, a PSC approach comprises of two key aspects: 1) a method to extract features from a protein structure and 2)
selection of a classification algorithm to be trained based on the features (and protein labels). Hence, existing PSC approaches
can be divided into two broad categories. The first category includes approaches that focus on improving a classification
algorithm by relying on existing features31–33 . The second category includes approaches that extract novel features to predict
the structural class of a protein by relying on existing classification algorithms7, 34, 35 . Our study belongs to the second category,
since our goal is to evaluate graphlet features against other state-of-the-art PSC features in a fair evaluation framework, i.e.,
under the same (representative) classifier, without necessarily aiming to find the best classifier.

                                                                                                                                 2/19
1.2 Our contributions
We propose a PSC framework called NETPCLASS (network-based protein structural classification). As one part of our
framework, we suggest the use of graphlet- and thus PSN-based protein features in the PSC task under an existing classification
algorithm. As another part of our framework, we aim to achieve the following. Existing PSN definition links with unweighted
edges those pairs of amino acids whose 3D spatial distance is below some predefined cutoff. Current graphlets can deal with
such edge-unweighted networks. We hypothesize that PSC can benefit from including the actual spatial distances as edge
weights. However, availability of sophisticated network (e.g., graphlet-based) methods for extracting features from weighted
networks is limited, and developing such methods is a non-trivial task. So, to evaluate this hypothesis, the best we can currently
do is to model a PSN as a simple weighted adjacency matrix and then develop a deep learning-based PSC approach to extract
features from such a matrix automatically.
More details about our study are as follows:
1. We evaluate, in the task of PSC, nine versions of graphlet features that were already used for unsupervised protein
structural comparison6. In addition, in the same task, we evaluate a non-graphlet network (Existing-all) feature6, a
recent contact map-based (CSM) feature25, a recent 3D-structural (GIT) feature22, a state-of-the-art sequence (SVMfold)
feature, and two baseline sequence features (AAComposition and DAAComposition)6, 9 . We use the same, reasonably
chosen, classification algorithm for each of the above 15 features to learn (train) their classification models, in order
to fairly compare their performance. By reasonably chosen, we mean a well-performing conventional classification
algorithm. It has been observed that in situations where we already have a well-performing feature under a conventional
classification algorithm, non-conventional (e.g., deep learning-based) classification algorithm might not provide that
much of a performance boost compared to the conventional one36 . Also, it is well known that using non-conventional
classification algorithm (e.g., deep convolutional neural networks or recurrent neural networks) would come at a cost
of much larger computational time. So, we believe that in order to evaluate the meaningfulness of graphlets over
the existing state-of-the-art PSC features, which is the key task of our paper, there is no need to use more complex
classification algorithms. Here, as a proof-of-concept, we use a simple yet powerful logistic regression (LR) classifier,
whose output indicates, for the given input protein and each class, the likelihood that the protein belongs to the given
class. Note that in initial stages of our evaluation, in addition to LR, we considered an SVM classifier. We found that
using SVM showed no improvement compared to using LR (under same features and on same PSN data) in terms of
accuracy, while at the same time it was slower. So, we had no reason to continue using SVM.
2. Since the different categories (i.e., sequence, 3D structural, or PSN-based) of protein structural features can provide
complementary information, we combine the individual features to form new integrated features and evaluate these
against each of the individual features.
3. Because graphlets are currently designed only for unweighted PSNs, and because the current literature lacks knowledge
on how to efficiently extract meaningful features from a weighted network, we aim to extract such features automatically
via deep learning (DL).
4. We evaluate the considered approaches on a large set of ∼9, 400 CATH and ∼12, 800 SCOP protein domains. We
transform protein domains to PSNs with labels corresponding to CATH and SCOP structural classes, where we study
each of the four levels of CATH and SCOP hierarchies6. Our evaluation is based on measuring how correctly the trained
classification models can predict the classes of labeled proteins in the test data using 10-fold cross-validation.
Our key findings are as follows.
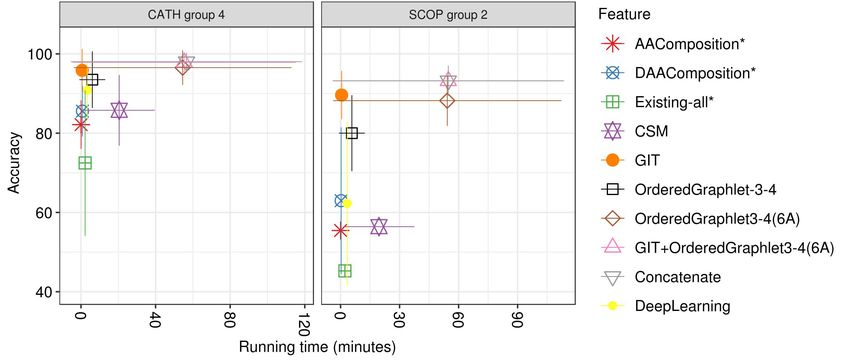
In terms of PSC accuracy, when we compare the individual features, we observe that the best of our graphlet features
outperform all of the other individual features except GIT and SVMfold. However, regarding GIT, while it shows somewhat
superior performance to the graphlet features, GIT is only applicable to proteins, while graphlets are general-purpose network
features and are applicable to many other complex systems that can be modeled as networks. Further, we show that integrating
GIT with the best graphlet feature significantly improves accuracy of each of GIT alone and the graphlet feature alone, which
means that each of the two individual features contributes to the superior performance of their integrated version. Note that
we find that integrating the best of the sequence features with GIT and graphlets does not yield significant improvements.
Regarding SVMfold, while this approach performs well (comparable to the best of our proposed approaches), SVMfold is
orders of magnitude slower than our proposed approaches. In fact, SVMfold is so slow that we were able to run it only on
5.5% of our data. In terms of running time, SVMfold is the slowest, followed by the integrated features, followed by CSM,
and followed by the rest of the features (which are mostly comparable to each other).
Accounting for edge weights in PSNs via DL achieves accuracy that is relatively comparable to accuracy of the individual
unweighted network-based methods. Note that here we are comparing as simple as possible weighted network features (the
3/19simple weighted adjacency matrix) against highly sophisticated unweighted network features (graphlets, which are the state-
of-the-art in network science). So, a comparable accuracy of the former and the latter implies a promise of future weighted
network-based analyses of protein 3D structures (such as developing and using weighted graphlet-based features).
2 Methods
2.1 Data and protein structure network (PSN) construction
First, we use a set of 17,036 proteins that was previously used in the large-scale unsupervised protein structural comparison
GRAFENE study6 . Per this study, this dataset contains all proteins from the Protein Data Bank (PDB)37 that are at most 90%
sequence similar. To identify protein domains, we use two protein domain categorization databases: CATH and SCOP. Note
that we can only use those CATH and SCOP protein domains that are present in our set of 17,036 proteins.
To construct a PSN from a protein domain, we use the PDB files37 , which contain information about the 3D coordinates
of the heavy atoms (i.e., carbon, nitrogen, oxygen, and sulphur) of the amino acids in the domain. In a PSN, nodes are
amino acids of a protein domain and there is an edge between any two nodes if they are sufficiently close in the 3D space.
Clearly, given a protein domain, its corresponding PSN construction depends on 1) the choice of atom(s) of an amino acid to
represent it as a node in the PSN and 2) a distance cutoff between a pair of nodes to capture their spatial proximity. There is no
established knowledge about what choices of node representation and distance cutoff are the best to construct a PSN. Results
of past studies that exclusively evaluated the effect of different choices of node representation and distance cutoff on the
meaningfulness of PSNs/contact maps have largely been contradicting38–41 . For example, in terms of the node representation
choice, Duarte et al.39 identified that β carbon as a node in a PSN captures the 3D structure of a protein more accurately than
the use of α carbon, implying that the choice of which atom type to consider as a node in a PSN matters. On the other hand, da
Silveira et al.40 found that the choice of which atom type to consider as a node in a PSN does not make a difference. Similarly,
in terms of the choice of distance cutoff, while Vassura et al.42 showed that an increase in distance cutoff generally increased
the meaningfulness of PSNs, Duarte et al.39 showed that this is not necessarily the case. So, there seems to exist no consensus
on exactly how to best choose a node representation or distance cutoff value for PSN construction. Nonetheless, our choice of
these parameter values is made somewhat easier in the light of a recent study on unsupervised protein structural comparison
that used the exact same data as we do here6. By considering four different combinations of atom choice and distance cutoff
definitions (any heavy atom with 4Å, 5Å, and 6Å distance cutoffs, and α -carbon with 7.5Å distance cutoff), this study showed
that the choice of atom and distance cutoff did not significantly affect the overall protein structural comparison performance6.
Motivated by this, for most of our analyses, i.e., unless explicitly indicated otherwise, we consider only one of these PSN
construction strategies in our study: we define an edge between two amino acids if the spatial distance between any of their
heavy atoms is within 4Å. Because the choice of a PSN construction strategy only affects PSN-based features, and because as
we will show later that the best of our graphlet features is the best among the considered PSN-based features, for it, we also
use the distance cutoff of 6Å; we will explicitly note whenever 6Å is used instead of 4Å. Note that we also considered the
cutoff of 5Å, but using 6Å was always superior to using 5Å. Hence, for simplicity, we do not report results for 5Å.
Additionally, for most of our analyses, i.e., unless explicitly indicated otherwise, in order to only keep “meaningful” PSNs
for further analysis, we filter the PSNs using an established guideline that is based on network properties of a PSN6 . Namely,
we only keep a PSN if it has 1) a single connected component, 2) a diameter of at least six, and 3) at least 100 nodes (amino
acids) (Supplementary Section S1). Following these criteria, we obtain 9,509 and 11,451 PSNs corresponding to CATH and
SCOP, respectively. Note that in order to fairly compare the considered protein features to each other, we want to focus on
only those protein domains (i.e., PSNs) that can be processed by each of the features. Removal from the above data of those
protein domains that cannot be processed by at least one considered feature results in 9,440 CATH and 11,352 SCOP PSNs
for further analysis. These are the final data that are used throughout the study, unless explicitly told otherwise. Importantly,
in order to evaluate the effect of the above three PSN filtering criteria on our results, for a subset of our analyses, we consider
even those connected PSNs that have diameter less than six or fewer than 100 nodes; we use the resulting data only in Section
3.8.
Given the CATH PSN data, we do the following. First, we test the power of the considered PSC approaches to predict
the following top hierarchical level classes of CATH: alpha (α ), beta (β ), and alpha/beta (α /β ). Note that few secondary
structures is the remaining CATH top hierarchical class, but none of the CATH PSNs belongs to this class, so we do not
consider it. Hence, we take all 9,440 CATH PSNs and identify them as a single PSN set, where the PSNs have labels
corresponding to three top level CATH classes: α , β , and α /β . Second, we compare the approaches on their ability to predict
the second level classes of CATH, i.e., within each of the top-level classes, we classify PSNs into their sub-classes. To ensure
enough training data, we focus only on those top-level classes that have at least two sub-classes with at least 30 PSNs each;
we require the minimum of 30 PSNs in order to have sufficient statistical power in the classification task43 . Three classes
4/19satisfy this criteria. For each such class, we take all of the PSNs belonging to that class and form a PSN set, which results in
three PSN sets. Third, we compare the approaches on their ability to predict the third level classes of CATH, i.e., within each
of the second level classes, we classify PSNs into their sub-classes. Again, we focus only on those second-level classes that
have at least two sub-classes with at least 30 PSNs each. Nine classes satisfy this criteria. For each such class, we take all of
the PSNs belonging to that class and form a PSN set, which results in nine PSN sets. Fourth, we compare the approaches on
their ability to predict the fourth level classes of CATH, i.e., within each of the third level classes, we classify PSNs into their
sub-classes. We again focus only on those third level classes that have at least two sub-classes with at least 30 PSNs each. Six
classes satisfy this criteria. For each such class, we take all of the PSNs belonging to that class and form a PSN set, which
results in six PSN sets.
Thus, in total, we analyze 1+3+9+6=19 CATH PSN sets. For further details on the number of PSNs and the number of
different protein structural classes in each of the PSN sets, see Supplementary Tables S1-S3. We follow the same procedure
for the SCOP PSN data and obtain 1+5+6+4=16 SCOP PSN sets. For more details, see Supplementary Section S2 and
Supplementary Tables S1-S3.
We group each of the 19 CATH PSN sets and and 16 SCOP PSN sets into four PSN set groups, corresponding to the four
hierarchy levels of CATH and SCOP, respectively: group 1 (all 1 + 1 = 2 PSN sets), group 2 (all 3 + 5 = 8 PSN sets), group 3
(all 9 + 6 = 15 PSN sets), and group 4 (all 6 + 4 = 10 PSN sets) (Figure 1).
Figure 1. Hierarchical representation of the 35 CATH and SCOP PSN sets that we use. Each oval shape represents a PSN
set. The top line in the given oval indicates the name of the PSN set. The bottom line in the given oval contains two numbers
represented as “x; y”, where x is the number of classes (i.e., labels) that are present in the PSN set and y is the average
number of PSNs per class. For example, for the SCOP database, PSN set SCOP-primary has seven classes, where each class
has an average of 1,635 PSNs. All of the PSN sets at a given level form a PSN set group. For example, PSN sets
CATH-primary and SCOP-primary form PSN set group 1. A class of a PSN set in group i may be present as a PSN set in
group i + 1. For example, the class α of the PSN set SCOP-primary in group 1, is present as a PSN set SCOP-α in group 2.
Note that since we select a PSN set if and only if it has at least two classes each with at least 30 PSNs, given a PSN set in
group i, not all its classes are necessarily present as PSN sets in group i + 1. For example, PSN set SCOP-primary has seven
classes in group 1, but only five of its classes exist as PSN sets in group 2. Also note that because of our PSN set selection
criteria, it is not necessary that a PSN set in group i + 1 has to be present as a class within a PSN set in group i. For example,
PSN set SCOP-c.2.1, which is present in group 4, is not present as a class within any PSN set in group 3. This is because
SCOP-c.2 contains only one class that has at least 30 PSNs (i.e., c.2.1) and hence we do not consider SCOP-c.2 as a PSN set
in our analysis. This figure has been adapted from the GRAFENE paper6. Note that the numbers of PSNs in this figure are
different than the numbers of PSNs in the corresponding figure of the GRAFENE paper, because in this study we focus only
on those PSNs that can be analyzed by each of the considered protein features (Section 2.1), where not all of our considered
features are necessarily the same as all of the methods considered in the GRAFENE paper.
Second, in addition to the 19 + 16 = 35 CATH and SCOP PSN sets from the GRAFENE study as described above, we
use a different dataset because of the following reason. Typically, high sequence similarity of proteins indicates their high
structural similarity. Hence, given a set of proteins in which proteins in the same structural class have high sequence similarity
(typically > 40%), a “simple” protein sequence comparison might be sufficient to perform PSC44 . So, we aim to evaluate how
well our considered protein features (that are based on different aspects of a protein structure) can identify proteins in the same
structural category when all of the proteins (within and across structural categories) show low (≤ 40%) sequence similarity.
5/19In order to do this, we download the dataset called Astral from the SCOPe 2.04 database45 . This dataset has 14,666
protein domains, where each domain pair is at most 40% sequence similar to each other. Each protein domain in this dataset
is annotated by a label (i.e., protein structural class) assigned by the protein domain categorization database SCOP, where
the label indicates the protein family to which the domain belongs. We create a PSN corresponding to each of the protein
domains as described above. Then, we follow the same criteria as in the GRAFENE study6 (also described above) to only
keep “meaningful” PSNs. This results in 1,677 PSNs belonging to 32 different protein structural classes. We name this set of
1,677 PSNs as Astral. Note that the decrease from 14,666 to 1,677 protein domains is mostly due to removing protein domains
that belong to a protein domain class with fewer than 30 protein domains (see above); ∼60% of the data loss is caused by this.
Taken together, in our study, we use 35 + 1 = 36 PSN sets (35 CATH and SCOP PSN sets and one Astral PSN set) that
contain 9,440 protein domains annotated by the CATH database and 12,820 protein domains (union of the above SCOP-related
11,352 protein domains and the Astral-related 1,677 protein domains) annotated by the SCOP database.
2.2 Our evaluation framework
2.2.1 Protein features
For each of the protein domains, we extract 18 different protein features that are based on either sequence, 3D structure,
contact map, non-graphlet network, graphlet network, or weighted network (Table 1). To understand what aspects of the
protein structure each considered feature captures, we categorize the given feature based on whether it (1) captures local or
global structure of a protein, (2) is based on the backbone or the side-chain of a protein, (3) is dependent on the sequentiality
of amino acids of a protein or not, and (4) is dependent on the 3D structural conformation of a protein or not. We say that a
feature is local if it explicitly uses local structural characteristics of a protein to summarize the whole protein structure, while
we say that a feature is global if it summarizes the structure of a protein as a whole without explicitly using smaller structural
characteristics of a protein. We say that a feature is based on the backbone (side-chain) of a protein if it uses only the heavy
atoms of the protein backbone (side-chain). We say that a feature is sequence-dependent if permuting sequence positions of
the amino acids of a given protein alters the feature as well. We say that a feature is 3D structural conformation-dependent
if altering 3D structural positions of amino acids of a given protein alters the feature as well. By altering the 3D structural
position of an amino acid, we mean changing the 3D spatial position of the amino acid to any other position in the 3D space,
which can be different than positions of all other amino acids of the protein.
Note that all of the considered sequence-based features are not dependent on the 3D structural conformation of a protein,
while all of the other considered features are dependent on this. Because we just covered this, we do not comment any further
on whether a feature is 3D conformation-dependent or not.
Also, note that since we construct a PSN using any heavy atoms irrespective of whether the heavy atoms belong to the
backbone or the side-chain of a protein (see above), any considered feature that is entirely or partially PSN-based (which is the
case for each considered feature except sequence-based AAComposition, DAAComposition, and SVMfold, plus 3D structure-
based GIT) is automatically based on both the backbone and the side-chain of a protein. Henceforth, we only comment on
whether a feature is either backbone-based or side-chain-based (or neither) only if the feature is not PSN-based, i.e., we do it
only for AAComposition, DAAComposition, SVMfold, and GIT.
Below, we define each of the features and outline whether the given feature is local or global, as well as whether it is
dependent on the sequentiality of amino acids of a protein (and for AAComposition, DAAComposition, SVMfold, and GIT,
whether the given feature is either backbone-based or side-chain-based (or neither)).
Sequence-based features. We use a baseline sequence feature, AAComposition. Given a protein sequence, AAComposition
measures the relative frequency of the 20 types of amino acids in the entire sequence: for each amino acid type i, it measures
the frequency occurrence of i in the sequence divided by the total number of amino acids in the sequence. AAComposition
considers the entire protein sequence, and hence, it is a global feature. AAComposition does not use any heavy atom of an
amino acid, and hence, it is neither a backbone- nor a side-chain-based feature. AAComposition only measures the relative
frequency of the different amino acid types without looking at the sequence position of a given amino acid, and hence, it is
not sequence-dependent.
We use another baseline sequence feature, DAAComposition. Given a protein sequence, DAAComposition measures the
relative frequency of each of the possible ordered di-amino acid combinations in the entire sequence: for each pair of amino
acid types i and j, it measures the frequency occurrence of a given ordered combination of i and j in the sequence divided
by the total number of all possible di-amino acid ordered combinations among all 20 amino acid types. DAAComposition
considers the entire protein sequence, and hence, it is a global feature. DAAComposition does not use any heavy atom of an
amino acid, and hence, it is neither a backbone- nor a side-chain-based feature. Any change in sequence can alter di-amino
acid compositions of a protein, and hence, DAAComposition is sequence-dependent.
6/19Table 1. Summary of all protein features that we use in this study. We use the same classifier (logistic regression) for all
features except “distance matrix” (colored in gray); for the latter, we use deep learning.
Category Feature name Measures Based on protein Dependent on Dependent
local/global backbone/side- sequentiality on 3D confor-
structure chain of amino acids mation
AAComposition Global None No No
Sequence DAAComposition Global None Yes No
SVMfold Local None Yes No
3D structure GIT Local Backbone Yes Yes
Contact map CSM Global Both No Yes
Non-graphlet network Existing-all Global Both No Yes
Graphlet-3-4 Local Both No Yes
Graphlet-3-5 Local Both No Yes
NormGraphlet-3-4 Local Both No Yes
NormGraphlet-3-5 Local Both No Yes
Graphlet network
OrderedGraphlet-3 Local Both Yes Yes
OrderedGraphlet-3-4 Local Both Yes Yes
OrderedGraphlet-3-4(6Å) Local Both Yes Yes
NormOrderedGraphlet-3 Local Both Yes Yes
NormOrderedGraphlet-3-4 Local Both Yes Yes
GIT+OrderedGraphlet-3-4(6Å) Local Both Yes Yes
Integrated
Concatenate Both Both Yes Yes
Weighted network Distance matrix Global Both Yes Yes
Note that we evaluated DAAComposition against two additional related features, tri-amino acid composition and PseAAC46 .
We found DAAComposition to consistently and significantly outperform the latter two. Consequently, for simplicity, we do
not report any results for tri-amino acid composition and PseAAC.
Additionally, we use a recent state-of-the-art sequence method called SVMfold. Given a protein sequence, SVMfold
computes the PSSM10 , three-state SS profile11, and HMM profile12 of the protein sequence, and integrates these three features
to obtain a single feature representation of the protein7. SVMfold relies on HMM profile, which extracts features from
subsequences of a protein, and hence, SVMfold is a local feature. SVMfold does not explicitly use any heavy atom of an
amino acid, and hence, it is neither a backbone- nor a side-chain-based feature. SVMfold relies on PSSM profile, which
extracts features from a sequence alignment of proteins, and hence, SVMfold is sequence-dependent.
Note that there exists another method called SVM-fold47 (note that the difference between the names of this method and
the above SVMfold method is the presence and absence of ”-”, respectively). However, we do not use this method because
the focus of its publication was to propose not a novel protein feature but an improved classification algorithm that, given any
sequence-based protein feature, can perform PSC. Specifically, the method feeds an existing sequence-based protein feature
into string kernels48, which it then uses to classify proteins. However, as pointed out earlier in the Section 1, the focus of
our study is to evaluate different protein features in the task of PSC and not on improving the underlying PSC algorithm.
Additionally, this method (i.e., SVM-fold) is more than a decade old approach, while the sequence-based method that we
evaluate (i.e., SVMfold) in our paper is a recent approach.
3D structural feature. We use a state-of-the-art 3D-structural feature, GIT. Given a protein structure, GIT measures how
often, according to the amino acid sequence, the α -carbon trace of the protein forms different kinds of local patterns in the 3D
space. To measure the number of different patterns, GIT computes 31 different Gauss integrals and uses them as the feature
representation of a protein23. GIT measures local patterns formed by the α -carbon trace of a protein, and hence, it is a local
feature. GIT is based on only the α -carbons of a protein, which are part of the backbone of a protein, and hence, GIT is a
backbone-based feature. GIT is based on the α -carbon trace of a protein, which might be affected by a change in sequence
positions of amino acids, and hence, GIT is sequence-dependent.
Contact map-based feature. We use a recent contact map-based feature, CSM. Given a protein structure, CSM first computes
151 contact maps, which are based on 151 distance cutoffs (ranging from 0.0 − 30.0Å in increments of 0.2Å). For a given
distance cutoff, two amino acids are considered to be in contact if any of their heavy atoms are within the distance cutoff;
then, CSM counts the number of amino acid pairs that are in contact at that cutoff. Finally, CSM uses all 151 counts (for the
151 cutoffs) as the 151-dimensional protein feature vector25. CSM counts the total number of contacts present in the whole
protein, and hence, it is a global feature. CSM counts the number of contacts, which is not affected with a change in sequence
positions of amino acids, and hence, CSM is not sequence-dependent.
Non-graphlet network-based feature. Here, we use a feature that was shown to outperform many other non-graphlet
network-based features in an unsupervised protein comparison task6 . We denote this feature as Existing-all. Given a PSN,
Existing-all calculates and integrates seven global network features: average degree, average distance, maximum distance,
average closeness centrality, average clustering coefficient, intra-hub connectivity, and assortativity. Existing-all uses global
7/19network measures to quantify the structure of a protein (i.e., PSN), and hence, it is a global feature. Existing-all extracts
features from a PSN, which is not affected with a change in sequence positions of amino acids, and hence, Existing-all is not
sequence-dependent.
Graphlet network-based features. Graphlets, as originally defined, are small connected induced non-isomporphic undi-
rected k-node subgraphs of a network26. For example, an edge is the only 2-node graphlet. There exist two 3-node graphlets:
a 3-node path and a triangle. Examples of 4-node graphlets are a 4-node path, a square, a square with exactly one diagonal, or
a 4-node clique (complete graph). In total, there exist six 4-node graphlets. Typically, due to high computational complexity
(i.e., running time) of counting graphlets in large networks, up to 5-node graphlets are studied. There exist 21 5-node graphlets.
Consequently, there exist 1 + 2 + 6 + 21 = 30 2-5-node graphlets. Given a network, one can count occurrences of the different
graphlet types in the network and use these counts as a network feature26. Or, one can count how many times a node/edge in
the network participates in the different graphlet types and use these counts as a node/edge feature49, 50 . Because in our study
we extract graphlet-based features of an entire network rather than of individual nodes/edges, the latter is out of the scope of
this study.
In addition to being undirected, graphlets as originally defined are unordered, homogeneous, static, and unweighted. More
recently, graphlets were extended to their ordered6, heterogeneous51, and dynamic52 counterparts. For explanations of all of
these different graphlet types, see Newaz et al.53 . Note that weighted graphlets are still lacking, despite an existing study
using a similar terminology for a concept that even the authors of that study acknowledge is entirely unrelated to graphlets as
defined in our paper and in general in the field of network science54 .
In this study, we deal with undirected and unweighted networks and thus rely on undirected and unweighted graphlets.
However, in one case, we treat our networks as unordered, and in the other case we treat them as ordered. So, we use
unordered graphlets (defined above) for the former and ordered graphlets (defined below) for the latter. Specifically, we use
graphlets to extract the following network features from our PSNs.
Graphlet counts. We use two graphlet-based protein features, i.e., Graphlet-3-4 and Graphlet-3-5. Given a PSN, Graphlet-
3-4 and Graphlet-3-5 count the number of 3-4-node and 3-5-node graphlets, respectively. In particular, in the Graphlet-3-4
or Graphlet-3-5 feature vector, position i represents the logarithm of the count of graphlets of type i6 . Both Graphlet-3-4 and
Graphlet-3-5 are based on graphlets, which are small (i.e., local) network patterns as defined above, and hence, both Graphlet-
3-4 and Graphlet-3-5 are local features. Both Graphlet-3-4 and Graphlet-3-5 extract features from a PSN, which is not affected
with a change in sequence positions of amino acids, and thus, neither Graphlet-3-4 or Graphlet-3-5 are sequence-dependent.
Normalized graphlet counts. Since PSNs can be of very different sizes, we use two recent protein features that are based
on normalized graphlet counts and that thus account for network size differences6. These features are NormGraphlet-3-4 and
NormGraphlet-3-5; they are normalized equivalents of Graphlet-3-4 and Graphlet3-5, respectively. In particular, given a PSN,
in both NormGraphlet-3-4 and NormGraphlet-3-5 feature vectors, a position i represents the total count of graphlets of type
i divided by the sum of the counts of all graphlet types. Similar to Graphlet-3-4 and Graphlet-3-5, NormGraphlet-3-4 and
NormGraphlet-3-5 are local and sequence-dependent features.
Ordered graphlet counts. Graphlets capture 3D structural but not sequence information. To integrate the two, ordered
graphlets were proposed30. These are graphlets whose nodes acquire a relative ordering based on positions of the amino
acids in the sequence. Two ordered graphlet features exist: OrderedGraphlet-3 and OrderedGraphlet-3-46, 30 . For a PSN, in
OrderedGraphlet-3 and OrderedGraphlet-3-4 feature vectors, position i is the total count of ordered graphlets of type i.
In addition, we use two features that are based on normalized counts of ordered graphlets6: NormOrderedGraphlet-3 and
NormOrderedGraphlet-3-4; these are normalized equivalents of OrderedGraphlet-3 and OrderedGraphlet-3-4, respectively.
For a PSN, in NormOrderedGraphlet-3 and NormOrderedGraphlet-3-4 feature vectors, position i is the total count of ordered
graphlets of type i divided by the total count of all ordered graphlet types.
As we will show, OrderedGraphlet-3-4, when used at the default 4Å distance cutoff (Section 2.1), is the best of all
considered (graphlet or non-graphlet) PSN-based features. So, for this best PSN feature, we aim to evaluate the effect of the
choice of distance cutoff. Consequently, we also count ordered graphlets in PSNs that are based on the 6Å distance cutoff,
resulting in a new feature called OrderedGraphlet-3-4(6Å).
Just like regular graphlets, ordered graphlets are local network structures, and hence, all of the ordered graphlet-based
features are local. The ordered of nodes in ordered graphlets is determined by sequence positions of amino acids in a protein,
and hence, all of the ordered graphlet-based features are sequence-dependent.
Integrated features. We propose two new features that integrate two different subsets of the above protein features. First, we
integrate the best of the non-graphlet features (GIT) and the best of the graphlet features (OrderedGraphlet-3-4(6Å)) (Section
3) into a new combined feature called GIT+OrderedGraphlet-3-4(6Å). Second, we add the best of the sequence features that
we could run on all of the data (i.e., DAAComposition) to GIT+OrderedGraphlet-3-4 (6Å) into a new combined feature called
Concatenate. That is, even though SVMfold is better than DAAComposition on the data where we were able to run SVMfold,
8/19we use DAAComposition instead of SVMfold because of SVMfold’s high running time and thus its inability to be run on
all data (Section 3). Formally, given k features of size 1 × fi (i=1, 2, ..., k), we concatenate them to form a feature of size
1 × ∑ki=1 fi . Clearly, any integrated feature will belong to all of those categories to which the corresponding individual features
belong (Table 1).
Principal component analysis (PCA)-transformed features. For each of the 17 features described above (nine graphlet
features, one non-graphlet network feature, one contact map feature, one 3D-structural feature, three sequence features, and
two integrated features), we aim to test whether it is possible to improve effectiveness of the features by reducing dimensions
of their vectors in order to remove potential redundancies between the different vector dimensions. We perform feature
dimensionality reduction using PCA for the following reasons. PCA transformation of protein features, including graphlet-
based ones, was shown to better capture protein (dis)similarity in the unsupervised task of protein structural comparison6.
Also, PCA, a linear feature dimensionality reduction method, was shown to work better than two well-known non-linear
methods, minimum curvilinear embedding (MCE) and non-centered MCE, when graphlet features were used to compare
(align) biological networks51.
We perform the PCA feature transformation for each of the 17 features and each of the 36 PSN sets as follows. Let us
denote a given feature’s vector dimension as N. Let us denote a given PSN set’s number of proteins as M. The N-dimensional
feature vectors over all M proteins in the set result in an M × N matrix. We apply PCA to this matrix. That is, we reduce
the original feature vectors of length N to new feature vectors of length r (r ≤ N), where the latter correspond to the first r
principal components (i.e., the first r eigen values). We set the value of r to be at least two and as low as possible so that
the r components account for at least 90% of variation in the PSN set. We use prcomp() function in R to PCA-transform the
original M × N matrix.
Weighted network-based feature. We use a weighted adjacency matrix, or distance matrix55, of a 3D protein structure as a
weighted PSN-based feature representation. In particular, given a protein of length n, we define a weighted adjacency matrix
D of size n × n, in which each position Di j contains the minimum 3D spatial distance between the amino acids i and j, where
the minimum is taken over all pairwise distances between any heavy atoms of i and j. Weighted adjacency matrix measures
pairwise distances among amino acids in the entire protein, and hence, it is a global feature. A change in sequence positions
of amino acids will alter the matrix values, and hence, weighted adjacency matrix is sequence-dependent.
Taken together, in our study, we use 35 different protein features (15 individual pre-PCA features, 15 individual post-PCA
features, two integrated pre-PCA features, two integrated post-PCA features, and a weighted network-based feature).
2.2.2 The logistic regression framework
Given a PSN set, we train a logistic regression (LR) classifier corresponding to each of the 34 out of the 35 pre- or post-PCA
protein features (see above); we use a different classifier for the remaining (weighted network-based) feature, as discussed in
the following subsection. Hence, for each of the PSN sets, we get 34 different trained LR classifiers. In each of the trained
classifiers, the input is a feature representation of a protein and output is the structural class to which the protein belongs.
Since PSC is a multi-class problem, we use the one-vs-rest scheme to train an LR classifier. Due to space constraints, we
provide further details about our LR framework in Supplementary Section S3.
Given a PSN set and a protein feature, we first divide the PSN set into 10 equal-sized subsets, such that each subset
contains the same proportion of different protein structural classes (i.e., labels) as present in the initial PSN set. Then, for each
subset, we use it as the test data and the union of the remaining nine subsets as the training data. We use the training data in
two different ways to train an LR model. First, we train an LR model with the training data as is. We call this way of training
an LR model as proportional. Second, at least some of our PSN sets have unequal numbers of proteins in different classes, i.e.,
are imbalanced. Consequently, the training data as used by the proportional approach is also unbalanced. Hence, we exploit
a data re-sampling approach called Synthetic Minority Oversampling Technique (SMOTE)56 to first balance the training data
and only then use it to train an LR model. We call this way of training an LR model as proportional+SMOTE.
Before we train an LR model and use it to predict classes of proteins in the test data, we use the training data itself in a
10-fold cross validation manner57, 58 to choose an “optimal” value for the regularization hyper-parameter of an LR model. We
perform linear search to find an optimal value from the set [2−2 , 2−1 , 20 , 21 , 22 ]. For details, see Supplementary Section S3.
Then, we use the resulting optimal hyper-parameter value and all of the training data to train an LR model.
Next, we evaluate the performance of the trained model on the separate test data, and we do so using two evaluation
measures: accuracy and Matthew’s Correlation Coefficient (MCC)59 . Accuracy is the percentage of all proteins from the
test data that are classified into their correct protein structural classes. In case of an imbalanced dataset, accuracy can give
over-optimistic classifier performance, as its value is biased towards the class with the largest number of samples. That is,
accuracy can fail to capture how a classifier performs on each of the classes present in the dataset. So, we also use MCC,
which intuitively captures how well a given classifier performs on each of the classes and hence is robust to data imbalance.
9/19Because we measure the performance of a trained LR model over 10 different sets of test data, we report an accuracy or MCC
performance value averaged over the 10 sets.
2.2.3 The deep learning framework
In the second part of our study, we design a deep learning (DL) framework in order to learn features of 3D protein structures
using weighted protein structure networks. For each of the 36 PSN datasets, we train a deep neural network, where we use
distance matrix-representations of proteins as input. Our DL framework consists of one input layer, seven hidden layers, and
an output layer. Due to space constraints, we provide further details about our DL framework in Supplementary Section S4.
Similar to LR framework, given a PSN set and a protein feature, we first divide the PSN set into 10 equal-sized subsets,
such that each subset contains the same proportion of different protein structural classes (i.e., labels) as present in the initial
PSN set. Then, for each subset, we use it as the test data and the union of the remaining nine subsets as the training data to
train our DL framework. Here, we train using only the proportional approach but not proportional+SMOTE, because (as we
will show) our evaluation in the LR framework reveals that results are qualitatively identical no matter whether proportional
or proportional+SMOTE training is used.
Note that recently a related deep learning method was proposed that uses 3D-structural information for protein function
prediction60. Given a protein, the method extracts two types of structural information: the torsional angles for each of the
amino acids and the pairwise spatial distances between the α -carbons of the amino acids of a protein. Given this structural
information, the method uses a deep convolutional neural network framework along with SVM to perform the protein function
prediction. The method was applied to classify enzymes (i.e., proteins) into functional categories. Since we only became aware
of this very recent method towards the end of our work, we could not include it into our evaluation. Also, this method extracts
3D structural features rather than PSN-based features, but we already compare to a state-of-the-art 3D structural feature, GIT,
and so including an additional method of the same type is not critical. Additionally, the focus of the study that proposed this
existing 3D structural method was on the task of protein function prediction rather than on our task of PSC, while GIT, the
3D structural feature that we already consider, was proposed for protein structural (rather than functional) analyses and is thus
much more related to our proposed work.
3 Results and discussion
Throughout this section, unless stated otherwise, we: (i) analyze the 35 considered PSN sets that span all four levels (groups)
of CATH and SCOP hierarchies, plus the Astral PSN set, totaling to 36 PSN sets; (ii) report results when using the proportional
approach in the training stage of the classification process and the accuracy measure; and (iii) for the PSN-based methods,
which depend on the choice of distance cutoff, we use the default 4Å cutoff.
In Section 3.1, we compare the different graphlet features (Section 2.2) to identify the best one(s) for further analyses.
In section 3.2, we identify the best of the pre- or the post-PCA versions for each of the considered features. In Section 3.3,
we evaluate how well the best of the graphlet feature(s) perform in comparison to the existing baseline or state-of-the-art
protein features that we study (considering for each feature the best of its pre- and post-PCA versions). Here, we leave
out from consideration the existing SVMfold sequence approach7, because we were unable to apply this approach to all 36
considered PSN sets due to its extremely high running time. Instead, we consider the SVMfold later on, in a smaller-scope
analysis of two of the 36 PSN sets on which we were able to run SVMfold (see below). In Section 3.4, we evaluate whether
integration of different feature types improves upon each of the individual features. In Section 3.5, we analyze whether results
from the above analyses differ when using the proportional vs. proportional+SMOTE approach in the training stage of the
classification process as well as when using the accuracy vs. MCC measure. In Section 3.6, we compare the performance of
the best graphlet-based PSC approaches that deal with unweighted PSNs to the performance of simple weighted PSN-based
feature classification via DL. In Section 3.7, we analyze two representative PSN sets on which SVMfold could be run, in order
to compare our proposed approaches to this state-of-the-art existing sequence-based PSC approach. In Section 3.8, we study
the effect of the methodological choice of considering vs. not considering our PSN filtering criteria (from Section 2.1) on the
performance of the considered features for one of the considered PSN sets.
3.1 Comparison of graphlet features
When we compare all graphlet features (that use the default 4Å distance cutoff) under the LR classifier, OrderedGraphlet-3-4
is consistently and by far the best for each CATH/SCOP PSN group as well as the Astral data set (Supplementary Figure
S1). Consequently, henceforth, of all graphlet approaches, we focus only on OrderedGraphlet-3-4. This result indicates that
adding sequence-based node (amino acid) order onto regular (non-ordered) graphlets improves upon the latter alone. This
10/19result is in alignment with our past work on unsupervised protein comparison6. Unlike in our past unsupervised study, in
our current study, graphlet feature normalization does not always improve upon non-normalized features, and sometimes it
actually worsens accuracy.
Because OrderedGraphlet-3-4, which uses the default 4Å distance cutoff, is the best graphlet approach, we also con-
sider the counterpart of OrderedGraphlet-3-4 that uses the 6Å distance cutoff, i.e., OrderedGraphlet-3-4(6Å). We find that
OrderedGraphlet-3-4(6Å) is superior to OrderedGraphlet-3-4 (Figure 2). So, we proceed with OrderedGraphlet-3-4(6Å) as
the best graphlet feature. Nonetheless, for informational purpose, we continue to report results for both OrderedGraphlet-3-4
and OrderedGraphlet-3-4(6Å).
Figure 2. Accuracy of the pre- and post-PCA OrderedGraphlet-3-4 (ordered graphlets at the default 4Å distance cutoff) and
OrderedGraphlet-3-4(6Å) (ordered graphlets at the 6Å distance cutoff) under the LR classifier, for each of the four hierarchy
levels (groups) of the CATH data, averaged over all PSN sets belonging to the given group (vertical lines are standard
deviations), plus the Astral PSN set. Results are qualitatively similar for the four groups of the SCOP data as well
(Supplementary Figure S2).
3.2 Selection of the best of the pre- or the post-PCA features
Here, we consider the following features under the LR classifier: all non-graphlet features except SVMfold, the two top
performing graphlet features from Section 3.1 (OrderedGraphlet-3-4 and OrderedGraphlet-3-4(6Å)), and the two integrated
features (i.e., GIT+OrderedGraphlet-3-4(6Å) and Concatenate) (Table 1). Note that since we could not apply SVMfold to all
of the 36 PSN sets that we use, we exclude SVMfold from this analysis. When we compare pre- and post-PCA versions of each
of the considered features, we find that pre-PCA performs the best for CSM, GIT, OrderedGraphlet-3-4, OrderedGraphlet-3-
4(6Å), GIT+OrderedGraphlet-3-4(6Å), and Concatenate, while post-PCA performs the best for AAComposition, DAACom-
position, and Existing-all (Supplementary Figure S3).
So, PCA helps ∼30% of the time. Thus, henceforth, for each feature, we use the best of its pre- and post-PCA versions.
Also, for a given feature, if we use its post-PCA version, “*” is shown next to the feature’s name.
11/19You can also read