On the Road to Recovery: Becoming A Superior Workforce post COVID-19 2020-2021 Local Labour Market Plan - North Superior Workforce ...
←
→
Page content transcription
If your browser does not render page correctly, please read the page content below

On the Road to Recovery:
Becoming A Superior Workforce post COVID-19

         2020-2021 Local Labour Market Plan

                                              1
2021 Update
Visit us online at www.nswpb.ca
LIMITATIONS:

The North Superior Workforce Planning Board recognizes the potential limitation of this
document and will continue to seek out information in areas that require further analysis
and action. The North Superior Workforce Planning Board assumes no responsibility to the
user for the consequences of any errors or omissions. This document may be freely quoted
and reproduced without the permission of North Superior Workforce Planning Board
provided that North Superior Workforce Planning Board is acknowledged as the author of
the document. The information presented in this report is current at the time of printing.

For further information please contact:
Madge Richardson
Executive Director
North Superior Workforce Planning
600 Hewitson Street
Thunder Bay, ON, P7B 6E4
mrichardson@nswpb.ca | 807.346.2940

This project is funded in part by the Government of Canada and the Government of Ontario.

2
ABOUT NORTH SUPERIOR WORKFORCE PLANNING BOARD:

The North Superior Workforce Planning Board (NSWPB) is one of twenty-six Workforce
Planning zones across Ontario, mandated by the province of Ontario to identify, assess
and prioritize the skills and knowledge needs of community, employers and individual
participants/learners in the local labour market through a collaborative, local labour
market planning process.

An active and broadly-based volunteer Board of Directors governs its affairs. First
established in 1996, NSWPB is recognized by community, economic and municipal leaders
as a “partner of choice” in the identification and implementation of local solutions to local
labour market issues.

Workforce Planning Boards play a key role in the provinces goal of integrating its programs
and services. Part of the ongoing strategy to achieve this goal is to first identify and then
respond to the diverse regional and local labour market needs through the province.

VISION:

Our human resource pool will be strategically aligned, competitively positioned, and
progressively developed to meet future social and economic demands across Northwestern
Ontario.

MISSION:

Connecting community partners to improve the quality of life in our communities
through workforce development.

The North Superior Workforce Planning Board will:

• Build a strategic workforce readiness plan
• Create a dynamic, responsive process to satisfy current needs and prepare people for
emerging labour market opportunities within a global economy
• Leverage community alliances to maximize labour market capacity and
competitiveness

                                                                                           3
MANDATE:
Leading in the creation of innovative labour market solutions by:

• Providing authoritative and evidence-based research
• Identifying employment trends
• Targeting workforce opportunities
• Initiating workforce development strategies

         Refer to Appendix C for complete
         list of communities

4
ACKNOWLEDGEMENTS

Development of the 2021-2022 Local Labour Market Plan for the North Superior Workforce
Planning Board catchment area has been made possible by the collaborative efforts of the
many stakeholders engaged in NSWPB initiatives. We greatly appreciate the individual and
collective contributions of time, talent, perspectives, and insights in creating our local plan that
is representative of our current realities in the ever changing social and economic landscape.

We gratefully acknowledge the leadership of the North Superior Workforce Planning
Board (NSWPB) Board of Directors and Workforce Recovery Team (WRT) and the many
contributions of the Subject Matter Working Groups (SMWG). Their passion, commitment,
vision and subject-matter expertise contributed to this local plan that has been made by
and on behalf of local stakeholders in our region.

We would also like to acknowledge the author of this report, Anthony Noga, former NSWPB
Labour Market Analyst, for his skills, knowledge and expertise in analysis of our labour
market data, and for his tireless efforts in devising this report for our community.

We will also acknowledge our funder, the Ministry of Labour, Training and Skills Development
(MLTSD) for supporting us in our efforts to address local labour market challenges and
opportunities.

         NSWPB Board of Directors
            Crystal Olson, Chair
           Doris Rossi, Vice Chair
       Roger Shott, Member-at-Large
        John DeGiacomo, Treasurer
                Dave Farrell
               John Hatton
                Owen Smith
               Bert Johnson

                                                                                                  5
Workforce Recovery Team (WRT) Members
           Anishinabek Employment and Training Services (AETS)
         Association des francophones du Nord-Ouest de l’Ontario
                            Confederation College
                    Conseil de la coopération de l’Ontario
               Greenstone Economic Development Corporation
      Ministry of Advanced Education and Skills Development (MAESD)
                             Lakehead University
                              Literacy Northwest
                           March of Dimes Canada
                           Metis Nation of Ontario
                          MTW Employment Services
                            Nokiiwin Tribal Council
                  North Superior Workforce Planning Board
                           Northern Policy Institute
                                  Novocentre
                     PARO Centre for Women’s Enterprise
     Reseau de soutien a l’imigration francophone du nord de l’Ontario
       Superior North Community Futures Development Corporation
      The District of Thunder Bay Social Services Administration Board
                      Thunder Bay Chamber of Commerce
    Thunder Bay Community Economic Development Commission (CEDC)
                  Thunder Bay Indigenous Friendship Centre
                    Thunder Bay Multicultural Association
                            Thunder Bay Ventures
                          YES Employment Services

6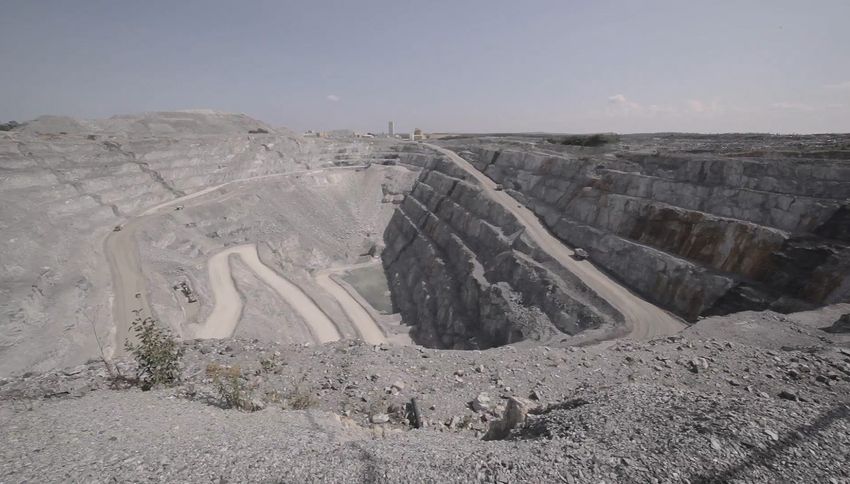
Subject Matter Working Group (SMWG) Members
        Anishinabek Employment and Training Services (AETS)
      Association des francophones du Nord-Ouest de l’Ontario
                       Canadian Hearing Society
                      Carpenters’ Union, Local 1669
           Community Economic Development Commission
                     Community Living Thunder Bay
                          Confederation College
              Confederation College Academic Upgrading
                 Conseil de la coopération de l’Ontario
      Conseil scolaire de district catholique des Aurores boréales
               Construction Association of Thunder Bay
          Fort William First Nation Employment and Training
                             Frontier College
                  Independent Living Resource Centre
                   Kairos Community Resource Centre
                             Kallio Consulting
Kiikenomaga Kikenjigewen Employment and Training Services (KKETS)
                        Kinna-aweya Legal Clinic
                Lakehead Adult & Continuing Education
                     Lakehead Public Schools/OYAP
                           Lakehead University
                        Literacy Northwest (LNW)
                         March of Dimes Canada
                         Metis Nation of Ontario
                       MTW Employment Services
          North Superior Workforce Planning Board (NSWPB)
                 Northwest Employment Works (NEW)
         Northwestern Ontario Innovation Centre Novocentre
                      Northern Policy Institute (NPI)
                    Operating Engineers – Local 793
                  PARO Centre for Women’s Enterprise

                                                                     7
Resolute Forest Products
                             Roots to Harvest
                               Safe Stress
                              Skills Ontario
                Superior Greenstone District School Board
                Superior North Adult Learning Association
     Superior North Community Futures Development Corporation
                            Superior Strategies
    The District of Thunder Bay Social Services Administration Board
               Thunder Bay Catholic District School Board
                    Thunder Bay Chamber of Commerce
     Thunder Bay Community Economic Development Commission
                Thunder Bay Indigenous Friendship Centre
                       Thunder Bay Literacy Group
                  Thunder Bay Multicultural Association
                              U2 Fasteners
                      White Lake Limited Partnership
                          Whitesand First Nation
                        YES Employment Services

8
TABLE OF CONTENTS

About the North Superior Workforce Planning Board................................................................3
Acknowledgements.............................................................................................................................. 5
    NSWPB Board of Directors ........................................................................................................... 5
    Workforce Recovery Team (WRT) Members............................................................................ 6
    Subject Matter Working Group (SMWG) Members ..............................................................7
Introduction........................................................................................................................................... 10
Overview................................................................................................................................................ 14

Population..............................................................................................................................................15
   ACTION PLAN ITEM: Goal and 3 NSWPB Actions:............................................................... 16
   Population Projections:..............................................................................................................24
   Sustainability:................................................................................................................................26

Labour Force Characteristics............................................................................................................30
   ACTION PLAN ITEM: Goal and 3 NSWPB Actions:................................................................ 31

Employer Characteristics................................................................................................................. 46
  ACTION PLAN ITEM: Goal and 4 NSWPB Actions:............................................................... 47

Employment Ontario Data Review...............................................................................................54
  Employment Services:..................................................................................................................57
  Literacy and Basic Skills:........................................................................................................... 64
  Apprenticeships:............................................................................................................................. 71
  Canada-Ontario Job Grant:....................................................................................................... 76
  Employment Assistance, Second Career, Youth Job Connection:...................................77

Conclusion.............................................................................................................................................. 78

Bibliography......................................................................................................................................... 80
Appendices............................................................................................................................................83
   Appendix A – Glossary of Acronyms:......................................................................................83
   Appendix B – EO and non-EO Employment and Training Service Providers:........... 86
   Appendix C – NSWPB Geographic Area:............................................................................... 88

                                                                                                                                                              9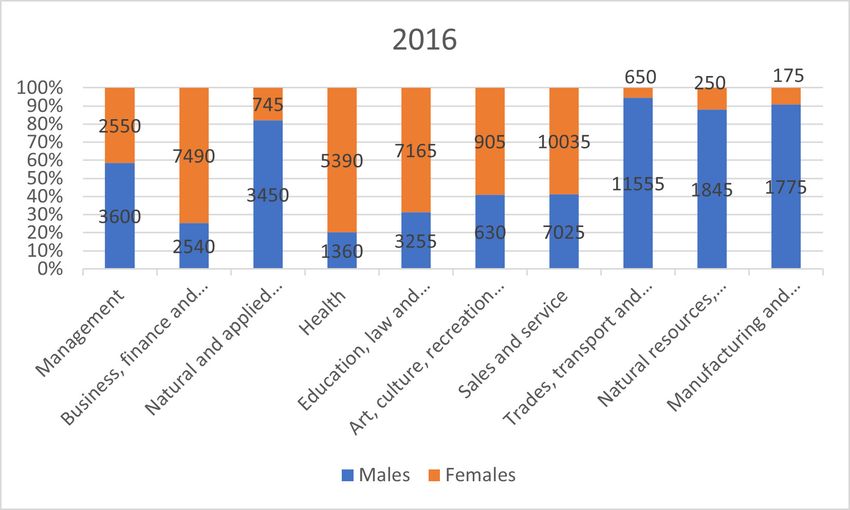
INTRODUCTION
COVID-19 changed everything. 2020 ushered in hopes for growth, reconciliation, and
sustainable workforce development in Canada and Northwestern Ontario. Instead, less
than four months after ringing in the new decade, economies were plunged into cryostasis
by governments desperate to contain the spread of the novel coronavirus. The pandemic’s
impact on the workforce is unfathomable. Canada lost more total jobs between March
and April 2020 than it did in the three previous recessions combined.1 The country shed 1.8
million jobs in a single month, nearly 1.5 million more than during the entirety of the Great
Recession of 2008-2009.

Unlike the downturns of 1981-82, 1990-92, and 2008-09, this one extends beyond the
workforce. With schools, daycares, recreation activities, and retailers all shuttered, many
Canadians found their worlds turned upside down by the order to stay at home. The new
reality forced a scramble for new technologies and new ways of doing things. In short, the
COVID-19 pandemic hurled Canada across the map into uncharted waters.

And yet – despite changing everything – COVID-19 really did not create any new systemic
problems for the economy. The fault lines were already there, it just took this tectonic shift
to expose them. The difficulties that parents, particularly mothers, face in the workforce
is not new; the lower educational and employment outcomes for Indigenous peoples
has a history stretching back decades; the vulnerability of precarious and part-time, low-
wage workers did not suddenly emerge in March 2020; calls for improved access to rural
broadband began well before the first confirmed COVID-19 case; people struggled with
food insecurity before the economy was intentionally frozen; and calls for more responsive
income support policies have waxed and waned since last century. It took a once-in-a-
century pandemic to thrust these issues, and more, into the spotlight like never before and
have inspired a global call to “build back better.”2

This Local Labour Market Plan (LLMP) is part of North Superior Workforce Planning Board’s
(NSWPB) plan to do just that, en route to a prosperous and thriving region. It charts
NSWPB’s strategy to respond to the pandemic in a way that will develop a better, stronger,
more inclusive, and resilient local economy. Objectives for the next three years will be laid
out with planned actions to achieve each. The strategies have been informed through
an analysis of data in the local labour market, along with surveys of, and conversations
1        Author’s calculations from Statistics Canada. Table 14-10-0022-01 Labour force characteristics by industry,
monthly, unadjusted for seasonality (x1,000). The recessions defined here are, 1) June 1981 to October 1982; 2) March
1990 to April 1992; and 3) October 2008 to May 2009
2        See, for example: http://www.oecd.org/coronavirus/policy-responses/building-back-better-a-sustainable-resil-
ient-recovery-after-covid-19-52b869f5/

10
with regional employers, workers, service providers, education institutes, labour groups,
interested observers, and more.

The LLMP outlines how NSWPB will address key topics to activate Northwestern Ontario’s
workforce as part of the push to build back better. Specifically, it will speak to several
needs:

•   Promoting geographically distributed population growth that involves migration,
    retention, and natural growth
•   Closing the impending skills gap as large swaths of the workforce near retirement age
•   Ensuring a ‘she-covery’ by focusing on facilitating women’s transition
•   back into the workforce
•   Advancing economic reconciliation by improving the educational and employment
    outcomes of Indigenous peoples
•   Identifying workforce needs and developing collaborative solutions by leading the
    Workforce Recovery Team and subject matter working groups as well as participating
    in efforts led by community partners
•   Supporting existing businesses and encouraging new ones
•   Identifying potential growth sectors, as well as those at risk

Given that the issues exposed by the pandemic are not new, it is no surprise that these
priorities do not diverge greatly from the planning board’s previous objectives. Some
have certainly taken on greater urgency, but they were always essential to the region’s
prosperity. Discussions with community members emphasized that short- and medium-
term recovery objectives must be nested in the longer-term priorities for Northwestern
Ontario. These have not changed; they still revolve around addressing impending skills
gaps, labour shortages, infrastructure gaps, and barriers in people’s personal lives that
are curtailing the region’s economic potential. Thus, the plan is to recover by redoubling
efforts and finding new ways to address the issues that have plagued the Thunder Bay
District since before the pandemic hit.

NSWPB will draw upon its existing network of community partners to refine and enhance
this plan on an annual basis. One of the key responses NSWPB has led was the formation
of the Workforce Recovery Team (WRT), comprised of representatives from local businesses,
service providers, labour, and other informed observers. The WRT meets regularly to discuss
pressing issues in the recovery. A number of issues have already been identified, and steps
taken to begin addressing them.

                                                                                         11
Many local organizations have struggled with being forced to use unfamiliar technology in their daily operations. Thanks to a grant from the Ontario Trillium Fund’s Resilient Communities program, NSWPB will hire a digital platform specialist whose responsibilities will be to provide training and troubleshooting on the new digital tools that members of the WRT are now using. This will build the WRT’s collective capacity to navigate the accelerating shift to digital workspaces. Pivoting to the new reality will be an essential first step to recovering and rebuilding. In the same vein, NSWPB will continue searching for professional development opportunities that will bolster the capacity of organizations across Northwestern Ontario. In September 2020, NSWPB invited groups throughout the region to participate in a change management seminar that honed their ability to navigate disruptions and successfully implement change in their own organizations. Participants in community discussions stated that similar opportunities would be among the most valuable resources that NSWPB could offer. As such, the planning board will continue pursuing ways to enhance the abilities of community partners to do their jobs during and after the pandemic, so that the region is well suited to develop collaborative solutions. The planning board will prioritize topics for research from discussions with the WRT and other outreach efforts. One of the issues at the top of the list is to finish workforce projections for the resource sector in Northwestern Ontario. The mining timeline projection is complete, the forestry projection is nearly finished, and an energy sector initiative is underway. These projections complement broader research into workforce development on issues such as the impact of automation and impending retirements. At the same time, NSWPB will leverage the work done by community partners to amplify its impact. The recent release of Thunder Bay Community Economic Development Commission’s (CEDC) Mining Readiness Strategy dovetails nicely with NSWPB’s mining timeline. Other partners regularly generate relevant research and analysis that augments NSPWB’s mandate and vice versa. The planning board will continue to facilitate and convene forums for partners to reinforce the work others are doing, as well as identify pressing topics upon which to focus. Issues that have grown in prominence, and may figure into the planning board’s future work, include efforts to make broadband internet accessible to everyone in the region, including remote mine and forestry operations, some of which are hampered by a lack of connectivity; begin addressing the shortage of housing, especially in the smaller communities in the district, with tailored solutions for the unique needs of First Nations; prepare for the lifelong learning that people will need to keep pace with technological advancements in their work and daily lives; smoothing the transitions from education/ 12
training to work; re-establishing the informal networking opportunities that were
inherent in in-person conferences but have dwindled during the age of web conferencing;
and diversifying the economy, especially in downstream, value-added sectors of pillar
industries.

Another asset at NSWPB’s disposal is the recently launched suite of labour market tools
named WorkSCAPE Northwest. These digital tools include the region’s largest job board, a
jobs map that geolocates job postings along with a host of community resources, a career
explorer that provides information on local job conditions, a sector map that shows which
employers have hired for specific occupations, as well as industry concentrations, a talent
map that employers and recruiters can use to identify where the talent pools they need
are located, and monthly reports on job posting demand and job searches. WorkSCAPE
Northwest will be continually updated with new tools and improvements to the existing
set. A particular focus raised during community discussions will be to develop tools that
will smooth out the transitions between leaving education/training and entering the
workforce.

Lastly, NSWPB is providing the Northwest Connector Program, an intentional networking
initiative to connect people – especially newcomers and youth – to work in the region. This
program has proven to be successful in more than 30 communities across Canada and will
provide a hands-on component to talent retention that will complement the research that
NSWPB does.

NSWPB will leverage these and other discussion forums, tools, research, analysis, labour
market information, and programs to drive a sustainable, equitable, and inclusive
economic recovery in Northwestern Ontario. Engaging with partners, conducting research,
developing tools, and delivering programs will be four pillars of NSWPB’s action plan that
will identify challenges and opportunities and devise collaborative solutions for the region.

                                                                                          13
OVERVIEW NSWPB’s region includes the Thunder Bay Distric3 – excluding Osnaburgh First Nation and the Ojibway Nation of Saugeen – as well as five First Nations communities in the Kenora District: Marten Falls; Eabametoong (Fort Hope); Webequie; Nibinamik (Summer Beaver); and Neskantaga (Lansdowne House). It falls into land originally inhabited by Anishinaabe and Cree peoples, and is covered by the Robinson-Superior Treaty of 1850, Treaty 3 of 1873, Treaty 9 of 1905-1906 as well as Treaty 9’s 1929 adhesion, and overlaps with Métis Nation of Ontario (MNO) Regions 1, 2, and 3. There are more than 40 communities in the Planning Board’s service area, including 17 First Nations, 3 MNO communities, 15 municipalities, and more than a dozen unincorporated communities. The five First Nations in Kenora District are not connected to permanent highway or rail networks, and so travel to and from these communities depends on flights, water travel, and winter roads. As part of the Northwestern Ontario economy, the NSWPB region is inextricably linked to communities represented by sister planning boards to the west, east, and north. The region has a justified reputation as being dependent on natural resource extraction, though the reality is that sectors such as healthcare, education, social services, and public administration tend to employ the largest number of people. Northwestern Ontario’s economy, as a whole, was not as badly disrupted as many parts of the country. Statistics Canada devised a new indicator called the underutilization rate to gauge COVID-19’s impact. This indicator combines the population that is unemployed with those that want a job but were not actively working and those that lost a majority of their working hours. Northwestern Ontario’s monthly labour underutilization rates in 2019 were among the highest in the province – in 2020 it was the opposite. From March 2019 to February 2020, Northwestern Ontario’s underutilization rate was higher than Ontario’s and Canada’s in all but one month. On the other hand, Northwestern Ontario had a better rate in every month from April to September 2020.4 Of course, that does not mean the impact was negligible. The monthly participation, employment, unemployment, and underutilization rates in 2020 were all much worse than in 2019. A strong recovery for Northwestern Ontario will mean these rates do not return to being significantly higher than the province’s or the country’s. 3 Where possible, data calculations involving the Thunder Bay District will omit Osnaburgh and Saugeen First Nation. 4 Community Data custom tabulation from Labour Force Survey data 14
Population

             15
One of the most pressing barriers to a thriving economy in Northwestern Ontario has to do with demographics. Over the past two decades, the region’s population has shrunk and aged, leaving a dwindling supply of available labour, as well as potential savings, consumption, and tax base – all of which herald slowing economic growth, or even decline (Helfand-Green 2016). A great deal of research has shown the need for population growth strategies that will address this topic (Helfand-Green 2016, Cuddy and Moazzami 2016, North Superior Workforce Planning Board 2018, Moazzami 2019, Zefi 2019, Ross 2020). Finding ways to continue population growth initiatives during and after the pandemic will be extra difficult but will be essential for Northwestern Ontario. ACTION PLAN ITEM: GOAL AND 3 NSWPB ACTIONS: Goal: A growing and geographically distributed population that meets the diverse needs of our communities. Specifically, a regional population that is higher in 2023 than it is in 2020. NSWPB’s actions: 1. Generate, collect, and analyze data and information on population trends, components of population growth, and the local labour market to make an evidence- informed case for population growth through migration, immigration, and natural growth. 2. Engage with employers, workers, education institutes, industry groups and associations and other partners through the WRT, Subject Matter Working Groups, roundtables, and other ventures to understand local needs, share resources, and develop plans that create work opportunities. 3. Deliver and support programming such as the Northwest Connector and Rural and Northern Immigration Pilot to connect jobseekers with opportunities in the region. The good news is that - contrary to popular opinion - the population in North Superior Workforce Planning Board’s area is growing again. As of 2019, there was approximately 154,000 people, about 98 per cent of which are in the Thunder Bay District. Statistics Canada’s annual population estimates – which adjust for net under-coverage in the census and approximate annual population change based on births, deaths, and migration – list the population in the NSWPB region of the Thunder Bay District at 151,556 in 2019, with another 2,843 in the five Ring of Fire communities.5 5 Counts for the individual communities came from a custom table from Community Data 16
Figure 1 shows that the region appears to be growing, after a decade of decline. The
population shrank by just over 2.8 per cent from 2006 to when it bottomed out in 2015 but
has since rebounded by 1.5 per cent.

Figure 1: Annual Population Estimates of the NSWPB Region (Thunder Bay District minus Osnaburgh and
                  Ojibway Nation of Saugeen plus Ring of Fire Communities) 2006-2019

      Source: Statistics Canada Population Estimates, July 1, by Census Division Table: 17-10-0139-01

                                                                                                        17
These figures are a shock, as they buck both long-term trends and common perceptions. It
appears that efforts to attract and retain newcomers from other countries are beginning
to pay off, as Figure 2 shows that this demographic was responsible for the growth.
Figure 2: Components of Population Growth, Thunder Bay District 2014-2019
Source: Statistics Canada Components of Population Change by Census Division Table: 17-10-0149-01
The growth beginning in 2015 coincided with a massive spike in the number of non-
permanent residents (PR) in the district. Despite the rapidly growing Indigenous population,
the NSWPB region saw more deaths than births, and more Canadian born people moved
out of the district than moved in in each of the past four years. The population still grew
however, due mainly to the increase in international students, temporary foreign workers,
and other temporary visa holders. Better still, these newcomers are young. Between 2015
and 2018, Thunder Bay District added roughly 2,109 non-permanent residents between the
ages of 15 and 24 (Statistics Canada 2020f).
This situation births three new challenges; first, transitioning visa holders, particularly
students, to permanent residency; second, addressing the fact that natural growth (births
minus deaths) and net migration within Canada are both negative; and third, distributing
newcomers across the region.
18Non-PRs, by definition, are limited in their ability to work and live in Canada. Two key
elements in this regard are a job that can support a candidate’s immigration and a desire
to stay. NSWPB and its community partners have been working to engage employers in
retaining talent through efforts such as the International and Community Matchmaker
Program, the Community Connector Program, the Local Immigration Partnership, and
the Talent Retention Roundtable. International migration was the difference between the
NSWPB region growing and shrinking, a situation that is not sustainable.
COVID-19 will virtually eliminate the most significant component of the region’s population
growth, at least in the short term. It could very easily reach the point that the population
will begin shrinking again. This ably demonstrates that, as crucial as immigration is, it
cannot be the sole source of population growth. The region also needs to attract people
from other parts of Canada and address the low birth rate.
Figure 1 above also shows a gradual reversal of migration within Canada. In 2014-2015,
687 more people moved from Thunder Bay Districts to other parts of Canada; a year later,
that number was under 400 and has since shrunk further to just over 200. It is still a net
loss to the region’s population but is trending in the right direction. Turning these numbers
to a positive is a crucial second component of the population growth strategy and that
requires increased efforts to attract people from outside Northern Ontario.
O’Connor Lookout, photo courtesy of the Township of O’Connor
19Rural Canada is the second largest source of newcomers to Thunder Bay District, behind
international migration. Table 1 shows the 20 regions of Canada that sent the most migrants
to the NSWPB region, along with the number that each sent from 2013-18. Regions with
a higher population than Thunder Bay District are highlighted. Those five larger urban
centres account for 200 of the total 1,467 migrants (14 per cent) to the district during this
time. On the other hand, Kenora and Rainy River Districts sent roughly 52 per cent of the
total, and another five per cent came from Cochrane District. This means that most of the
domestic migration to the District of Thunder Bay is not growing Northwestern Ontario’s
population.
Table 1: Top Migrant Source Census Divisions 2013-2018
Region 2013-2018 net Region 2013-2018 net
Kenora 560 Montréal 16
Rainy River 196 NW Alberta 16
Cochrane 88 Huron 16
Winnipeg 71 Gimli 13
Peel 44 Churchill 12
Durham 37 Peace River 10
East of Edmonton 34 Northern Rockies 10
York, ON 32 Baffin 9
La Vallé e-de-L’or 18 Prescott and Russell 9
York, NB 18 Morden 9
Source: Author’s calculations based on custom data from Ministry of Labour, Training, and Skills Development
Table 2, meanwhile, shows the top 20 regions in Canada that people from the Thunder
Bay District have migrated to. This time, regions that are roughly equal to, or smaller than
Thunder Bay are highlighted. All told, roughly 62 per cent of out migrants went to regions
with a higher population than Thunder Bay District. There is a clear trend where this region
attracts in-migrants primarily from more rural areas and sends out-migrants to more
populous ones.
20Table 2: Top Migrant Destination Census Divisions 2013-2018
Region 2013-2018 net Region 2013-2018 net
Toronto -330 Nipissing -90
Ottawa -307 Calgary -74
Middlesex -168 Halifax -60
Algoma -141 Nanaimo -60
Waterloo -138 Thompson-Nicola -53
Greater Vancouver -127 Hastings -52
Capital Region, BC -116 Fort McMurray -50
Central Okanagan -100 Canmore -42
Edmonton -98 Wellington -40
Essex -98 Frontenac -39
Source: Author’s calculations based on custom data from Ministry of Labour, Training, and Skills Development
Efforts to change this and attract newcomers from larger centres are yet to bear fruit.
Thunder Bay attracted more migrants from rural areas in every year from 2013-18 than
from Toronto in that entire timeframe (Statistics Canada 2019). Rural Canada remains
the largest domestic source of migrants to Thunder Bay District but, as Figure 1 shows,
migration within Canada remains a net negative for Thunder Bay District. The region will
need similar success attracting and retaining Canadian-born individuals as it has had
with international students to meet its population growth objectives.
NSWPB will continue to work on initiatives such as the Community Connector Program that
attract and retain people born in Canada and provide them opportunities to come or stay
here. The region’s young and growing Indigenous population has incredible potential to
narrow the skills gap. NSWPB will work to improve employment outcomes for Indigenous
peoples by working with community partners to bolster cultural inclusion and dedicating
a stream of the Connector program to helping Indigenous peoples find jobs in the region.
However, it is not enough to simply attract people to the region, the benefits of population
growth need to be distributed among the communities.
21Most of the region’s young newcomers appear to have found a home in the district’s largest
centre. The Thunder Bay Census Metropolitan Area (CMA) includes the City of Thunder
Bay, Oliver-Paipoonge, Shuniah, Neebing, Fort William First Nation, Conmee, O’Connor,
and Gillies. Figure 3 shows that the CMA has grown substantially from 2015 on, with 2019
marking its highest level since 2006.
Figure 3: Annual Population Estimates of Thunder Bay Census Metropolitan Area
Source: Statistics Canada Population Estimates, July 1, by Census Metropolitan Area and Census Agglomer-
ation Table 17-10-0135-01
Although the CMA has posted positive net intraprovincial migration each of the past
14 years, newcomers from other countries once again appear to be the driving force
behind the increase. Migration within Canada added an estimated 40 people to the CMA
population in 2018-19, whereas migration of immigrants and non-permanent residents
added 1,065. Meanwhile, there were approximately 251 more deaths than births (Statistics
Canada 2020e). It is also worth noting that another 5,000 people or so reside in nearby
unincorporated territory but are not included in the CMA totals. This means roughly 85 per
cent of the region’s population is in, or adjacent to, the City of Thunder Bay.
22The growing population in the CMA seems to mask declines outside of it. While the CMA
added an estimated 2,482 people from 2015 to 2018, the district grew by roughly 2,292. This
means the population outside the CMA shrunk by approximately 190. Part of the reason
could be that there have never been more than 30 immigrants to communities outside the
CMA in any given year.6 Nevertheless, Statistics Canada says that the Thunder Bay CMA
is one of the five slowest growing CMAs in the country, a distinction it has held every year
since the data was first tracked in 2006.
Part of building back better will mean population growth that meets the needs of the
eight municipalities, 19 First Nations, two distinct Métis Nation of Ontario communities
and several individual communities in unincorporated territory that are not within the
region’s largest hub. Figure 4 shows the population of the ten largest communities in this
category.
Figure 4: 10 Largest Geographic Communities Outside the CMA, 2019
Source: Statistics Canada Annual Population Estimates of Sub-Provincial Areas custom tabulation. *Lappe
is from Statistics Canada 2016 census of population
6 Author’s calculations based on Statistics Canada’s Components of Population Growth Tables, 17-10-0140-01
and 17-10-0136-01
23Nearly all these communities were smaller in 2019 than in 2006. This trend cannot continue if Northwestern Ontario is to prosper. Population growth strategies must also tend to the needs of smaller communities, which is why the Northwest Connector Program will expand to areas outside the CMA, to ensure they can meet their workforce needs. Other areas such as housing will need to be addressed, so that smaller communities in particular can accommodate the workers they need to attract. The sky has been buttressed and is no longer falling. Thanks to continued growth in the Indigenous population and strong and sustained efforts by regional institutions to attract students and workers from other countries, the NSWPB region appears to have finally reversed a decade of population decline. Now the goal will be to maintain that success in the age of COVID and to expand the benefits to communities outside the CMA. This will remain a top priority for NSWPB. POPULATION PROJECTIONS: Ontario’s Ministry of Finance (MoF) produces annual population projections for all districts in the province, offering a glimpse into the size of the future labour pool. These district forecasts unfortunately do not align perfectly with the NSWPB boundaries – they include Osnaburgh and the Ojibway Nation of Saugeen and omit the five communities in the Kenora District - but since they accounted for less than three per cent of the total population in the NSWPB region in 2016, they are unlikely to sway the results much. The population projections estimate annual changes in each component of population growth (births, deaths, in migration, out migration, net change in non-permanent residents) based on Statistics Canada’s population estimates for the most recent base year, in this case, 2018. Figure 5 shows the population projections from the previous Community Labour Market Plan compared to the updated forecasts. Of course, these were from before the pandemic, and are liable to have shifted dramatically given the role that international migration plays in the region’s population trends. 24
Figure 5: Thunder Bay District Population Projections

         Source: Ontario Ministry of Finance Population Projections 2018-2046 and 2016-2046

The growth since 2015 has had a profound impact on population projections. The inverted
U-shape from the 2016 forecasts has morphed, and the population is projected to peak
much higher and much sooner. Surprisingly, the district is now expected to grow over the
next 28 years, albeit by less than half a percentage point. Immigration, Refugees, and
Citizenship Canada data corroborates that non-permanent residents are keying this
growth.

There were 1,400 study permit holders in the CMA in 2015, and 3,020 in 2017. That is
115 per cent growth over two years. Data was only tracked for the first four months of
2018, but if it followed trends from previous years, there would have been roughly 3,700
study permit holders in 2018, another 22.5 per cent growth (Immigration, Refugees, and
Citizenship Canada 2019a). In the same vein, there were 110 Temporary Foreign Workers in
post-graduate employment in 2015, compared to 310 in 2017 and 485 in 2018 (Immigration,
Refugees, and CItizenship Canada 2019b).

                                                                                              25
While these projections provide some optimism, they may prove illusory if communities
are unable to retain the non-permanent residents that are driving the region’s growth.
These residents’ temporary status significantly curtails their labour force potential,
meaning much of the growing population can only contribute to the economy in limited
fashions. The Northwestern Connector Program, Rural and Northern Immigration Pilot,
and the Ontario Immigrant Nominee Program could prove to be valuable tools in helping
retain this key demographic and drive sustainable population growth. The influx of young
non-permanent residents appears to make a dent, albeit a small one, in another pressing
demographic trend: an ageing population.
SUSTAINABILITY:
A large share of the Thunder Bay District’s population already is, or soon will be, retirement
aged. Figure 6 shows that 16.1 per cent of the district population is set to reach the age of
65 in the next decade, while roughly one-fifth of people are already there.
Figure 6: Distribution of Thunder Bay District Population by Five-Year Age Cohort, 2018 and 2046
Source: Author’s calculations from Ontario Ministry of Finance Population Projections 2018-2046
26The line representing the forecasts for 2046 shows that the 20-24 age group is projected
to have the largest individual share of the total population in 2046, supplanting the 55-59
group that held the top spot in 2018. This is likely a result of the surge in 15 to 24-year-old
non-permanent residents over the last three years. It may not be reasonable to expect
similar growth rates in this cohort going forward, so these projections should be viewed
with some skepticism. At the same time, those over the age of 75 are projected to more
than double, collectively accounting for 17.5 per cent of the whole. The 45-64 group – those
most likely to have many years of work experience – is expected to decline significantly.
Replenishing the thousands of workers slated to transition to retirement age is a key
consideration in keeping the region sustainable.
NSWPB has worked with partners to estimate the impact of the ageing population on
individual sectors, notably through a partnership with Northern Policy Institute that led
to the publication of the March 2020 briefing note Assessing Labour Market Shortages in
the City of Thunder Bay. This is part of a larger analysis NSWPB has taken part in to track
the ratio of workers to dependents in the region.
27The Demographic Dependency Ratio (DDR) helps gauge community sustainability. It divides
the number of dependent-aged (0 to 14 and 65 and over) by working-aged people (15-64)
to produce a decimal representation of the population’s age distribution. A DDR of 0.5 is
widely viewed as optimal and indicates that there are two working-aged individuals for
each person outside typical working ages. A higher value indicates more dependent-aged
people, and lower values mean fewer potential dependents per working-aged person. It is
a crude metric, but it provides a glimpse into the labour force potential of a community or
region. Figure 7 shows the district’s DDR based on the MoF projections and compares it to
the anticipated DDR highlighted in the last community labour market plan.
Figure 7: Annual Projected DDR of Thunder Bay District, 2016 vs 2018 Population Projections
Source: Author’s Calculations from Ontario Ministry of Finance Population Projections 2018-2046 and 2016-
2046
Two years ago, Thunder Bay District was anticipated to reach its worst DDR value of 0.78
in 2036. The updated value based on the new projections is 0.71. That 0.07 difference may
seem insignificant, but it means that, by the time the district reaches its least sustainable
point, there are projected to be 140 working-aged people for every 100 dependents, rather
than 128 based on 2016 projections. That is noticeably better, but still well shy of the
optimal 2:1 ratio.
28However, studies on population growth in low-fertility countries are nearly universal in their
agreement that ‘replacement migration’ – attracting newcomers from other countries to
meet a demographic objective – by itself cannot sustain the ratio of working-age people
to dependents (United Nations Population Division 2000, Craveiro, et al. 2019, Coleman
2002, Bijak, Kupiszewska and Kupiszewski 2008). Replacement migration can grow the
population and slow the population ageing but not maintain a region’s DDR – at least not
without wholly unrealistic immigration targets.
The NSWPB region will need to find similar success attracting and retaining other groups
as it has had with international students. . Specifically, a successful population growth
strategy will involve retaining the working-aged people in the region and attracting
workers from other parts of Canada to reverse the net loss of population to intranational
migration.
Of course, a major factor in attracting and retaining people is a thriving economy with
plenty of opportunities – which is a second component of NSWPB’s recovery plan.
29Labour Force Characteristics 30
Inextricably linked to the declining population in the region has been a lack of opportunities
– or at least that perception. As the population has shrunk, important indicators such as the
participation rate and employment rate have also trended downward (Statistics Canada
2020). This means that a lower proportion of the dwindling population are engaged in
work. Recent years saw some improvement, which will need to continue in the coming
years.
ACTION PLAN ITEM: GOAL AND 3 NSWPB ACTIONS:

Goal: Abundant work opportunities in communities across the NSWPB region in a
variety of traditional and new sectors and a workforce with the skills to excel in them.
Specifically, a 2023 labour force that is larger than 2020, a 2023 participation rate higher
than 2020, and participation and employment rates for females and Indigenous peoples
that are higher than in 2020.
NSWPB’s Actions:
1.    Generate, collect, analyze, and share data and information on the regional
economy including on job demand, labour supply, sector outlooks, and skills inventories
and gaps to enable evidence-informed decisions regarding education and training and
attraction and retention.
2.    Engage with employers, workers, education institutes, industry groups and
associations and other partners through the WRT, Subject Matter Working Groups,
roundtables, and other ventures to understand local needs, share resources, and develop
plans that create work opportunities.
3.    Deliver and support programming such as WorkSCAPE Northwest and I Spy with
my LMI to make timely and relevant labour market information accessible to community
partners.

The cautiously optimistic trends that emerge from the population profile extend into the
labour force. Prior to the pandemic, the region was seeing improvement in all the major
labour force indicators, with a participation rate that reached levels not seen since the
Great Recession of 2008.

                                                                                           31
As Table 3 shows, all the most important available indicators in the CMA’s labour force
improved alongside the population figures – at least until 2019. Unfortunately, these data
are not released at the district or community level.
Table 3: Key Labour Force Statistics, Thunder Bay CMA 2008 and 2015-2019
2008 2015 2016 2017 2018 2019
Population 15
103,800 104,600 104,700 104,800 104,800 104,700
and Over
Labour Force 66,200 62,900 64,500 65,200 67,100 65,400
Not in Labour
37,600 41,700 40,200 39,600 37,700 39,400
Force
Participation
63.8 60.1 61.6 62.2 64 62.5
Rate (%)
Employment
60 57.1 57.4 58.7 60.8 58.9
Rate (%)
Unemployment
5.9 5.2 6.8 5.7 5.1 5.5
Rate (%)
Source: Statistics Canada Labour Force Characteristics by Census Metropolitan Area, Annual Table 14-10-
0096-01. Numbers are rounded to the nearest 100.
Not only are there more people in the CMA than at any point in the last decade, but in
2018 more of them were in the labour force, a greater share of them were either working
or looking for work, and a higher percentage were employed than at any point in recent
history. The last time the CMA saw comparable, albeit slightly worse, values in each of the
participation, employment, and unemployment rates was 2008. Both the labour force and
the number of people employed in 2018 were 6.7 per cent larger than in 2015, while the
number of those not in the labour force shrank by 9.6 per cent.
32Likewise, median incomes have risen in the CMA over the past five years. Table 4 shows
that the median income for all individuals in the CMA climbed 11 per cent between 2014
and 2018, for an average annual increase of 2.2 per cent. This is driven largely by 16 per
cent growth in median earnings for women. In actual terms, the median income of women
grew by over $4,700 over five years, allowing them to narrow the gap with their male
counterparts. However, they still earn considerably less than men in the NSWPB area.
Table 4: Median and Average Total Income ($) of Individuals in Thunder Bay CMA, by Sex 2014-2018
NSWPB
2014 2015 2016 2017 2018
Region
Median
35,840 36,940 37,350 38,600 39,790
Income
Median
Income 43,250 44,260 44,500 45,580 46,590
(males)
Median
Income (fe- 29,650 31,140 31,700 33,160 34,360
males)
Average In-
44,699 45,916 45,997 47,569 48,677
come
Average
Income 52,616 53,539 53,440 54,805 56,139
(males)
Average
Income (fe- 37,324 38,817 39,101 40,822 41,700
males)
Source: Statistics Canada Labour Force Labour Income Profile of Tax Filers by Sex, Annual. Table 11-10-0031-01
33Men in the region made, on average, about 14,000 dollars more per year than women. This data does not include the type of jobs or hours worked, so cannot shed light on ‘equal pay for equal work’ discussions, but it does demonstrate the gap in earnings more generally. Whether due to the fact that women are more likely to work part-time (discussed below), work in jobs with lower earning potential, or are not compensated the same as a male colleague, they still earn considerably less. While women do not make as much as men in the region, both groups earn more than their counterparts in Ontario and Canada. The median income in the CMA has been at least seven per cent higher than the provincial and national medians every year since 2014. The gap is shrinking, however; the local median was nearly 11 per cent higher than the province in 2014, while the difference in 2018 was 7.4 per cent (Statistics Canada 2020g). The strong earning potential, combined with the relatively low cost of living (Noga 2020) represent incredible material to market the Thunder Bay District as a great place to live, with abundant well-paying job opportunities. Figure 8 shows the distribution of employment by occupation type. Unsurprisingly, the composition of work in the region did not change much between 2011 and 2016. Occupations in health were the only group that fluctuated by more than one percentage point, growing by 1.4 per cent to comprise roughly one in every 11 jobs in the region. COVID-19 may throw this into disarray, given the immense toll it has taken on service jobs. Coupled with automation, many of the more than 17,000 people in these jobs may be forced into other occupations. 34
Figure 8: Share of the Workforce, By National Occupation Classification (NOC), NSWPB Region. 2011 and 2016

                        Source: Statistics Canada Census Data, Custom Tabulation

The Brookfield Institute for Innovation and Entrepreneurship out of Ryerson University
has launched a major project to identify pathways that lead from these types of jobs -
specifically when it comes to food and grocery businesses – to new jobs in in-demand fields.
The results may be incorporated into WorkSCAPE Northwest’s Career Explorer Tool, which
will make it easier for those at risk to transition to new opportunities. Discussions with
community partners have highlighted the need to smooth transitions, not only between
careers but also from education/training to the workforce. Lowering or eliminating these
barriers will improve the flow of talent to in-demand industries, which will build upon the
momentum the region had been developing prior to the pandemic.
This topic was highlighted in the CEDC’s Mining Readiness Strategy, which emphasized
the need for a steady pipeline of talent into careers in mining (TBCEDC 2021). There are
various potential labour pools to fill this gap, from those currently in the forestry and
construction sectors, to high-school students set to enter the workforce, to those that have
been or will be displaced by COVID-related disruptions, to women looking to transition
into non-traditional sectors, and, perhaps most notably, the Indigenous population in the
communities that will be most directly impacted by mining operations. Identifying the

                                                                                                       35
unique barriers each group faces and the supports they need can help the region proactively
address the expected need for thousands or workers in the mining sector. Success in these
initiatives can build on and reinforce the positive trends the region was experiencing in the
growth of quality jobs.
Full-time workers are accounting for a larger share of all workers, which Table 5
demonstrates. However, the pandemic could disrupt this trend. The rise of digital platforms
was opening a new avenue to an age-old reality – the gig economy (Ziegler, et al. 2020).
COVID forced more people online to various platforms while simultaneously displacing
one and half million Canadian workers from their jobs, potentially accelerating this trend.
There are profound implications on how to align the labour market to this new reality.
Table 5: Key Employment Status Statistics, Thunder Bay CMA 2008 and 2015-2019
2008 2015 2016 2017 2018 2019
Employed 62,300 59,700 60,100 61,500 63,700 61,700
Employed
30,300 29,600 30,000 30,100 32,300 31,600
Males
Employed
32,000 30,100 30,200 31,400 31,400 30,200
Females
Employed
47,400 45,900 46,600 47,400 49,500 49,300
Full-Time
Employed
14,900 13,700 13,500 14,100 14,200 12,500
Part-Time
Full-Time
as Percent
76.1% 73.7% 74.8% 76.1% 79.5% 79.9%
of all Em-
ployment
Source: Statistics Canada Labour Force Characteristics by Census Metropolitan Area, Annual Table 14-10-
0096-01
Table 6, meanwhile, shows that a large majority of those working part-time are females.
Of note, 86.7 per cent of working males worked full-time in 2019, compared to 72.5 for
employed females. And, as Table 6 indicates, there are roughly two females working part-
time for every male in the CMA.
36Table 6: Employment Status by Gender, Thunder Bay CMA 2008 and 2015-2019
2008 2015 2016 2017 2018 2019
Males in Full-Time
25,500 25,200 25,400 25,600 27,200 27,400
Employment
Females in Full-Time
21,900 20,700 21,200 21,900 22,300 21,900
Employment
Males in Part-Time
4,800 4,400 4,500 4,600 5,100 4,200
Employment
Females in Part-Time
10,100 9,400 9,000 9,500 9,100 8,300
Employment
Males as Percent of
53.8% 54.9% 54.5% 54.0% 54.9% 55.6%
Full-Time Employment
Females as Percent of
46.2% 45.1% 45.5% 46.2% 45.1% 44.4%
Full-Time Employment
Males as Percent of
32.2% 32.1% 33.3% 32.6% 35.9% 33.6%
Part-Time Employment
Females as Percent of
67.8% 68.6% 66.7% 67.4% 64.1% 66.4%
Part-Time Employment
Source: Statistics Canada Labour Force Characteristics by Census Metropolitan Area, Annual Table 14-10-
0096-01
This is especially relevant during the pandemic, which has been widely termed a ‘she-
cession’ for the disproportionate impact it has had on women at work and at home.
By June 2020, when the economic ramifications of the pandemic were at their worst in
the Thunder Bay CMA (as of time of writing), the employment rate for females dropped
under 50 per cent (Statistics Canada 2020b). In other words, fewer than half the female
population aged 15 years or older was employed. In June 2019, the rate was over 57 per
cent. Women are traditionally employed in sectors that were hit hardest by the pandemic,
such as services that could not be carried out remotely.
37Women with young children were exceptionally hard hit. Table 7 explores the difference
in actual hours worked versus usual hours for a variety of household types. Those women
that remained in the workforce while having a youngest child under the age of six – a
number that was approximately 2,000 lower in October than in March – report losing at
least one-third of their typical hours in every month of the pandemic. Men with children of
the same age report far less drastic losses. In fact, men with young children typically lost
a smaller share of their hours than women with no children, or whose youngest child was
25 or older.
Table 7: Percentage Change in Average Actual vs Usual Hours Worked per Week by Age of Youngest Child,
Northwestern Ontario, March to October 2020
March April May June July Aug Sept Oct
Women with
youngest child -37.3 -39.8 -42.5 -33.1 -36.8 -37.1 -39.4 -34.1
under 6
Men with
youngest child -14.4 -18.2 -20.5 -18 -19.9 -17.1 -14.4 -7.7
under 6
Women with
youngest child -20.6 -25.8 -29.8 -18.7 -19.1 -23.4 -20.3 -17.1
6-11
Men with
youngest child -12.7 -18.7 -21.1 -13.1 -5.9 -3.3 -1.9 -2
6-11
Women with
no children -14.5 -21.3 -26.5 -21.8 -17.8 -16.1 -15.7 -16.1
under 25
Source: Statistics Canada Labour Force Survey Custom Tabulation
There are a couple of caveats to the data. First, parents with young children typically
reported a drop in their hours worked in 2018 and 19 as well, however the magnitude of
hours lost is much higher in 2020. Women with a child under the age of six typically reported
a loss of 20-30 per cent. This indicates yet again that these issues were not birthed by the
pandemic, but it certainly exacerbated them. Second, the fact that men’s actual hours
tend to be higher mean their percentage of hours lost will inherently be smaller.
38You can also read