One Thousand and One Hours: Self-driving Motion Prediction Dataset
←
→
Page content transcription
If your browser does not render page correctly, please read the page content below
Dataset version: 1.0
One Thousand and One Hours: Self-driving Motion Prediction Dataset
John Houston, Guido Zuidhof, Luca Bergamini, Yawei Ye,
Ashesh Jain, Sammy Omari, Vladimir Iglovikov, and Peter Ondruska
Lyft Level 5
arXiv:2006.14480v1 [cs.CV] 25 Jun 2020
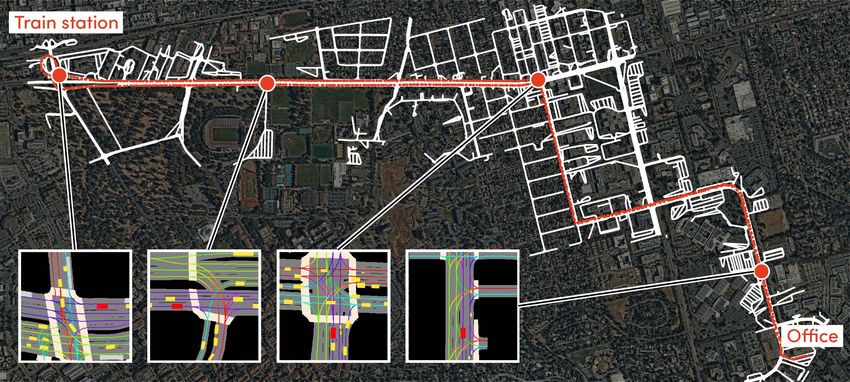
Figure 1: An overview of the released dataset for motion modelling, consisting of 1,118 hours of recorded self-driving
perception data on a route spanning 6.8 miles between the train station and the office (red). The examples on the bottom-left
show released scenes on top of the high-definition semantic map that capture road geometries and the aerial view of the area.
Abstract 1. Introduction
We present the largest self-driving dataset for motion The availability of large-scale datasets has been a large
prediction to date, with over 1,000 hours of data. This was contributor to AI progress in the recent decade. In the
collected by a fleet of 20 autonomous vehicles along a fixed field of self-driving vehicles (SDV), several datasets, such
route in Palo Alto, California over a four-month period. It as [9, 6, 13] enabled great progress in the development of
consists of 170,000 scenes, where each scene is 25 seconds perception systems [14, 16, 24, 20]. These let the self-
long and captures the perception output of the self-driving driving vehicle process its LiDAR and camera sensors to
system, which encodes the precise positions and motions of understand the positions of other traffic participants includ-
nearby vehicles, cyclists, and pedestrians over time. On ing cars, pedestrians and cyclists around the vehicle.
top of this, the dataset contains a high-definition seman- Perception, however, is only the first step in the modern
tic map with 15,242 labelled elements and a high-definition self-driving pipeline. Much work needs to be done around
aerial view over the area. Together with the provided soft- data-driven motion prediction of traffic participants, trajec-
ware kit, this collection forms the largest, most complete tory planning, and simulation before self-driving vehicles
and detailed dataset to date for the development of self- can become a reality. Datasets for developing these methods
driving, machine learning tasks such as motion forecast- differ from those used for perception, in that they require
ing, planning and simulation. The full dataset is available large amounts of behavioural observations and interactions.
at http://level5.lyft.com. These are obtained by combining the output of perception
systems with an understanding of the environment in the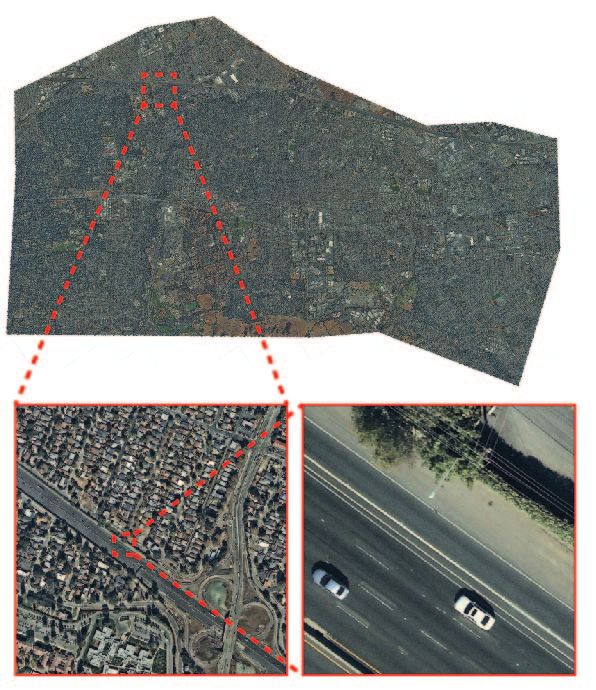
Figure 2: An example of a state-of-the-art self-driving pipeline. First, the raw LiDAR and camera data are processed to
detect the positions of nearby objects around the vehicle. Then, their motion is predicted to allow the SDV to plan a safe
collision-free trajectory. The released dataset enables the modelling of a motion prediction component.

form of a semantic map that contains priors over expected            2. Related Work
behaviour. Broad availability of datasets for these down-
stream tasks is much more limited and mostly available only              In this section we review related existing datasets for
to large-scale industrial efforts in the form of in-house col-       training autonomous vehicle (AV) systems from the view-
lected data. This limits the progress within the computer vi-        point of a classical state-of-the-art self-driving stack sum-
sion and robotics communities to advance modern machine              marised in Figure 2. In this stack, first, the raw sensor input
learning systems for these important tasks.                          is processed by a perception system to estimate positions
                                                                     of nearby vehicles, pedestrians, cyclists and other traffic
    In this work, we share the largest and most detailed
                                                                     participants. Next, the future motion and intent of these
dataset to date for training motion prediction solutions. We
                                                                     actors is estimated and used for planning vehicle maneu-
are motivated by the following scenario: a self-driving fleet
                                                                     vers. In Table 1 we summarise the current leading datasets
serving a single high-demand route, rather than serving a
                                                                     when training machine learning solutions for different com-
broad area. We consider this to be a more feasible deploy-
                                                                     ponents of this stack focusing mainly on the perception and
ment strategy for rideshare, since self-driving vehicles can
                                                                     prediction components.
be allocated to particular routes while human drivers serve
the remaining traffic. This focus allows us to bound the                 Perception datasets The perception task is usually
system performance requirements and accident likelihood,             framed as the supervised task of estimating 3D position of
both key factors for real-world self-driving deployment. In          nearby objects around the AV. Deep learning approaches
summary, the released dataset consists of:                           are now state of the art for most problems relevant for au-
                                                                     tonomous driving, such as 3D object detection and semantic
                                                                     segmentation [20, 24, 16, 14].
  • The largest dataset to date for motion prediction, com-
                                                                         Among the datasets for training these systems the KITTI
    prising 1,000 hours of traffic scenes capturing the mo-
                                                                     dataset [9] is the most known benchmarking dataset for
    tions of traffic participants around 20 self-driving ve-
                                                                     many computer vision and autonomous driving related
    hicles, driving over 26,000 km along a suburban route.
                                                                     tasks. It contains around 6 hours of driving data, recorded
                                                                     from front-facing stereo cameras, LiDAR and GPS/IMU
  • The most detailed high-definition (HD) semantic map              sensors. 3D bounding box annotations are available, in-
    of the area, counting over 15,000 human annotations              cluding classifications into different classes such as cars,
    including 8,500 lane segments.                                   trucks and pedestrians. The Waymo Open Dataset [21] and
                                                                     nuScenes [3] are of similar size and structure, providing 3D
                                                                     bounding box labels based on fused sensory inputs. The
  • A high-resolution aerial image of the area, spanning             Oxford RobotCar dataset also allows application for visual
    74 km2 at a resolution of 6 cm per pixel, providing              tasks, but the focus lies more on localisation and mapping
    further spatial context about the environment.                   rather than object detection.
                                                                         Our dataset’s main target is not to train perception sys-
  • L5Kit - a Python software library for accessing the              tems. Instead, it is a product of an already trained percep-
    dataset, together with a baseline machine learning so-           tion system used to process large quantities of new data for
    lution for the motion prediction task.                           motion prediction. For this we refer to the Lyft Level 5 AV

                                                                 2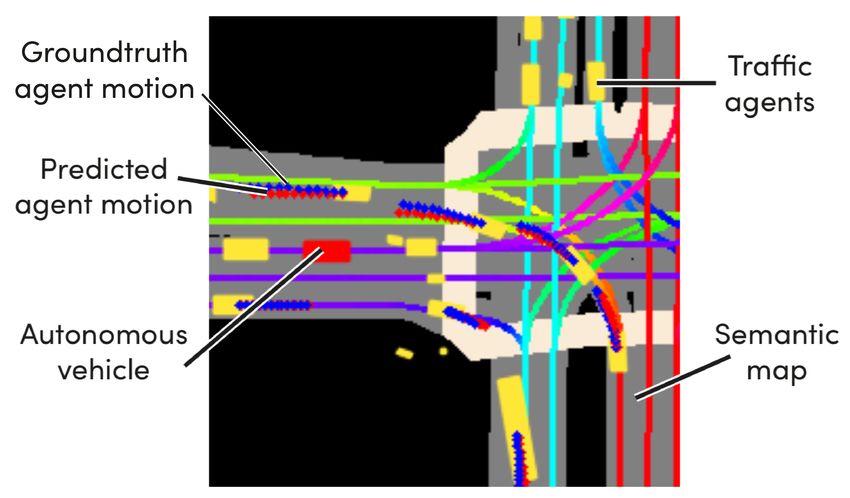
Name                   Size      Scenes                    Map                      Annotations           Task
            KITTI [9]                  6h        50                    None                    3D bounding boxes     Perception
      Oxford RobotCar [18]          1,000km     100+                   None                              -           Perception
    Waymo Open Dataset [21]            10h      1000                   None                    3D bounding boxes     Perception
  ApolloScape Scene Parsing [22]       2h         -                    None                    3D bounding boxes     Perception
  Argoverse 3D Tracking v1.1 [6]       1h        113    Lane center lines, lane connectivity   3D bounding boxes,    Perception
   Lyft Perception Dataset [13]       2.5h       366        Rasterised road geometry           3D bounding boxes     Perception
                                                                                               3D bounding boxes,    Perception,
           nuScenes [3]               6h        1000            Rasterised road geometry
                                                                                                   trajectories      Prediction
    ApolloScape Trajectory [17]       2h         103                   None                       Trajectories       Prediction
   Argoverse Forecasting v1.1 [6]    320h       324k    Lane center lines, lane connectivity      Trajectories       Prediction
                                                           Road geometry, aerial map,
      Lyft Prediction Dataset       1,118h      170k                                               Trajectories       Prediction
                                                           crosswalks, traffic signs, ...

Table 1: A comparison of various self-driving datasets available up-to date. Our dataset surpasses all others in terms of size,
as well as level of detail of the semantic map (see Section 3).

Dataset [13], that was collected along the same geographi-           provide a high-resolution aerial image of the area. This is
cal route and that was used to train the included perception         motivated by the fact that much of the information encoded
system.                                                              in the semantic map is implicitly accessible in the aerial
   Prediction datasets The prediction task builds on top of          form. Providing this map can, therefore, unlock the devel-
perception by trying to predict the output of the perception         opment of semantic-map free solutions.
system a few seconds into the future. As such, it differs in
terms of needed information for both training and evalua-            3. Dataset
tion. It builds on top of well-established perception systems
and, in order to allow for good results, labelled bounding              Here we outline the details of the released dataset, in-
boxes alone are not sufficient: one needs significantly more         cluding the process that was used to construct it. An
detailed information about the environment including, for            overview of different dataset statistics can be found in Table
example, semantic maps that encode possible driving be-              2.
haviour to reason about future behaviours.
   Deep learning solutions leveraging the birds-eye-view
(BEV) representation of the scene [1, 10, 15, 7, 5, 12] or
graph neural networks [4, 8] have established themselves
as the leading solutions for this task. Representative large-
scale datasets for training these systems are, however, rare.
The above mentioned solutions were developed almost ex-
clusively by industrial labs leveraging internal proprietary
datasets.
    The most relevant existing open dataset is the Argoverse
Forecasting dataset [6] providing 300 hours of perception
data and a lightweight HD semantic map encoding lane cen-
ter positions. Our dataset differs in three substantial ways:
1) Instead of focusing on a wide city area we provide 1000
hours of data along a single route. This is motivated by the
assumption that, particularly in ride-hailing applications,
first applications of deploying self-driving fleets are more
likely to occur along few high-demand routes. This makes
it possible to bound requirements and quantify accident risk.
2) We are contributing higher-quality scene data by provid-
ing full perception output including bounding boxes, class           Figure 3: The self-driving vehicle configuration used to col-
probabilities instead of pure centroids. In addition, our se-        lect the data. Raw data from LiDARs and cameras were
mantic map is more complete: it counts more than 15,000              processed by perception system to generate the dataset, cap-
human annotations instead of only lane centers. 3) We also           turing the poses and motion of nearby vehicles.

                                                                 3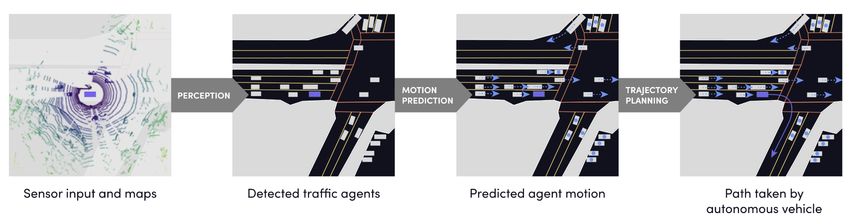
Figure 4: Examples from the scenes in the dataset, projected over a birds-eye-view of the rasterised semantic map. The
self-driving vehicle is shown in red, other traffic participants in yellow, and lane colour denotes driving direction. The dataset
contains of 170k such sequences, each 25 seconds long with sensor data at 10Hz.

   The dataset has three components:                                 at 10 Hz, while the bumper LiDARs have 40 channels. All
                                                                     seven cameras are mounted on the roof and together have
 1. 170k scenes, each 25 seconds long, capturing the                 a 360 degree horizontal field of view. Four radars are also
    movement of the self-driving vehicle and traffic par-            mounted on the roof, and one radar is placed on the forward-
    ticipants around it.                                             facing front bumper.
 2. A high-definition semantic map capturing the road                   The dataset was collected between October 2019 and
    rules and lane geometry and other traffic elements.              March 2020. It was captured during daytime, between 8
                                                                     AM and 4 PM. For each scene we detected the visible traffic
 3. A high-resolution aerial picture of the area that can be         participants, including vehicles, pedestrians, and cyclists.
    used to further aid the prediction.                              Each traffic participant is internally represented by a 2.5D
                                                                     cuboid, velocity, acceleration, yaw, yaw rate, and a class
3.1. Scenes                                                          label. These traffic participants are detected using our in-
                                                                     house perception system, which fuses data across multiple
   The dataset consists of 170,000 scenes, each 25 seconds
                                                                     modalities to produce a 360 degree view of the world sur-
long, totalling over 1,118 hours of logs. Example scenes are
                                                                     rounding the SDV. Table 2 outlines some more statistics for
shown in Figure 4. All logs were collected by a fleet of self-
                                                                     the dataset.
driving vehicles driving along a fixed route. The sensors
for perception include 7 cameras, 3 LiDARs, and 5 radars                We split the dataset into train, validation and test sec-
(see Figure 3). The sensors are positioned as follows: one           tions in a 83–7–10% ratio, where a particular SDV only
LiDAR is on the roof of the vehicle, and two LiDARs on the           contributes to a single section. We encode the dataset in the
front bumper. The roof LiDAR has 64 channels and spins               form of n-dimensional compressed zarr arrays. The zarr

                                                                 4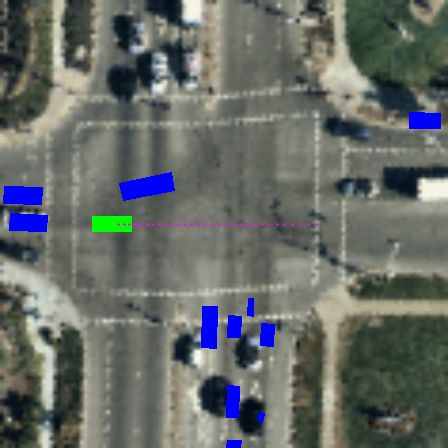
Statistic                                     Value
               # self driving vehicles used                  20
               Total data set size                           1,118 hours / 26,344 km / 162k scenes
               Training set size                             928 hours / 21,849 km / 134k scenes
               Validation set size                           78 hours / 1,840 km / 11k scenes
               Test set size                                 112 hours / 2,656 km / 16k scenes
               Scene length                                  25 seconds
               Total # of traffic participant observations   3,187,838,149
               Average # of detections per frame             79
               Labels                                        Car: 92.47% / Pedestrian: 5.91% / Cyclist: 1.62%
               Semantic map                                  15,242 annotations / 8,505 lane segments
               Aerial map                                    74 km2 at 6 cm per pixel

                                          Table 2: Statistics of the released dataset.

format 1 was chosen to represent individual scenes. This              The semantic map is given in the form of a protocol
allows for fast random access to different portions of the         buffer2 . We provide precise road geometry through the en-
dataset while minimising the memory footprint, which al-           coding of the lane segments, their connectivity, and other
lows efficient distributed training on the cloud.                  properties (as summarised in Table 3).

3.2. High-definition semantic map
    The HD semantic map that we provide encodes infor-
mation about the road itself, and various traffic elements           2 https://developers.google.com/protocol-buffers
along the route totalling 15,242 labelled elements including
8,505 lane segments. This map was created by human cura-
tors who annotated the underlying localisation map, which
in turn was created using a simultaneous localisation and
mapping (SLAM) system. Given the use of SLAM, the po-
sition of the SDV is always known with centimetre-grade
accuracy. Thus, the information in the semantic map can be
used both for planning driving behaviour and for anticipat-
ing the future movements of other traffic participants.
  1   https://zarr.readthedocs.io/

 Property              Values
 Lane boundaries       sequence of (x, y, z) coordinates
 Lane connectivity     possible lane transitions
 Driving directions    one way, two way
 Road class            primary, secondary, tertiary, ...
 Road paintings        solid, dashed, colour
 Speed limits          mph
 Lane restrictions     bus only, bike only, turn only, ...
 Crosswalks            position
 Traffic lights        position, lane association
 Traffic signs         stop, turn, yield, parking, ...
 Restrictions          keep clear zones, no parking, ...
 Speed bumps           position

Table 3: Elements of the provided HD semantic map. We              Figure 5: An overview of the included aerial map of Palo
provide 15,242 human annotations including 8,505 individ-          Alto, California in the dataset surrounding the driving route.
ual lane segments.                                                 The map covers 74km2 at a resolution of 6 cm per pixel.

                                                               5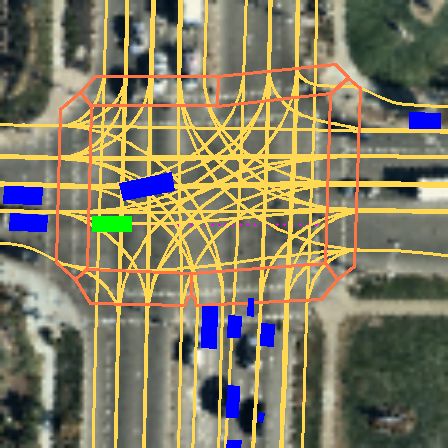
3.3. Aerial map
   The aerial map captures the area of Palo Alto that sur-
rounds the route at a resolution of 6 cm per pixel3 . It en-
ables the use of spatial information to aid with motion pre-
diction. Figure 5 shows the map coverage and the level of
detail. The covered area of 74 km2 and is provided as 181
GeoTIFF tiles of size 10560 × 10560 pixels, each spanning
approximately 640 × 640 meters.

4. Development tools
   Together with the dataset, we are releasing a python
                                                                     Figure 7: Example output of the motion prediction solution
toolkit named L5Kit. It provides access to some ease-
                                                                     supplied as part of the software development kit. A convo-
of-use functionalities and a full sample motion prediction
                                                                     lution neural network takes rasterised scenes around nearby
pipeline which can be viewed as a baseline. It is available at
                                                                     vehicles as input, and predicts their future motion.
https://github.com/lyft/l5kit/ and contains
the following components:
   Multi-threaded data loading and sampling. We pro-
                                                                     ity and multi-threading to make it suitable for distributed
vide wrappers around the raw data files that can sample
                                                                     machine learning.
scenes and load the data efficiently. Scenes can be sampled
from multiple points of view: for prediction of the ego ve-              Customisable scene visualisation and rasterisation.
hicle motion path, we can center the scene around our SDV.               We provide several functions to visualise and rasterise
For predicting the motions of other traffic participants, we         a sampled scene. Our visualisation package can draw ad-
provide the functionality to recenter the scene around those         ditional information, such as the future trajectory, onto an
traffic participants. This process is optimised for scalabil-        RGB image and save files as images, GIFs or full scene
                                                                     videos.
  3 The aerial map is provided by NearMap https://www.nearmap.
                                                                         We support several different rasterisation modes for cre-
com/.
                                                                     ating a meaningful representation for the underlying image.
                                                                     Figure 6 shows example images generated by the differ-
                                                                     ent modes and created from either the semantic map (upper
                                                                     right image) or the aerial map (lower right), or a combina-
                                                                     tion of both (lower left). Such images can then be used as
                                                                     input to a conventional machine learning pipeline akin to
                                                                     [2, 7].
                                                                         Baseline motion prediction solution. In addition to the
                                                                     above-described functionalities, we also provide a complete
                                                                     training pipeline for a motion prediction task including a
                                                                     baseline experiment in Pytorch [19]. This was designed to
                                                                     show how the data can be used for the task at hand. It also
                                                                     includes several helpful functions to ease training with our
                                                                     data, such as data loader classes and evaluation functions.
                                                                         The presented end-to-end motion prediction pipeline
                                                                     should serve as a baseline and was inspired by the works
                                                                     of [2, 23]. Concretely, the task is to predict the expected
                                                                     future (x,y) positions over a 5-second-horizon for different
                                                                     traffic participants in the scene given their current positions.
                                                                     Implementation-wise, we use a ResNet-50 backbone [11]
                                                                     with L2 loss that was trained on 224 × 224 BEV rasters
                                                                     centered around several different vehicles of interest. To
Figure 6: Examples of different birds-eye-view scene ras-            improve accuracy, we can also provide history of vehicle
terisations that can be made using the associated software           movements over past few seconds by simply stacking BEV
development kit. These can be used, for example, as an in-           rasters together. This allows network to implicitly compute
put to a convolution neural network architecture.                    agents current velocity and heading. Figure 7 displays typ-

                                                                 6
Configuration                                       Displacement [m]
                   Map raster type History length          @0.5s        @1s    @2s @3s @4s               @5s      ADE
                   Semantic        0 sec                   0.61         1.15   2.25 3.38 4.58            5.87     2.81
                   Semantic        1sec                    0.42         0.84   1.76 2.71 3.78            5.00     2.28

Table 4: Performance of the baseline motion prediction solution on the dataset. We list the displacement error for different
prediction horizons.

ical predictions after training each vehicle on this architec-            [4] S. Casas, C. Gulino, R. Liao, and R. Urtasun. Spatially-
ture for 38k iterations with a batch size 64.                                 aware graph neural networks for relational behavior forecast-
    Table 4 summarises the displacement error at various                      ing from sensor data. Int. Conf. on Robotics and Automation
prediction horizons for different configurations (the L2 -                    (ICRA), 2020.
norm between the predicted point and the true poition at                  [5] Y. Chai, B. Sapp, M. Bansal, and D. Anguelov. Multipath:
horizon T ), as well as the displacement error averaged over                  Multiple probabilistic anchor trajectory hypotheses for be-
all timesteps (ADE).                                                          havior prediction. 2019.
                                                                          [6] M. Chang, J. Lambert, P. Sangkloy, J. Singh, S. Bak, A. Hart-
5. Conclusion                                                                 nett, D. Wang, P. Carr, S. Lucey, D. Ramanan, and J. Hays.
                                                                              Argoverse: 3d tracking and forecasting with rich maps. Int.
    The dataset introduced in this paper is the largest and the               Conf. on Computer Vision and Pattern Recognition (CVPR),
most detailed dataset available for training prediction solu-                 2019.
tions. It is three times larger and significantly more descrip-           [7] H. Cui, V. Radosavljevic, F. Chou, T. Lin, T. Nguyen, T.
tive than the current best alternative [6]. Although it was tai-              Huang, J. Schneider, and N. Djuric. Multimodal trajectory
lored towards the motion prediction task, we believe the rich                 predictions for autonomous driving using deep convolutional
observational data that additionally describes the motion of                  networks. Int. Conf. on Robotics and Automation (ICRA),
                                                                              2019.
all other traffic participants can also be used in the develop-
ment of new machine learning solutions for the downstream                 [8] J. Gao, C. Sun, H. Zhao, Y. Shen, D. Anguelov, C. Li, and
                                                                              C. Schmid. Vectornet: Encoding hd maps and agent dynam-
tasks within planning and simulation akin to the recently
                                                                              ics from vectorized representation. Int. Conf. on Computer
proposed works of [2, 23]. We believe that publicising this
                                                                              Vision and Pattern Recognition (CVPR), 2020.
dataset marks an important next step towards the democrati-
                                                                          [9] A. Geiger, P. Lenz, C. Stiller, and R. Urtasun. Vision meets
sation within the development of self-driving applications.
                                                                              robotics: The kitti dataset. Int. Journal of Robotics Research
This, in turn, can result in faster progress towards a fully au-              (IJRR), 2013.
tonomous future. For additional questions about the dataset
                                                                         [10] A. Gupta, J. Johnson, L. Fei-Fei, S. Savarese, and A. Alahi.
feel free to reach out to level5data@lyft.com.                                Social gan: Socially acceptable trajectories with generative
                                                                              adversarial networks. In Int. Conf. on Computer Vision and
6. Acknowledgements                                                           Pattern Recognition, 2018.
  This work was done thanks to many members of the                       [11] K. He, X. Zhang, S. Ren, and J. Sun. Deep residual learning
                                                                              for image recognition. Int. Conf. on Computer Vision and
Lyft Level 5 team. Specifically, we would like to thank
                                                                              Pattern Recognition (CVPR), 2016.
Emil Praun, Christy Robertson, Oliver Scheel, Stefanie
                                                                         [12] J. Hong, B. Sapp, and J. Philbin. Rules of the road: Predict-
Speichert, Liam Kelly, Chih Hu, Usman Muhammad, Lei
                                                                              ing driving behavior with a convolutional model of seman-
Zhang, Dmytro Korduban, Jason Zhao and Hugo Grimmett.
                                                                              tic interactions. Int. Conf. on Computer Vision and Pattern
                                                                              Recognition (CVPR), 2019.
References                                                               [13] R. Kesten, M. Usman, J. Houston, T. Pandya, K. Nadhamuni,
 [1] A. Alahi, K. Goel, V. Ramanathan, A. Robicquet, L. Fei-Fei,              A. Ferreira, M. Yuan, B. Low, A. Jain, P. Ondruska, S.
     and S. Savarese. Social lstm: Human trajectory prediction in             Omari, S. Shah, A. Kulkarni, A. Kazakova, C. Tao, L. Platin-
     crowded spaces. Int. Conf. on Computer Vision and Pattern                sky, W. Jiang, and V. Shet. Lyft level 5 av dataset 2019. 2019.
     Recognition (CVPR), 2016.                                           [14] A. H. Lang, S. Vora, H. Caesar, L. Zhou, J. Yang, and O.
 [2] M. Bansal, A. Krizhevsky, and A. Ogale. Chauffeurnet:                    Beijbom. Pointpillars: Fast encoders for object detection
     Learning to drive by imitating the best and synthesizing the             from point clouds. Int. Conf. on Computer Vision and Pattern
     worst. Robotics: Science and Systems (RSS), 2019.                        Recognition (CVPR), 2018.
 [3] H. Caesar, V. Bankiti, A. H. Lang, S. Vora, V. E. Liong,            [15] N. Lee, W. Choi, P. Vernaza, C. B. Choy, P. H. S. Torr, and
     Q. Xu, A. Krishnan, Y. Pan, G. Baldan, and O. Beijbom.                   M. K. Chandraker. Desire: Distant future prediction in dy-
     nuscenes: A multimodal dataset for autonomous driving.                   namic scenes with interacting agents. Int. Conf. on Computer
     arXiv preprint arXiv:1903.11027, 2019.                                   Vision and Pattern Recognition (CVPR), 2017.

                                                                    7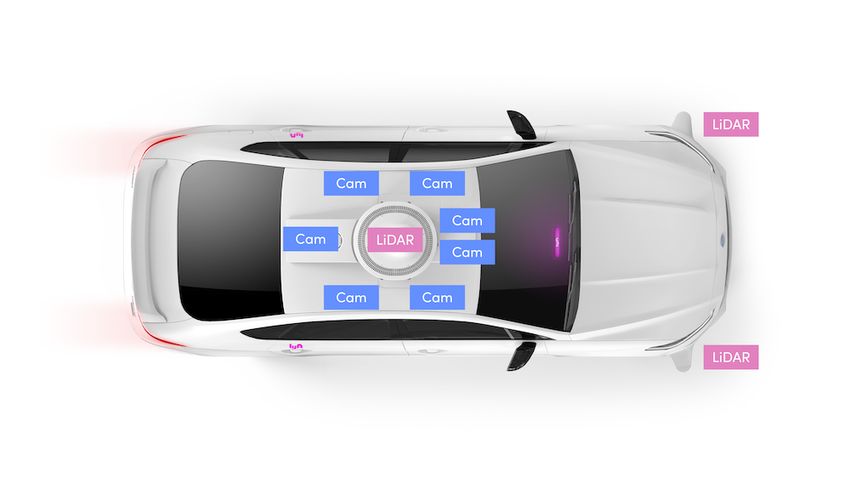
[16] M. Liang, B. Yang, Y. Chen, R. Hu, and R. Urtasun. Multi-
     task multi-sensor fusion for 3d object detection. Int. Conf.
     on Computer Vision and Pattern Recognition, 2019.
[17] Y. Ma, X. Zhu, S. Zhang, R. Yang, W. Wang, and D.
     Manocha. Trafficpredict: Trajectory prediction for hetero-
     geneous traffic-agents. AAAI Conference on Artificial Intel-
     ligence, 2019.
[18] W. Maddern, G. Pascoe, C. Linegar, and P. Newman. 1
     year, 1000km: The oxford robotcar dataset. Int. Journal of
     Robotics Research (IJRR), 2017.
[19] A. Paszke, S. Gross, F. Massa, A. Lerer, J. Bradbury, G.
     Chanan, T. Killeen, Z. Lin, N. Gimelshein, L. Antiga, A.
     Desmaison, A. Kopf, E. Yang, Z. DeVito, M. Raison, A.
     Tejani, S. Chilamkurthy, B. Steiner, L. Fang, J. Bai, and S.
     Chintala. Pytorch: An imperative style, high-performance
     deep learning library. Advances in Neural Information Pro-
     cessing Systems (NeurIPS), 2019.
[20] C. R. Qi, W. Liu, C. Wu, H. Su, and L. J. Guibas. Frus-
     tum pointnets for 3d object detection from RGB-D data. Int.
     Conf. on Computer Vision and Pattern Recognition (CVPR),
     2018.
[21] P. Sun, H. Kretzschmar, X. Dotiwalla, A. Chouard, V. Pat-
     naik, P. Tsui, J. Guo, Y. Zhou, Y. Chai, B. Caine, V. Vasude-
     van, W. Han, J. Ngiam, H. Zhao, A. Timofeev, S. Ettinger,
     M. Krivokon, A. Gao, A. Joshi, Y. Zhang, J. Shlens, Z. Chen,
     and D. Anguelov. Scalability in perception for autonomous
     driving: Waymo open dataset. 2019.
[22] P. Wang, X. Huang, X. Cheng, D. Zhou, Q. Geng, and R.
     Yang. The apolloscape open dataset for autonomous driving
     and its application. Transactions on Pattern Analysis and
     Machine Intelligence (TPAMI), 2019.
[23] W. Zeng, W. Luo, S. Suo, A. Sadat, B. Yang, S. Casas, and R.
     Urtasun. End-to-end interpretable neural motion planner. Int.
     Conf. on Computer Vision and Pattern Recognition (CVPR),
     2019.
[24] Y. Zhou and O. Tuzel. Voxelnet: End-to-end learning for
     point cloud based 3d object detection. Int. Conf. on Com-
     puter Vision and Pattern Recognition (CVPR), 2018.

                                                                     8
You can also read