Optically stimulated luminescence in state of the art LYSO:Ce scintillators enables high spatial resolution 3D dose imaging
←
→
Page content transcription
If your browser does not render page correctly, please read the page content below
www.nature.com/scientificreports
OPEN Optically stimulated luminescence
in state‑of‑the‑art LYSO:Ce
scintillators enables high spatial
resolution 3D dose imaging
Mads L. Jensen1,4*, Jacob S. Nyemann1, Ludvig P. Muren2,3, Brian Julsgaard1,
Peter Balling1 & Rosana M. Turtos1,4
In this contribution, we study the optically stimulated luminescence (OSL) exhibited by commercial
Lu(2−x) Yx SiO5:Ce crystals. This photon emission mechanism, complementary to scintillation, can
trap a fraction of radiation energy deposited in the material and provides sufficient signal to develop
a novel post-irradiation 3D dose readout. We characterize the OSL emission through spectrally and
temporally resolved measurements and monitor the dose linearity response over a broad range. The
measurements show that the Ce3+ centers responsible for scintillation also function as recombination
centers for the OSL mechanism. The capture to OSL-active traps competes with scintillation
originating from the direct non-radiative energy transfer to the luminescent centers. An OSL response
on the order of 100 ph/MeV is estimated. We demonstrate the imaging capabilities provided by such
an OSL photon yield using a proof-of-concept optical readout method. A 0.1 mm3 spatial resolution
for doses as low as 0.5 Gy is projected using a cubic crystal to image volumetric dose profiles. While
OSL degrades the intrinsic scintillating performance by reducing the number of scintillation photons
emitted following the passage of ionizing radiation, it can encode highly resolved spatial information
of the interaction point of the particle. This feature combines ionizing radiation spectroscopy and 3D
reusable dose imaging in a single material.
Scintillation is found in a wide variety of both organic and inorganic materials and is defined as the efficient
conversion of incident ionizing particles into an optical response of fast rise and/or decay times. This ability
has made scintillators the cornerstone of room temperature ionizing radiation spectroscopy and imaging. A
high-performing family of scintillators is the cerium-doped lutetium orthosilicate Lu(2−x) Yx SiO5:Ce (LYSO:Ce)
crystals developed in the ’90s, which have an exceptional high photon-emission rate. This material has enabled
the development of the current generation of time-of-flight positron emission tomography (TOF-PET) clinical
scanners and is of high interest for e.g. reconstruction-free TOF-PET imaging and online monitoring of adaptive
proton therapy1,2 enabled by its high photon-emission rate.
Figure 1a illustrates the scintillation process within the band gap of such LYSO:Ce crystals. Upon interaction
with ionizing radiation, electrons are excited across the band gap, where they generate secondary electrons and
holes that thermalize to the lowest available energy in their respective bands. Energy from the thermalized charge
carriers is transferred to the Ce3+ centers energetically located within the 6.8–7.4 eV band-gap3 of the insulating
inorganic matrix. This capture has a characteristic time ranging from 50 to 200 ps under X-ray or gamma excita-
tion and explains the rise time of the scintillation signal which has been reported as non-mono-exponential4. The
Ce3+ centers function as recombination centers through a 5d-4f optical transition characterized by a decay time
of ∼ 40 ns, and are responsible for the scintillation in this material, producing around 40,000 optical photons
per deposited M eV5. As illustrated in Fig. 1a, capture to another more long-lived trap state also occurs, allowing
for storage of a fraction of the excited electrons.
Electrons captured and trapped in this metastable trap state can be excited post-irradiation using low-energy
optical stimulation allowing for radiative recombination through the Ce3+ centers as illustrated in Fig. 1b. Such
1
Department of Physics and Astronomy, Aarhus University, Ny Munkegade 120, 8000 Aarhus,
Denmark. 2Danish Centre for Particle Therapy, Aarhus University Hospital, Palle Juul‑Jensens Boulevard 99,
8200 Aarhus, Denmark. 3Department of Clinical Medicine, Aarhus University, Palle Juul‑Jensens Boulevard 82,
8200 Aarhus N, Denmark. 4These authors contributed equally: Mads L. Jensen and Rosana M. Turtos. *email:
mlj@phys.au.dk
Scientific Reports | (2022) 12:8301 | https://doi.org/10.1038/s41598-022-12255-9 1
Vol.:(0123456789)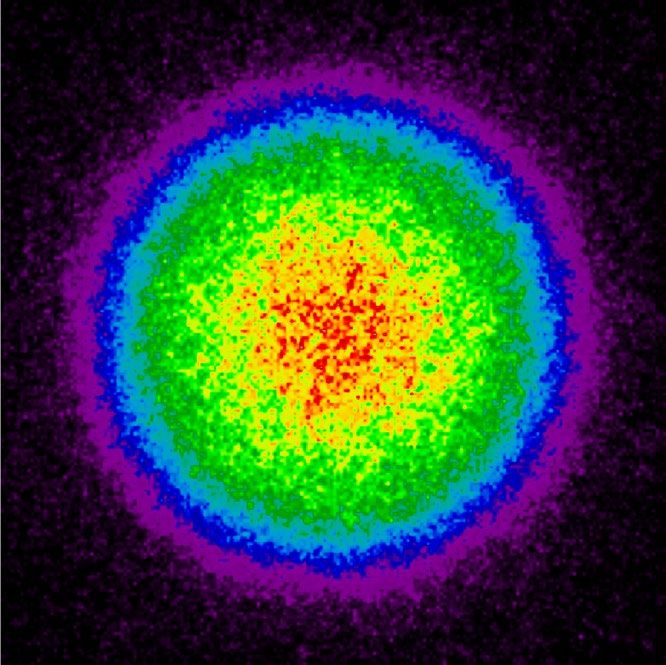
www.nature.com/scientificreports/
Figure 1. Band gap diagram for LYSO:Ce. (a) illustrates the scintillation process: Ionizing radiation generates
electrons and holes, which are subsequently trapped by Ce3+ centers with a life time of ∼ 40 ns and give rise to
prompt light emission. A fraction of electrons are stored in auxiliary OSL traps, which are readout on request
[see panel (b)] through the same Ce3+ centers using optical stimulation. Solid lines illustrate excitations, dashed
lines illustrate capture processes, dash-dotted lines illustrate radiative decays and wavy lines illustrate optical
photons.
optically stimulated luminescence (OSL) provides a method to interrogate the OSL-traps and assess the number
of trapped electrons, as this correlates directly with the number of emitted OSL-photons6. Notably, the energy of
the emitted OSL-photons can be higher than that of the stimulating photons without violating energy conserva-
tion, which enables efficient filtering of any long-wavelength photoluminescence. Previous s tudies7–9 of lutetium
orthosilicate (LYSO) compounds using films, powders, and structurally defective cerium doped single crystals
have reported OSL properties in these compounds. These studies agree on the stability and dose-linearity of
OSL in the investigated LYSO compounds and the relevance of this energy-storage mechanism in radiation
dosimetry. Oxygen vacancies have previously been identified as electron traps in cerium-doped LYSO crystals
and proposed as a candidate for these OSL-traps9,10. However, the study and application of OSL in commercial
LYSO:Ce samples used for current TOF-PET imaging remains to be explored.
The spatial distribution of the energy deposited in the scintillator is reflected by the OSL-photons, which
can be extracted using appropriate optical excitation and an imaging setup. As previously suggested11–14, this
makes OSL an excellent photon emission candidate to develop a passive and reusable novel 3D dosimeter.
Three-dimensional dosimetry is continuously being developed as an appropriate tool for validation and quan-
tification of complex treatment plans in modern radiotherapy (RT). Currently, multidimensional dosimetry is
either performed during irradiation with the use of several charge-coupled device (CCD) cameras and plastic/
liquid scintillators15–17 or using a combination of water-phantoms and multiple detectors18, making real-time
dose monitoring instrumentally heavy. Post-irradiation readout, or passive dosimetry, is led by gel or bulk
radiochromic materials, where dose-correlated information is read out with an optical computed tomography
scanner19. Recent applications have demonstrated dosimetry inside the magnetic field present in novel MR-
guided radiotherapy20, while the high spatial resolution of radiochromic dosimeters has allowed imaging of, e.g.,
the localized dose (Bragg peak) in proton therapy21, and the demonstration of the possibility to use a flexible
host matrix was used to investigate the effects of deformation during proton therapy22. Nonetheless, the existing
3D dosimeters are based on materials with an irreversible chemically induced response to ionizing radiation, a
response which has been shown to exhibit time- and temperature v ariations23, and they are by design one-time
use dosimeters, which typically require batch-specific calibration. Hence, a reusable OSL-based post-irradiation
dosimeter, given a precise readout method, could tackle the challenges associated with digital multidimensional
dosimetry for quality assurance in RT.
The study and application of OSL in state-of-the-art commercial LYSO:Ce scintillators presented in this
contribution is divided into two parts. First, we estimate the order of OSL photons emitted per energy deposited,
i.e. OSL yield, in one of the fastest and brightest scintillators in use nowadays for TOF-PET imaging24. To our
knowledge, this is the first time any study reports on the energy conversion efficiency of the OSL mechanism in
these crystals. Second, we demonstrate a proof-of-concept 3D readout system capable of retrieving the stored
dose information from the OSL traps along with an estimation of the obtainable signal-to-noise ratio (SNR)
based on the OSL yield of LYSO:Ce and the properties of the detection system.
Results
Characterization of the OSL. The OSL mechanism was investigated by irradiating an LYSO:Ce crystal
with a 90Sr/90Y-source, and stimulating the OSL post-irradiation using continuous-wave (CW) laser excitation
with energies of 1.87, 2.33, and 2.70 eV, i.e. red, green, and blue laser diodes, respectively. The emitted light was
imaged onto a spectrograph equipped with a low-noise CCD camera to allow for measurement of spectrally
resolved OSL. The same spectrograph was used to assess the spectrally resolved scintillation emission via a
fiber-coupled connection to the crystal during irradiation. As demonstrated in Fig. 2a, the scintillation and OSL
Scientific Reports | (2022) 12:8301 | https://doi.org/10.1038/s41598-022-12255-9 2
Vol:.(1234567890)
www.nature.com/scientificreports/
Figure 2. Optically stimulated luminescence mechanism in LYSO:Ce single crystals. (a) Spectrally resolved
OSL excited with blue, green and red continuous-wave (CW) lasers in comparison to the LYSO:Ce scintillation
spectrum. The sharp cut-offs observed for the blue and green stimulation are due to necessary filtering of
laser light. (b) Decay curve from pulsed OSL (blue) fitted to a mono-exponential decay (red) with decay
time (44.2 ± 0.2) ns. The black curve shows the instrument response function (FWHM 6 ns). (c) CW-laser
stimulated OSL decay curves obtained similar excitation powers with energies of 1.87, 2.33, and 2.70 eV, i.e red,
green, and blue, respectively.
show great similarity, as we observe all spectra to have the same rising edge and shape, characteristic of the Ce3+
absorption edge and emission bands, respectively. Furthermore, we are also able to resolve the 5d–4f5/2 and
5d–4f7/2 transition of the cerium one center25 with emission wavelengths at 390 nm and 425 nm, respectively
(marked by the blue and green arrow in the Fig. 2a).
We examined the kinetics of the OSL mechanism by pulsed stimulation using a femtosecond laser with
460 nm wavelength and employing a time-correlated single-photon counting readout. The results are shown
in Fig. 2b, where a mono-exponential decay time of 44 ns characteristic of the Ce3+ emission centers can be
observed. For these measurements, we monitored the background by exciting the LYSO:Ce cube with the femto-
second laser while the OSL traps are empty, which confirms that the data presented is not due to the scintillation
emission nor population of OSL traps from the intrinsic 176Lu radioactivity. The instrumental response function
of the setup was obtained by directly measuring the laser light reflected at the face of the LYSO:Ce crystal.
The above findings support the model (Fig. 1), showing the OSL mechanism to have identical spectral char-
acteristics and kinetics as the well-characterized Ce3+ center responsible for scintillation.
The relative photoionization cross section of the OSL process for each of the three stimulating laser wave-
lengths was investigated using a photo-multiplier tube (PMT) in photon counting mode and appropriate filtering
to isolate the OSL photons. Figure 2c displays the normalized CW OSL signal measured from an LYSO:Ce crystal
irradiated 1 min under the 90Sr/90Y-source and read out with the three stimulating laser wavelengths, all with
similar spatial profiles and powers. These measurements indicate an increasing cross section for excitation with
increasing photon energy, as the readout of the crystal reaches background levels significantly faster at higher
energies. Hence, a blue laser will yield the fastest readout of occupied OSL traps.
We estimate the OSL yield by defining LYOSL = Nemit /Edep, where Nemit is the total number of emitted OSL
photons after deposition of energy Edep. Geant4 simulations26 were used to estimate the energy deposition rate
in the crystal to 1.06 × 10⁹ MeV/min during irradiation with the 90Sr/90Y-source. The total number of emitted
OSL photons is assessed by integrating the generated photoelectrons in the PMT over time, upon stimulation
of the LYSO:Ce crystal with the blue 460 nm CW laser until a background level is reached. The total number
of emitted photons is calculated as Nemit = Npe /PDE, where Npe is the number of detected photoelectrons and
PDE = QE · OCE · LTE is the photon detection efficiency. Here, QE is the PMT quantum efficiency, which
averages to around 25% for the wavelength range measured, and LTE describes the light transfer efficiency of
the LYSO:Ce crystal, usually around 10% when the crystal readout face is air-coupled to the PMT, as previ-
ously reported5. This factor describes the fraction of the generated photons that escape through the readout
face of the crystal, taking into account both internal reflection, absorption, and refraction at the interface.
The OCE describes the optical coupling efficiency of the setup, which is affected by the lens, filters, and the
distance between the PMT and the sample. This last factor has been measured using a methodology described
in the “Methods” section and reaches values of around 1%. With all these factors taken into account and with a
measured Npe = 30 million when irradiating the LYSO:Ce for one minute with a 90Sr/90Y-source, we arrive at
a final estimate of around 100 OSL photons/MeV with wavelengths between 330 and 420 nm corresponding to
the used filter window. This result points towards a small branching ratio between capture to the OSL traps and
capture to the Ce3+ centers.
Scientific Reports | (2022) 12:8301 | https://doi.org/10.1038/s41598-022-12255-9 3
Vol.:(0123456789)
www.nature.com/scientificreports/
Figure 3. LYSO:Ce dose linearity response to 90Sr/90Y electron excitation. OSL-response per dose at varying
irradiation times plotted relative to the 1 min irradiation. The dose values shown in the top X-axis were
estimated using Geant4-based Monte Carlo simulations, representing the average value within the outermost
10 × 10 × 1 mm3 layer facing the radiation source.
The dose-response of LYSO:Ce was investigated by irradiating a 1 cm3 LYSO:Ce cube under the 90Sr/90
Y-source with a constant dose rate at varying irradiation times, followed by readout using a CW laser and a PMT
in photon counting mode with appropriate filters. The results are presented in Fig. 3, showing an apparent sub-
linearity at doses above 2.4 Gy, which might be due to fading of the OSL signal. The dose values presented on
the upper axes in this figure were estimated using Geant4-based Monte Carlo simulations to estimate the energy
deposition rate, which, when scaled with the mass of the scintillator, yields the dose rate of 0.24 Gy/min. Only the
mass of the first mm of the crystal was used, as the vast majority of the dose is deposited here (see simulation in
Fig. 4e). The CSDA range of 1 MeV electrons, representing the expected energy of an electron emitted from the
used source, in LYSO are stated to be < 1 mm in the NIST d atabase27, which is in agreement with the presented
simulations and further supports the approach used for estimating the dose.
Spatially resolved 3D readout of dose using OSL. Exploiting the OSL mechanism in LYSO:Ce for
post-irradiation investigation of dose deposition in 3D requires not only stimulation and detection of the num-
ber of OSL photons emitted from the crystal, but detection of where in the crystal the OSL photons were emitted.
To extract this information, a novel optical readout system has been designed and constructed, capable of read-
ing out OSL signal from OSL-based dosimeters in a layer-wise manner by stimulating OSL with a light sheet, and
imaging the OSL onto a CCD camera, using appropriate filtering with an optical window between 330 and 420
nm. This allows for assessment of the number of photons emitted from a voxel volume V defined by the thickness
of the light sheet, the system magnification, and the number of binned CCD pixels. With the interest of minimiz-
ing the readout time, a wavelength of 445 nm was chosen for the stimulating light sheet. Further description of
this setup and the readout concept can be found in the “Methods” section.
Measuring the number of detected photoelectrons Npe generated in each pixel allows for an assessment of
the number of emitted OSL photons using the system PDE. Moreover, the number of emitted photons in a given
voxel volume V is dependent on the deposited dose D and the OSL light yield as described in the previous sec-
tion. Hence, the number of photoelectrons are expected to be directly proportional to both the deposited dose
and the voxel volume, scaling as Npe = (QE · LTE · OCE · LYOSL · ρ) · D · V , where ρ is the sample mass density
and QE and OCE are now specific for the 3D optical readout system.
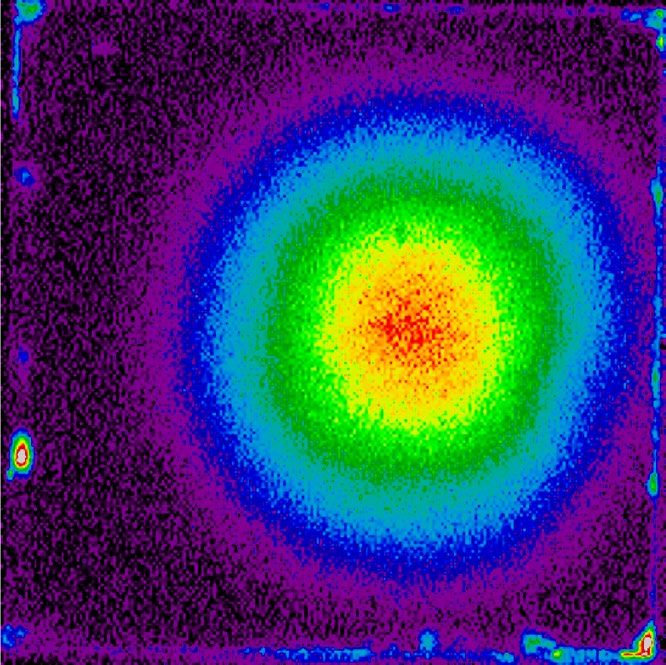
Figure 4 shows a readout of the 1 cm3 LYSO:Ce crystal irradiated for 10 min under the 90Sr/90Y-source. The
crystal was placed with the irradiated side facing away from the camera and three 1 mm wide layers were read
out from the back (furthest away from the camera) to the front (closest to the camera). That is, sheet center-
positions 9.5, 8.5, and 7.5 mm from the front of the sample in the given order, which from this point are referred
to as layers 10, 9, and 8, respectively. Figure 4a shows the readout of layer 10 and Fig. 4b displays the result of
a Geant4-simulation26, tracking energy deposition in the crystal step-wise during 10 ms of irradiation using
the same voxel-sizes as in Fig. 4a. The dose has been calculated by scaling the simulation with the irradiation
time and dividing by the mass of the voxel volume. Figure 4c–e display the projections of both simulation and
measurement onto each axis. Using the distributions in the x-direction and the y-direction as probability mass
functions, the centers, and spreads of the distributions were calculated, and the simulation has been translated
so the centers of the two overlap. The spreads are indicated on the figures, showing a discrepancy between
simulation and measurement below 10% in both directions. Note that the outermost 1 mm has been excluded
in these estimations, as defects in the crystal edges scatter the stimulating light resulting in an increased signal
from these volumes (see Fig. 4a along the outer perimeter). This scattering of stimulating light is possibly also
Scientific Reports | (2022) 12:8301 | https://doi.org/10.1038/s41598-022-12255-9 4
Vol:.(1234567890)www.nature.com/scientificreports/
Figure 4. Spatially resolved post-irradiation OSL readout from a 90Sr/90Y-irradiated LYSO:Ce crystal. The
crystal was irradiated by a 90Sr/90Y-source for 10 min. (a) Readout of the first mm of the crystal, as seen from
the source. The voxel size is 0.046 × 0.046 × 1.00 mm3. For display purposes, the color map is adjusted to
saturate (gray) at very high count numbers and negative values are interpreted as background fluctuations and
displayed as zero counts. (b) xy-projection of the Geant4-simulation. The dose is calculated using a voxel size
identical to the one in (a) as the majority of energy is deposited within the first mm [see sub-figure (e)]. (c–e)
1D projections of the data shown in (a) and (b). In (c) and (d) the simulation has been translated so the center
values of the distributions overlap. The spread of both simulation and measurement are marked with dashed
lines. The center value and spread of the data were calculated excluding the outermost 1 mm in both sides
(marked with a lighter blue) due to the proximity to the crystal edges.
the reason for the discrepancy between the simulation and measurements in Fig. 4e, as the scattered stimulating
light continues readout of the occupied OSL-traps in the non-bleached layer 10 during the readout of both layers
9 and 8. The measurement presented in Fig. 4 constitute one of five repetitions of measurements made to assess
any systematic errors. The voxel-wise error of the mean between these measurements was found to be below
10%, and is attributed to variations in alignments during irradiation and readout.
Measuring with a state-of-the-art CCD camera that is shot-noise-limited
√ above 100 detected photoelectrons
allows for assessment of the signal-to-noise ratio as SNR = Npe = N · CG , where N is the number of counts
and CG is the CCD conversion gain describing the number of photoelectrons
√ per count. From the measurements
in Fig. 4a acquired with CG = 1.26, we thus report an SNR of 800 · 1.26 ∼ 31 at estimated doses of ∼ 10 Gy in
voxel-volumes of 0.046 × 0.046 × 1.00 mm3. These results additionally enable us to express the expected number
of detected photoelectrons as Npe ≈ 4.8 × 10⁴ · D/Gy · V /mm3. In some cases an SNR of 31 may be insufficient,
and hardware binning M × M pixel of the CCD before analog-to-digital conversion can effectively increase the
voxel volume by a factor of M 2 and thus increase the SNR by a factor M. Figure 5 shows the results of an experi-
ment similar to that shown in Fig. 4. In this case, the CCD was configured to bin 8 by 8 pixels before analog-to-
digital conversion with CG = 1.19 and the sample was irradiated only 1 min. As√ expected, the spatial resolution
is significantly lower in Fig. 5, however, we observe an increase in the SNR to 6000 · 1.19 ∼ 84 at estimated
doses of only 1 Gy in voxel-volumes of 0.37 × 0.37 × 1.00 mm3. A slight discrepancy is observed between these
two measurements, as the binned readout yields an 8% higher scaling factor of Npe ≈ 5.2 × 10⁴ · D/Gy · V /mm3.
To illustrate the readout of irradiation deeper in the bulk of the LYSO:Ce cube, the 1 cm3 LYSO:Ce crystal
was irradiated with a Ø 10 mm collimated beam of 511 keV gamma photons from a 22Na-source. Figure 6
displays the background-subtracted results of the readout from the central seven 1-mm thick layers after this
irradiation. The inset shows the 2D projection of the 3D data, illustrating the sum of all seven layers which, when
Scientific Reports | (2022) 12:8301 | https://doi.org/10.1038/s41598-022-12255-9 5
Vol.:(0123456789)www.nature.com/scientificreports/
Figure 5. Spatially resolved 8-by-8-binned post-irradiation OSL readout from a 90Sr/90Y-irradiated LYSO:Ce
crystal. The crystal was irradiated by a 90Sr/90Y-source for 1 min. (a) Readout of the first mm of the crystal, as
seen from the source. The voxel size is 0.37 × 0.37 × 1.00 mm3. For display purposes, the color map is adjusted to
saturate (gray) at very high count numbers and negative values are interpreted as background fluctuations and
displayed as zero counts. (b) xy-projection of the Geant4-simulation. The dose is calculated using a voxel size
identical to the one in (a) as the majority of energy is deposited within the first mm [see sub-figure (e)]. (c–e)
1D projections of the data shown in (a) and (b). In (c) and (d) the simulation have been translated so the center
values of the distributions overlap. The spread of both simulation and measurement are marked with dashed
lines.
Figure 6. Projections of a post-irradiation 3D-readout from a 22Na-irradiated LYSO:Ce crystal. A y-projection
of the 3D-readout from the central seven 1 mm wide layers of the 1 cm3 LYSO:Ce crystal. The crystal was
irradiated with a collimated Ø 10 mm 511 keV beam from a 22Na-source. A mono-exponential fit yielding an
attenuation length of is 10.6 ± 0.3 mm and corresponding uncertainties are displayed in red, where the first
data point (bar without hatching) is excluded from the fitting due to the proximity to the crystal edge. The inset
displays the xy-projection of the data with the arrow indicating the direction of the irradiation. Negative values
are interpreted as background fluctuations and displayed as zero counts. The voxel-sizes are 0.37 × 0.37 × 7.00
mm3 and 10.00 × 0.37 × 7.00 mm3 for the 2D and 1D projections, respectively.
Scientific Reports | (2022) 12:8301 | https://doi.org/10.1038/s41598-022-12255-9 6
Vol:.(1234567890)www.nature.com/scientificreports/
further projected onto the y-axis, yields the bar-plot. This 1D-projection allows for an estimation of the attenu-
ation length of 10.6 ± 0.3 mm for 511 keV gamma photons in LYSO:Ce, which within two standard deviations
m28,29. As a preliminary result, this serves as a proof-of-concept
is consistent with the literature value of 11.2 m
measurement illustrating the ability of the readout method to spatially resolve energy deposition using OSL. Note
that this estimation was made by excluding the outermost data point due to high scattering at the crystal edge
and a possible contribution from the annihilation of positrons from the source on the crystal surface.
Discussion
The results presented above confirm the viability of using optically stimulated luminescence as the characteristic
emission enabling high spatially resolved 3D dose imaging. We have demonstrated the ability to extract informa-
tion about the spatial distribution of a deposited dose in an LYSO:Ce scintillator with high spatial resolution using
OSL. Furthermore, we have correlated the number of photoelectrons detected when reading out from a voxel
volume V in which a dose D have been deposited: Npe ≈ 5 × 10⁴ · D/Gy · V /mm3. Considering only statistical
errors, the precision of estimated doses can be assessed from this result using the intrinsic noise in the state-of-
the-art CCD camera used for readout, which is assumed to be shot-noise limited for pixel-values higher than
100 detected photoelectrons. The minimum detectable doses at the current stage in voxel volumes of 0.1 mm3
are thus found to be ∼ 0.5 Gy with a 2% precision level and ∼ 0.2 Gy with a 3% precision level.
Further improvement in the readout precision is equivalent to increasing the constant of proportionality in
the above expression given as PDE · LYOSL · ρ . With an estimated OSL yield of 100 photons per deposited MeV
and a scintillator density of 7.1 g/cm3 the PDE of the 3D readout system is estimated to be ∼ 1.1 × 10⁻³%. The
system PDE can further be theoretically estimated as the product between the quantum efficiency of the CCD
(∼ 80%), the light transfer efficiency in the crystal (∼ 10%), and the OCE of the setup. The latter can be estimated
Tm2
as OCE = 4F 2 (1+m) 2 +m2 , where T is the transmission, which for the setup is the combined transmission of the
filters and the objective (∼ 40%), m is the magnification (0.3) and F is the f-number of the l ens30. The currently
used objective has an f-number of F = 4 , which yields an OCE of 3.3 × 10⁻² % and consequently a PDE of
∼ 2.7 × 10⁻³% in reasonable agreement with the measured. As seen from this theoretical evaluation, the setup
can be improved significantly by lowering the f-number and increasing the transmission.
Further improvements of a more technical character will be the center for further development. This includes
minimization of the observed scattering of the laser sheet on damages on the crystal surfaces, which is observed
to cause readout of neighboring layers. Such a minimization would significantly increase the reliability of the
3D spatial information acquired with the setup. Other challenges include characterization of the sheet profile,
complete optical bleaching of the dosimeter between readouts, and consistent placement of the dosimeter in
the readout setup. We stress that such technical challenges do not prohibit an assessment of the SNR provided
by the system in a shot-noise limited case and that solving such problems will reduce systematic errors which in
turn pushes the system towards shot-noise limitation.
Notably, all the data acquired in 3D is presented as either 2D or 1D projections, which arguably lowers the
true dimensionality of the information achieved with the readout system. As evident from the z-projections in
Figs. 4 and 5, 3D information is available in the readouts, but some work is still required to fully validate data
acquisition from internal layers. The presented results nevertheless serve as a proof-of-concept, as the system
can read out low doses with high precision and high spatial resolution over the entire length (z-direction) of the
crystal, e.g. 0.5 Gy with 2% precision in voxel volumes of 0.1 mm3.
In addition to the spatially resolved OSL measurements, we have studied both the spectral characteristics
and kinetics of this photon emission process in LYSO:Ce, confirming the mechanism with the Ce3+ centers
as the luminescent centers. The study has been extended to estimate the OSL yield in terms of the number of
photons emitted per MeV of energy deposited, resulting in an estimate on the order of 100 ph/MeV. As the OSL
mechanism is competitive with the scintillation mechanism, much effort has been put into minimizing these
defects in LYSO:Ce to optimize the material for TOF-PET. The presented yield is promising in this regard, as it
is very low compared to both a theoretically estimated maximum OSL yield of ∼ 18,000 photons/MeV (see the
“Methods” section) and the scintillation yield of 40,000 ph/MeV.
This OSL yield, intrinsic to the material, is linked to the achievable spatial resolution and precision as a func-
tion of deposited dose and serves as a benchmark for future material development, e.g. OSL-active nanocrystals
embedded in a polymer m atrix31. The determination of the OSL yield not only allows framing and concentrating
efforts in the search for water-equivalent OSL dosimeters but enables absolute post-irradiation dose measure-
ments without the need for external verification with validated dosimeters. Having limited the yield to a mini-
mum of 100 OSL-photons per deposited MeV is very promising and motivates further investigations to obtain
a more accurate yield based on an event-by-event readout.
We investigated the dose linearity of the OSL response in LYSO:Ce, which was observed to cover at least two
orders of magnitude for irradiation with a constant and by clinical standards low dose rate of 0.24 Gy/min. As a
consequence of the low dose rate and thus long irradiation time, we note that any thermally induced de-trapping
of electrons in the OSL traps during irradiation could influence the response linearity. Based on the frequency
factors and thermal depth of the traps found in reference 10, we estimate a lifetime of ∼ 200 min at an estimated
laboratory temperature of 19 ◦ C which potentially influences the drop in response seen at long irradiation times
in Fig. 3. Hence, the dose-linearity measurements presented in Fig. 3 does not necessarily exclude dose-linearity
over a wider dose range. Previous studies have demonstrated OSL response to be dose-rate independent in Al2 O3
:C32,33, but any dose-rate dependence in LYSO:Ce is subject to further investigation.
Scientific Reports | (2022) 12:8301 | https://doi.org/10.1038/s41598-022-12255-9 7
Vol.:(0123456789)www.nature.com/scientificreports/
Figure 7. Sketch of the 3D readout-system and proof-of-concept measurement. Note that some of the
components in the sketch have been rotated 90◦ around the beam for illustrative purposes. L1: − 100 mm focal
length spherical plano-concave, L2: 175 mm focal length spherical plano-convex, L3: 1000 mm focal length
cylindrical plano-convex, L4: 500 mm focal length cylindrical plano-convex, L5: 30◦ Powell lens, L6: 200 mm
focal length cylindrical plano-convex. The proof-of-concept measurement was obtain by reading out a 1 cm3
LYSO:Ce crystal irradiated under a 90Sr/90Y-source.
Conclusion
We have characterized the OSL mechanism exhibited in state-of-the-art scintillator LYSO:Ce crystals in terms
of spectral emission, decay kinetics, dose-linearity response, and OSL yield. Moreover, we have demonstrated
the ability to image volumetric dose distributions from two different radioactive sources using the OSL photon-
emission mechanism. The novel readout system enables readout of doses as low as ∼ 0.5 Gy in voxel volumes of
0.1 mm3 with a precision of 2%, making OSL a photon-emission mechanism highly relevant for 3D dose imaging.
The results presented in this contribution constitute the first steps towards the validation of an OSL-based dose
imaging setup in three dimensions.
Methods
All measurements were carried out using single-crystal LYSO:Ce cubes measuring 1 cm3 from Crystal Photonics
Inc. Irradiation of this crystal was performed using either electron excitation or gamma photon and positron
excitation. During and after irradiations, the crystal was kept in a dark environment, as not to empty the occu-
pied OSL-traps. All measurements of the crystal were performed less than 10 min after irradiation to minimize
any fading effects.
Electron excitation was performed using a custom made irradiation container in which samples could be
position beneath a cylindrical 90Sr/90Y-source (74 MBq in 2019) with radius 1.5 mm. The surface-to-surface
distance between the crystal and source was ∼ 3.5 mm during irradiations, yielding an estimated dose rate of
0.24 Gy/min to the first mm of the crystal. The medium separating the crystal and source was air.
Gamma photon and positron excitation was performed by placing the crystal on top of a steel-container
holding a 22Na-source (1.85 GBq in 2011). The source was fixated within the container with direct access to the
sample through a 10 cm deep cylindrical hole of 0.5 cm radius. Irradiation was performed by positioning the
crystal over this hole.
3D optical readout. The optical readout from the crystal was done using a SOPHIA-2048BR CCD camera
(13.5 × 13.5 µm2 pixels) in combination with a ≤ 1 mm thick light sheet generated from the output of a laser of
wavelength 445 nm. By using the laser to stimulate a specific layer of the crystal, a 2D image of that given layer
was acquired with the CCD camera. Moving the sheet along the crystal provided the third dimension, and a 3D
measurement was obtained by stacking the acquired 2D measurements.
All measurements reported in this contribution were acquired using the low noise quality setting of the
camera with a high gain and a readout rate of 4 MHz. The conversion gain for these settings is specified by the
manufacturer to be CG = 1.26 for a non-binned sensor. The conversion gain for the 8-by-8-binned sensor was
assessed by measuring the change in conversion gain when binning the sensor and scaling the manufacturer’s
conversion gain accordingly.
Figure 7 shows a sketch of the design of the setup. Starting from the light source, the laser beam is attenuated
using a half-wave plate and a Glan-laser polarizer allowing for continuous adjustment of the intensity of the sheet
without changing the laser-beam profile. The beam then passes through a shutter, that operates synchronously
with the camera shutter, ensuring maximum detection of photons emitted via OSL. Next, the laser beam is mag-
nified using a Galilean telescope before it is focused with a cylindrical plano-convex lens creating an elongated
Scientific Reports | (2022) 12:8301 | https://doi.org/10.1038/s41598-022-12255-9 8
Vol:.(1234567890)www.nature.com/scientificreports/
horizontal focus at the sample site. The beam additionally passes through another cylindrical plano-convex
lens to adjust the vertical divergence before it reaches the Powell lens. This lens is responsible for creating an
intensity-homogeneous 30◦ fan, which is then collimated by a cylindrical plano-convex lens, yielding a ≤ 1 mm
wide ∼ 10 cm high light sheet. Finally, the sheet is guided to the sample using two translation stages that move
in a coordinated manner to ensure that the stimulated layer remains in focus as the object plane for the camera.
Imaging the crystal layers onto the CCD was done using a Jenoptik APO macro UV-objective with appropriate
filters (Edmund Optics 46-434, 84-716, and 84-720) resulting in a spectral window between 330 and 420 nm,
isolating the OSL-signal from the stimulating light.
An illustrative layer-wise presentation of a proof-of-concept readout using the described setup is also shown
in Fig. 7. Here, the 1 cm3 LYSO:Ce crystal was irradiated under the 90Sr/90Y-source with the xz-plane facing the
source and electrons penetrating the crystal in the positive y-direction. The crystal was then read out in the
system with the irradiated side facing upwards, with the light sheet moving in the negative z-direction of the
crystal, spanning the xy-plane. The result shown in the figure represents the average of 10 repeated measure-
ments. Compared with the readouts presented in Figs. 4 and 5, the dose distribution is now visible along the
z-axis, which is the dimension provided by the moving light sheet.
OSL photon counting readout. The OSL-based dose-response was studied using a PMT from ET Enter-
prises operated in photon counting mode. The experimental setup consisted of the PMT with a photocathode
diameter of 25 mm, optically coupled to the sample site using a lens with a focal length of 35 mm. Appropriate
filters (Thorlabs FGB37-A and Edmund Optics 84-703, 84-707, 84-717, and 15-256) providing an optical win-
dow between 330 and 420 nm were used to block the laser, which illuminated the sample at a grazing angle. A
multi-channel analyzer was used to count all transistor-transistor-logic (TTL) pulses from the PMT. To avoid
saturation of the PMT, neutral density filters were added to the filter set for high-dose measurements. For the 100
and 180 min irradiations, a filter with 13.3% transmission was added, and for the 1000 min irradiation, a filter
with 2% transmission was added. The dark-count rate of the PMT was around 10 counts per second, yielding
measurements with a large signal-to-noise ratio, where the maximum count rate was limited by the 25 ns dead-
time interval between consecutive TTL pulses.
Spectrally resolved data was monitored using stimulation by three different laser diodes with wavelengths at
460 nm, 532 nm, and 664 nm, while emission was readout by a Princeton Instruments Acton SP2300 spectrom-
eter coupled to a Pixis camera, cooled to − 75 ◦ C. The spectrometer was equipped with several filters, varying for
the different stimulating wavelengths, to isolate the OSL-photons. The temporally resolved OSL data was acquired
with a Ti:Sapphire 800 nm Solstice ACE femtosecond laser from SpectraPhysics, fed into a TOPAS/nirUVis opti-
cal parametric amplifier operated at a wavelength of 460 nm, which excites the OSL emission. The readout used
the same ET Enterprise PMT and a FastComTech P7888 multiscaler with time-bins of 1 ns to measure photons
in time-correlated single-photon-counting (TCSPC) mode. The femtosecond laser clock running at a repetition
rate of 5kHz was used to trigger the TCSPC start signal, which yielded an overall instrumental response function
of 6 ns FWHM. For all these studies, the LYSO:Ce crystal readout face coincided with the layer where a dose has
been deposited, which differs from the geometry of the 3D readout experiments.
OSL yield estimations. We can estimate the maximum number of electron-hole pairs available for radia-
E
tive recombination in LYSO:Ce by following the relation Ne−h = βEdep , where Edep is 1 MeV of energy deposited
bg
in the material, βEbg is the minimum energy necessary to create an electron-hole pair, and thus a photon. Con-
sidering β = 2.334, the maximum scintillating light yield of LYSO:Ce would range around 58,000 photons per
MeV if all created electron-hole pairs will recombine radiatively. This assumes that the energy transfer efficiency
to the luminescent centers, S and their quantum efficiency QE equals unity. However, until now intrinsic light
yields of LYSO:Ce scintillators superior to 40,000 ph/MeV have not been r eported5. This sets an upper limit on
the number of OSL photons that could be harvested in LYSO:Ce to be around 18,000 ph/MeV, which is the dif-
ference between maximum photon conversion efficiency and the intrinsic scintillation yield assuming 1 − S to
be the efficiency of energy transfer to the OSL traps.
The OCE of the experimental setup, i.e. the fraction between the total number of photons at the sample posi-
tion over the total number of photons arriving at the PMT photocathode, was measured by monitoring the after-
glow of Al2 O3 single crystals, a dosimeter with a radioluminescence spectrum in the visible region. We compared
the number of counts when measuring in direct contact with the window in front of the PMT photocathode and
when replacing the LYSO:Ce crystal in the OSL readout setup. This method allowed for estimation of the OCE
of our setup in relation to a known and studied air-coupled configuration with reported light-transfer efficiency
values5. The choice for this method was made to avoid any counting saturation arising from TTL pulses arriving
too closely in time, i.e. the probability of having only one photon arriving at the PMT photocathode within the
25 ns dead time of the detector is maximized. For this reason, we chose a slow photon emission process such
as afterglow in Al2 O3 over scintillation due to self-activation in LYSO:Ce to account for the OCE of the setup.
Geant4‑based Monte Carlo simulations. The Geant4 simulations presented in this work were per-
formed using the Geant4.10.07 distribution and the FTPT_BERT physics list. Results using such code have
previously been v alidated5,35 by comparing to experimental data. The scoring volume was defined to be a 10 × 10
× 10 mm3 cube of undoped lutetium orthosilicate, which for simulating purposes replicate LYSO:Ce. The main
parts of the internal geometry of the irradiation setup were included in the simulation to mimic the actual irra-
diation profile. The electrons were generated using the 90Sr/90Y-spectrum from the literature36. The source itself
was a disk of radius 1.5 mm with an isotropic angular profile located 3.5 mm from the surface of the scoring vol-
Scientific Reports | (2022) 12:8301 | https://doi.org/10.1038/s41598-022-12255-9 9
Vol.:(0123456789)www.nature.com/scientificreports/
ume. The step-wise energy deposition and post-step coordinates of each particle depositing energy in the scor-
ing volume were saved and the 3D energy deposition matrix was generated through post-processing in Python.
Data availability
The datasets generated and/or analysed during the current study are available in the Mendeley Data repository.
DOI: 10.17632/gnvxmbwkpd.1.
Received: 21 January 2022; Accepted: 6 May 2022
References
1. Lecoq, P. et al. Roadmap toward the 10 ps time-of-flight PET challenge. Phys. Med. Biol. 65, 21RM01. https://doi.org/10.1088/
1361-6560/ab9500 (2020).
2. Ferrero, V. et al. Online proton therapy monitoring: clinical test of a silicon-photodetector-based in-beam pet. Sci. Rep. 8, 4100.
https://doi.org/10.1038/s41598-018-22325-6 (2018).
3. Wojtowicz, A. J. et al. Scintillation properties of selected oxide monocrystals activated with CE and PR. Opt. Mater. 28, 85–93.
https://doi.org/10.1016/j.optmat.2004.09.029 (2006) (Polish–French–Israeli Symposium on Spectroscopy of Modern Materials
in Physics).
4. Gundacker, S., Turtos, R., Auffray, E. & Lecoq, P. Precise rise and decay time measurements of inorganic scintillators by means of
X-ray and 511 kev excitation. Nucl. Instrum. Methods Phys. Res. Sect. A 891, 42–52. https://doi.org/10.1016/j.nima.2018.02.074
(2018).
5. Martinez Turtos, R. et al. Measurement of LYSO intrinsic light yield using electron excitation. IEEE Trans. Nucl. Sci. 63, 475–479.
https://doi.org/10.1109/TNS.2016.2527738 (2016).
6. Yukihara, E. G. & McKeever, S. W. S. Optically Stimulated Luminescence: Fundamentals and Applications (2011).
7. Gartia, R. K., Singh, T. T. & Singh, T. B. Optically stimulated luminescence (OSL) of Lu 2 SiO 5 :Ce powder: A preliminary study.
Nucl. Instrum. Methods Phys. Res. Sect. B 269, 30–33. https://doi.org/10.1016/j.nimb.2010.10.008 (2011).
8. Twardak, A., Bilski, P., Zorenko, Y., Gorbenko, V. & Sidletskiy, O. OSL dosimetric properties of cerium doped lutetium orthosili-
cates. Radiat. Meas. 71, 139–142. https://doi.org/10.1016/j.radmeas.2014.02.018 (2014).
9. Ricci, P. C., Carbonaro, C. M., Chiriu, D. & Anedda, A. Structurally defective cerium doped lutetium-yttrium oxyorthosilicates
for optically stimulated luminescence imaging devices. J. Mater. Chem. 21, 18425–18430. https://doi.org/10.1039/C1JM13456F
(2011).
10. Vedda, A. et al. Thermally stimulated tunneling in rare-earth-doped oxyorthosilicates. Phys. Rev. B 78, 195123. https://doi.org/10.
1103/PhysRevB.78.195123 (2008).
11. Balling, P. et al. Phantom for three-dimensional dosimetry. European Patent Application; EP3264137A1 (2016).
12. Sadel, M. et al. Three-dimensional radiation dosimetry based on optically-stimulated luminescence. J. Phys Conf. Ser. 847, 12044.
https://doi.org/10.1088/1742-6596/847/1/012044 (2017).
13. Nyemann, J. S., Turtos, R. M., Julsgaard, B., Muren, L. P. & Balling, P. Optical characterization of LiF:Mg, Cu, P—Towards 3D
optically stimulated luminescence dosimetry. Radiat. Meas. 138, 106390. https://doi.org/10.1016/j.radmeas.2020.106390 (2020).
14. Sa̧del, M., et al. 3d dosimetry based on limgpo4 osl silicone foils: Facilitating the verification of eye-ball cancer proton radiotherapy.
Sensors. https://doi.org/10.3390/s21186015 (2021).
15. Alsanea, F., Darne, C., Hojo, Y. & Beddar, S. A novel imaging scheme for optical cameras used in a quality assurance detector for
discrete spot scanning proton beam systems. Nucl. Instrum. Methods Phys. Res. Sect. A 939, 16–21. https://doi.org/10.1016/j.nima.
2019.05.038 (2019).
16. Darne, C. D. et al. A proton imaging system using a volumetric liquid scintillator: A preliminary study. Biomed. Phys. Eng. Express
5, 045032. https://doi.org/10.1088/2057-1976/ab2e4a (2019).
17. Darne, C. D., Alsanea, F., Robertson, D. G., Sahoo, N. & Beddar, S. Performance characterization of a 3D liquid scintillation detector
for discrete spot scanning proton beam systems. Phys. Med. Biol. 62, 5652. https://doi.org/10.1088/1361-6560/AA780B (2017).
18. Bruza, P. et al. Real-time 3d dose imaging in water phantoms: Reconstruction from simultaneous EPID-cherenkov 3d imaging
(EC3d). J. Phys. Conf. Ser. 847, 012034. https://doi.org/10.1088/1742-6596/847/1/012034 (2017).
19. Doran, S. J. The history and principles of chemical dosimetry for 3-D radiation fields: Gels, polymers and plastics. Appl. Radiat.
Isot. 67, 393–398. https://doi.org/10.1016/j.apradiso.2008.06.026 (2009).
20. Jensen, M. B. et al. Dose response of three-dimensional silicone-based radiochromic dosimeters for photon irradiation in the
presence of a magnetic field. Phys. Imaging Radiat. Oncol. 16, 81–84. https://doi.org/10.1016/J.PHRO.2020.10.003 (2020).
21. Valdetaro, L. B. et al. Empirical quenching correction in radiochromic silicone-based three-dimensional dosimetry of spot-scanning
proton therapy. Phys. Imaging Radiat. Oncol. 18, 11–18. https://doi.org/10.1016/J.PHRO.2021.03.006 (2021).
22. Jensen, S. V. et al. Dose-response of deformable radiochromic dosimeters for spot scanning proton therapy. Phys. Imaging Radiat.
Oncol. 16, 134–137. https://doi.org/10.1016/j.phro.2020.11.004 (2020).
23. Jensen, M. B. et al. Impact of curing conditions on basic dosimetric properties of silicone-based radiochromic dosimeters for
photon and proton irradiation. Acta Oncol. 61, 264–268. https://doi.org/10.1080/0284186X.2021.2022203 (2022).
24. Gundacker, S. et al. Experimental time resolution limits of modern SiPMs and TOF-PET detectors exploring different scintillators
and cherenkov emission. Phys. Med. Biol. 65, 025001. https://doi.org/10.1088/1361-6560/ab63b4 (2020).
25. Martins, A. et al. Spectroscopic analysis of lyso:ce crystals. Spectrochim. Acta Part A Mol. Biomol. Spectrosc. 172, 163–167. https://
doi.org/10.1016/j.saa.2016.04.019 (2017).
26. Agostinelli, S. et al. Geant4-a simulation toolkit. Nucl. Instrum. Methods Phys. Res. Sect. A 506, 250–303. https://doi.org/10.1016/
S0168-9002(03)01368-8 (2003).
27. Berger, M., Coursey, J. & Zucker, M. Estar, pstar, and astar: Computer programs for calculating stopping-power and range tables
for electrons, protons, and helium ions (version 1.21) (1999).
28. Doroud, K., Williams, M., Zichichi, A. & Zuyeuski, R. Comparative timing measurements of lyso and lfs-3 to achieve the best time
resolution for tof-pet. Nucl. Instrum. Methods Phys. Res. Sect. A 793, 57–61. https://doi.org/10.1016/j.nima.2015.04.056 (2015).
29. van Eijk, C. W. E. Inorganic scintillators in medical imaging. Phys. Med. Biol. 47, R85–R106. https://doi.org/10.1088/0031-9155/
47/8/201 (2002).
30. Yu, T. & Boone, J. M. Lens coupling efficiency: Derivation and application under differing geometrical assumptions. Med. Phys.
24, 565–570. https://doi.org/10.1118/1.598055 (1997).
31. Nielsen, C. L. et al. A novel nanocomposite material for optically stimulated luminescence dosimetry. Nano Lett. 22, 1566–1572.
https://doi.org/10.1021/acs.nanolett.1c04384 (2022).
32. Granville, D. A. et al. Al 2 O 3 :C optically stimulated luminescence dosimeters (OSLDs) for ultra-high dose rate proton dosimetry.
Phys. Med. Biol. 66, 85003. https://doi.org/10.1088/1361-6560/abe554 (2021).
Scientific Reports | (2022) 12:8301 | https://doi.org/10.1038/s41598-022-12255-9 10
Vol:.(1234567890)www.nature.com/scientificreports/
33. Christensen, J. B. et al. Al 2 O 3 :C optically stimulated luminescence dosimeters (OSLDs) for ultra-high dose rate proton dosimetry.
Phys. Med. Biol. 66, 85003. https://doi.org/10.1088/1361-6560/abe554 (2021).
34. Lempicki, A., Wojtowicz, A. & Berman, E. Fundamental limits of scintillator performance. Nucl. Instrum. Methods Phys. Res. Sect.
A 333, 304–311. https://doi.org/10.1016/0168-9002(93)91170-R (1993).
35. Turtos, R. M., Gundacker, S., Auffray, E. & Lecoq, P. Towards a metamaterial approach for fast timing in PET: Experimental proof-
of-concept. Phys. Med. Biol. 64, 185018. https://doi.org/10.1088/1361-6560/ab18b3 (2019).
36. Mostafa, L., Rachid, K. & Ahmed, S. M. Comparison between beta radiation dose distribution due to LDR and HDR ocular
brachytherapy applicators using GATE Monte Carlo platform. Phys. Med. 32, 1007–1018. https://doi.org/10.1016/j.ejmp.2016.07.
636 (2016).
Acknowledgements
This research was funded and made possible by Novo Nordisk Fonden. Alexey V. Ishchenko and Ilya A. Wein-
stein are gratefully acknowledged for providing the single-crystal Al2 O3 samples used for estimating the optical
coupling efficiency of the photo-multiplier tube setup.
Author contributions
P.B., L.P.M., and R.M.T. conceived the ideas that motivated this study. P.B., B.J., R.M.T., J.S.N., and M.L.J. devel-
oped and constructed the experimental setups used to acquire the presented data. R.M.T. and M.L.J. conducted
all experiments, performed the data analysis, and wrote the original draft of the manuscript. All authors reviewed
and edited this manuscript leading to its final form.
Competing interests
The authors declare no competing interests.
Additional information
Correspondence and requests for materials should be addressed to M.L.J.
Reprints and permissions information is available at www.nature.com/reprints.
Publisher’s note Springer Nature remains neutral with regard to jurisdictional claims in published maps and
institutional affiliations.
Open Access This article is licensed under a Creative Commons Attribution 4.0 International
License, which permits use, sharing, adaptation, distribution and reproduction in any medium or
format, as long as you give appropriate credit to the original author(s) and the source, provide a link to the
Creative Commons licence, and indicate if changes were made. The images or other third party material in this
article are included in the article’s Creative Commons licence, unless indicated otherwise in a credit line to the
material. If material is not included in the article’s Creative Commons licence and your intended use is not
permitted by statutory regulation or exceeds the permitted use, you will need to obtain permission directly from
the copyright holder. To view a copy of this licence, visit http://creativecommons.org/licenses/by/4.0/.
© The Author(s) 2022
Scientific Reports | (2022) 12:8301 | https://doi.org/10.1038/s41598-022-12255-9 11
Vol.:(0123456789)You can also read