Parameter uncertainty dominates C-cycle forecast errors over most of Brazil for the 21st century
←
→
Page content transcription
If your browser does not render page correctly, please read the page content below
Research article
Earth Syst. Dynam., 12, 1191–1237, 2021
https://doi.org/10.5194/esd-12-1191-2021
© Author(s) 2021. This work is distributed under
the Creative Commons Attribution 4.0 License.

            Parameter uncertainty dominates C-cycle forecast
              errors over most of Brazil for the 21st century
         Thomas Luke Smallman1,2 , David Thomas Milodowski1,2 , Eráclito Sousa Neto3 , Gerbrand Koren4,5 ,
                                     Jean Ometto3 , and Mathew Williams1,2
                             1 School of GeoSciences, University of Edinburgh, Edinburgh, UK
                     2 NationalCentre for Earth Observations, University of Edinburgh, Edinburgh, UK
                                            3 INPE, São José dos Campos, Brazil
                   4 Meteorology and Air Quality, Wageningen University, Wageningen, the Netherlands
              5 Copernicus Institute of Sustainable Development, Utrecht University, Utrecht, the Netherlands

                           Correspondence: Thomas Luke Smallman (t.l.smallman@ed.ac.uk)

                                   Received: 22 March 2021 – Discussion started: 8 April 2021
                      Revised: 14 October 2021 – Accepted: 15 October 2021 – Published: 23 November 2021

      Abstract. Identification of terrestrial carbon (C) sources and sinks is critical for understanding the Earth sys-
      tem as well as mitigating and adapting to climate change resulting from greenhouse gas emissions. Predicting
      whether a given location will act as a C source or sink using terrestrial ecosystem models (TEMs) is challenging
      due to net flux being the difference between far larger, spatially and temporally variable fluxes with large uncer-
      tainties. Uncertainty in projections of future dynamics, critical for policy evaluation, has been determined using
      multi-TEM intercomparisons, for various emissions scenarios. This approach quantifies structural and forcing
      errors. However, the role of parameter error within models has not been determined. TEMs typically have de-
      fined parameters for specific plant functional types generated from the literature. To ascertain the importance of
      parameter error in forecasts, we present a Bayesian analysis that uses data on historical and current C cycling
      for Brazil to parameterise five TEMs of varied complexity with a retrieval of model error covariance at 1◦ spa-
      tial resolution. After evaluation against data from 2001–2017, the parameterised models are simulated to 2100
      under four climate change scenarios spanning the likely range of climate projections. Using multiple models,
      each with per pixel parameter ensembles, we partition forecast uncertainties. Parameter uncertainty dominates
      across most of Brazil when simulating future stock changes in biomass C and dead organic matter (DOM).
      Uncertainty of simulated biomass change is most strongly correlated with net primary productivity allocation
      to wood (NPPwood ) and mean residence time of wood (MRTwood ). Uncertainty of simulated DOM change is
      most strongly correlated with MRTsoil and NPPwood . Due to the coupling between these variables and C stock
      dynamics being bi-directional, we argue that using repeat estimates of woody biomass will provide a valuable
      constraint needed to refine predictions of the future carbon cycle. Finally, evaluation of our multi-model analysis
      shows that wood litter contributes substantially to fire emissions, necessitating a greater understanding of wood
      litter C cycling than is typically considered in large-scale TEMs.

Published by Copernicus Publications on behalf of the European Geosciences Union.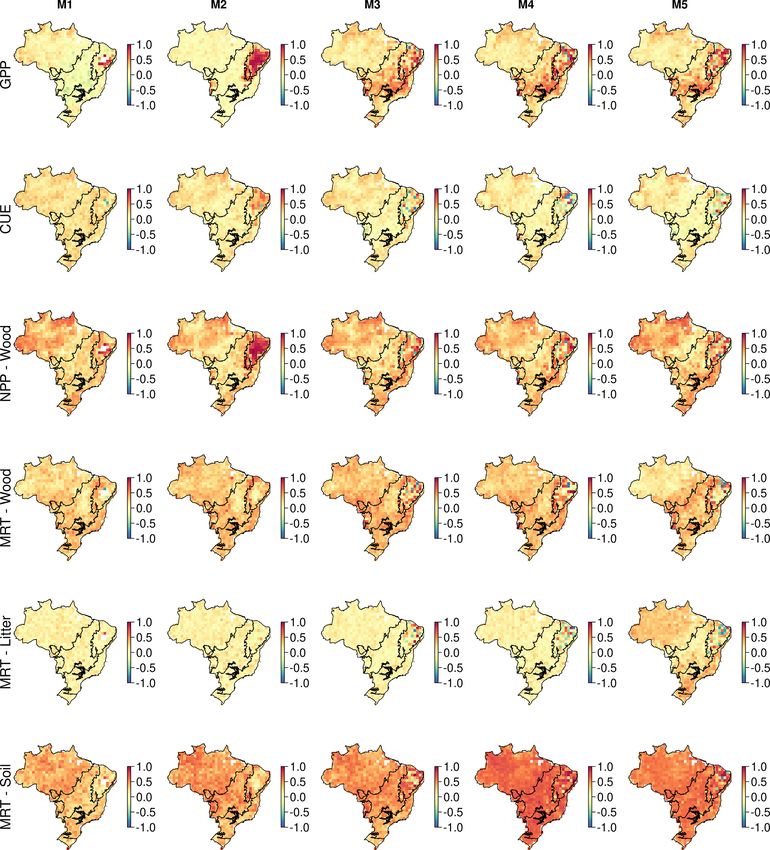
1192                              T. L. Smallman et al.: Parameter uncertainty dominates C-cycle forecast errors across Brazil

                                                                          lands in the Pantanal and temperate grasslands in the Pam-
                                                                          pas (Fig. 1). Brazil’s biomes store large quantities of car-
                                                                          bon in their biomass and soils, but Brazil is also among the
                                                                          largest emitters of CO2 from land-use change and deforesta-
                                                                          tion (Baccini et al., 2012; Matthews et al., 2014). Between
                                                                          1990 and 2015, Brazil’s forests lost 5.3 Pg C (Sanquetta et al.,
                                                                          2018), equating to ∼ 39 % of global forest carbon loss for the
                                                                          same period (Köhl et al., 2015). Moreover, the Amazon has
                                                                          been subject to increasingly frequent drought (Lewis et al.,
                                                                          2011) which significantly impacts net carbon exchange due
                                                                          to increased mortality and decomposition (Yang et al., 2018).
                                                                             Existing process models of the terrestrial ecosystem sim-
                                                                          ulate carbon stocks that differ significantly from current
                                                                          satellite-based Earth observation (EO)-based estimates and
Figure 1. Map of the major biomes of Brazil. Amazonia and the             disagree over future trends (Sitch et al., 2008; Huntingford
Atlantic Forest contain largely moist tropical forest. In contrast, the   et al., 2013; Shao et al., 2013; Exbrayat et al., 2018a, 2019).
Cerrado and Caatinga are hot and seasonally drought-affected sa-          Process-oriented terrestrial ecosystem models (TEMs) pre-
vannah ecosystems with substantial conversion to agriculture. The         dict the response of ecosystems to changes in their environ-
Pantanal is covered largely by wetlands. The Pantanal region has          ment and to disturbance (whether natural or of human ori-
a temperate moist climate covered largely by grasslands and agri-         gin). Analyses of ensembles of TEM simulations, which are
culture. Map source: Brazilian Institute of Geography and Statis-         assumed to represent the combined model structural and pa-
tics (IBGE), Biomes and Coastal-Marine System of Brazil map,              rameter uncertainty (Todd-Brown et al., 2013; Friend et al.,
https://www.ibge.gov.br/, last access: 17 November 2020.                  2014; Jones et al., 2016), have provided valuable information
                                                                          on the likely future dynamics of terrestrial ecosystems (e.g.
                                                                          Friend et al., 2014; Koven et al., 2015; Eyring et al., 2016;
1   Introduction                                                          Jones et al., 2016; Zhou et al., 2018). However, as TEMs
                                                                          typically lack information on their parametric uncertainty,
Globally terrestrial ecosystems are estimated to be a net                 it remains unclear whether model differences are driven by
carbon sink sequestering 3.2 ± 0.6 Pg C yr−1 or ∼ 30 % of                 different parameter estimates or model structure. Moreover,
anthropogenic CO2 emissions (Friedlingstein et al., 2019).                estimated responses to environmental change are sometimes
The net carbon balance of a given ecosystem is dependent                  contradictory between studies indicating model-ensemble-
on the balance between larger (and still uncertain) gross                 specific (i.e. model) conclusions (Zhou et al., 2018). For ex-
fluxes of uptake by photosynthesis, or gross primary pro-                 ample, using the Inter-Sectoral Impact Model Intercompari-
ductivity (GPP; 80–170 Pg C yr−1 ; Shao et al., 2013; Joiner              son Project (ISI-MIP) ensemble, Friend et al. (2014) showed
et al., 2018; Jung et al., 2020), and losses from plant respi-            that on global scales inter-model differences in the mean
ration (Ra ; 40–80 Pg C yr−1 ; assuming fixed Ra : GPP ratio              residence time (MRT) of biomass dominated uncertainty in
0.46; Collalti and Prentice, 2019), heterotrophic decomposi-              future carbon stocks, rather than differences in carbon in-
tion (Rhet ; 57.5 ± 9.8 Pg C yr−1 ; Sitch et al., 2015) and dis-          puts from photosynthesis, while the analysis by Koven et al.
turbance such as fire (∼ 2.2 Pg C yr−1 (1997–2016); van der               (2015), using the CMIP5 ensemble, indicated the reverse.
Werf et al., 2017). However, uncertainties associated with                Also using the CMIP5 ensemble, Todd-Brown et al. (2013)
gross fluxes remain large; for example, the range of global               showed that while on average simulated soil carbon stocks
GPP estimates is ∼ 60 % of the mean of estimates. More-                   could be explained by carbon inputs and residence time, there
over, the response of terrestrial ecosystems to elevated atmo-            was substantial between-model variation as a result of model
spheric CO2 concentrations and associated climate change                  structural and parameter differences. Lacking a common ba-
are key unknowns in the Earth system (Jones et al., 2016).                sis for calibration and evaluation, model intercomparisons
Uncertainties on ecosystem responses are greatest across the              have struggled to identify and reduce uncertainties surround-
tropics, where data are scarce and process models both di-                ing model structure and parameterisation.
verge in their analysis of current C cycling and exhibit dis-                Ecosystem parameters that drive C exchanges (e.g. plant
cordant C-cycle responses to projected changes in climate                 traits) are known to be highly variable both in space and of-
(Exbrayat et al., 2019; Shao et al., 2013).                               ten in time, even within a given biome (e.g. moist tropical
   Brazil’s ecosystems are among the most biodiverse in the               forest) (Butler et al., 2017; Exbrayat et al., 2018b; Kattge
world, spanning a range of biomes and climate space (My-                  et al., 2020). Moreover, field-based studies such as those
ers et al., 2000; Lapola et al., 2014): the moist tropical forest         across the Amazon basin have identified substantial spatial
of Amazonia and the Atlantic forests, seasonally dry tropical             variation and trade-off among ecosystem variables including
grassland forest mosaics of the Cerrado and Caatinga, wet-                allocation of net primary productivity to plant tissue, MRTs

Earth Syst. Dynam., 12, 1191–1237, 2021                                                    https://doi.org/10.5194/esd-12-1191-2021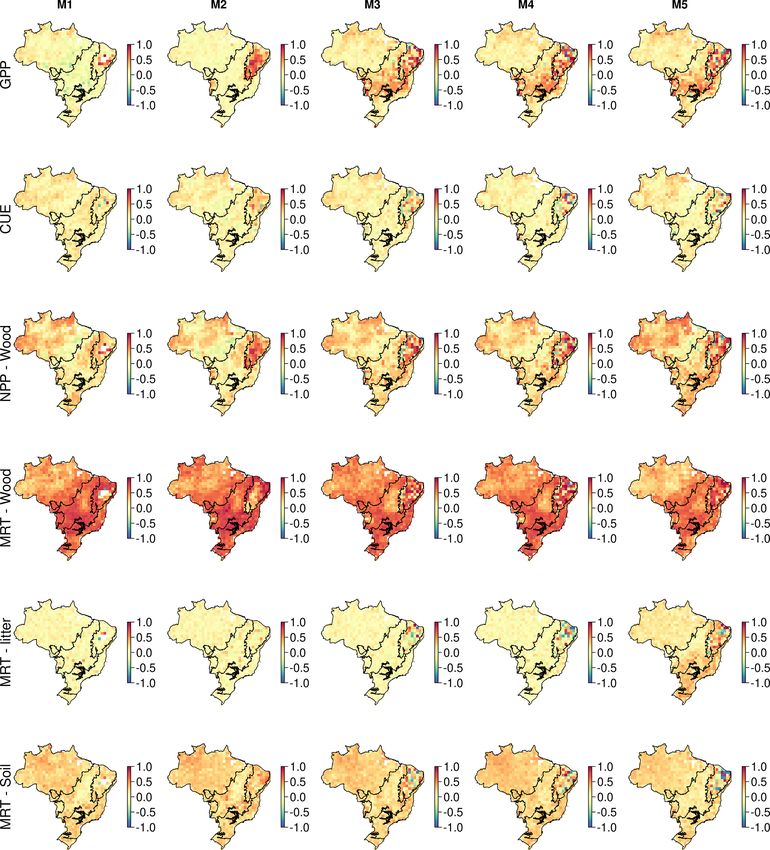
T. L. Smallman et al.: Parameter uncertainty dominates C-cycle forecast errors across Brazil                                1193

of C pools and carbon use efficiency (CUE) (NPP / GPP)              bles provide explicit estimates of parameter uncertainty and
(Doughty et al., 2015; Malhi et al., 2015). In contrast, the ma-    its spatial variability. The five models have a common ba-
jority of TEMs represent ecosystems processes using a lim-          sic structure, but progressively more complex process repre-
ited number of plant functional types (PFTs), which assume          sentation, allowing quantification of the model ensembles’
a single parameterisation for each biome (i.e. all moist tropi-     structural uncertainty. Moreover, our approach mimics the
cal forests are assumed to have the same traits). These TEMs        typical TEM model development process where incremen-
therefore lack spatial variation in the traits that governs the     tal changes in process representation are evaluated for their
response of ecosystems to changes in their environment, such        impact on simulated outcomes (e.g. Mercado et al., 2009;
as disturbance by fire (e.g. Exbrayat et al., 2018b). Further-      Verheijen et al., 2015; Jones et al., 2020), while we go fur-
more, PFTs are typically calibrated and evaluated at a sin-         ther by explicitly quantifying the associated parametric un-
gle site, which may not be representative of a given biome’s        certainty which is usually unavailable. Comparison of the dy-
mean dynamics (Kuppel et al., 2012).                                namics of this model ensemble against independent estimates
   Model–data fusion (MDF) approaches offer an opportu-             of the Brazilian C cycle quantifies whether a given change in
nity to use a diverse array of observations to calibrate and        model structure (i.e. added complexity) leads to an improve-
evaluate TEMs by updating their current state and/or refin-         ment, degradation or equally valid C-cycle analysis. Once
ing their parameters, weighted by observation uncertainty.          calibrated, we simulate each model for each pixel over a pa-
For example, Exbrayat et al. (2018b) calibrated an inter-           rameter ensemble and under multiple climate change scenar-
mediate complexity C-cycle model independently in each              ios providing quantification of climate scenario uncertainty
1◦ × 1◦ pixel across the tropics using (among other data)           to 2100.
location- and time-specific information on leaf area index             Using this approach, we address the following research
(LAI), biomass and burned area from EO. Their analysis              questions:
showed substantial within-biome variation in ecosystem vari-
ables (and model parameters) in response to varied intensity         1. Does increasing model complexity improve agreement
and frequency of fire. Such variations and parametric uncer-            with independent evaluation information? Firstly, we
tainty are neglected in a classical PFT-based TEM frame-                hypothesise that including a water-cycling submodel
work, introducing errors into their representation of ecosys-           will reduce photosynthesis due to soil moisture limita-
tem C dynamics. A critical output of a location-based ap-               tions and so improve model outputs for the drier Cer-
proach is the retrieval of both parameter magnitude and pa-             rado and Caatinga regions. Secondly, we hypothesise
rameter uncertainty information at site level (i.e. pixel or grid       that inclusion of a wood litter pool will increase fire
cell). Such information can highlight the greatest unknowns,            emissions by adding another combustible dead organic
underpin explicit uncertainty propagation into future envi-             matter pool and improve estimated emissions particu-
ronments (e.g. climate change) and directly investigate the             larly within areas of forest cover loss such as the south
parameter-process uncertainty interactions that drive changes           eastern edge of the Amazon (the arc of deforestation).
in ecosystem C stocks.                                               2. How is uncertainty associated with predicted carbon
   Uncertainty in future carbon cycle simulations (e.g. Arora           stocks partitioned between (i) parameter estimates,
et al., 2020) is dominated by combined model structure and              (ii) model structure and (iii) the projected climate
parameter uncertainty; however, there remains a substantial             change scenario? We hypothesise that the climate
contribution due to variations between climate change sce-              change scenario will contribute a minor component to
narios themselves (Lovenduski and Bonan, 2017; Bonan and                the overall uncertainty, consistent with the results found
Doney, 2018). The potential mean global warming is esti-                by Bonan et al. (2019). Additionally, we hypothesise
mated to be 1.7–5 ◦ C by 2100 (IPCC, 2014). This uncertainty            that parameter uncertainty will be largest in areas of
is driven largely by broad ranges in anthropogenic emis-                large biomass and soil carbon stocks (i.e. Amazon and
sions and land-use and land-cover change for which there                Atlantic forests) due to larger uncertainties found in ob-
are many plausible pathways leading to different atmospheric            servational constraints at larger values, whereas model
CO2 concentrations (O’Neill et al., 2016) for use in model              structure uncertainty will be more important in regions
intercomparisons (e.g. Eyring et al., 2016). For example,               with lower stocks and more seasonality in fluxes, such
Bonan et al. (2019) showed that both land-use and climate               as the Cerrado.
change scenarios had a significant impact on TEM-simulated
terrestrial carbon stocks, indicating the need to include future     3. Is forecast uncertainty more strongly linked to the MRT
scenarios in any uncertainty partitioning experiment.                   of biomass or differences in carbon inputs from pho-
   Here, we use the CARbon DAta MOdel fraMework (CAR-                   tosynthesis? How does the relative importance of these
DAMOM; Bloom et al., 2016) to calibrate a suite of five in-             factors vary spatially across biomes and among models
termediate complexity TEMs across Brazil (1◦ × 1◦ pixel;                with different process representation? We hypothesise
2001–2017; monthly time steps) to retrieve ensembles of                 that biomes with stronger environmental constraints on
pixel-specific parameters. These localised parameter ensem-             production, for instance, dry tropics compared to moist

https://doi.org/10.5194/esd-12-1191-2021                                            Earth Syst. Dynam., 12, 1191–1237, 2021
1194                           T. L. Smallman et al.: Parameter uncertainty dominates C-cycle forecast errors across Brazil

      tropics, will have errors dominated more by this process
      than MRT.

   We investigate these questions at the scale of Brazil and
also for its key biomes to determine if there are regional dif-
ferences. We conclude with an assessment of key steps re-
quired to produce more robust projections of how Brazilian
C stocks will respond to future forcing. The novelty of this
study is to compare C-cycle projections that include propa-
gated error from model calibration at pixel scale, for a range
of models with difference process controls on C cycling, al-
lowing a robust data-constrained analysis.

2     Methods

We use CARDAMOM (Bloom et al., 2016) to perform a
MDF analysis of Brazil at 1◦ × 1◦ spatial (702 pixels) and
monthly temporal resolutions between 2001 and 2017 (in-
clusive). CARDAMOM retrieves ensembles of model pa-
rameters independently for each location (see Sect. 2.1) as
a function of location-specific observational constraints (see
Sect. 2.3). To quantify model structural uncertainty, param-       Figure 2. The five DALEC versions include three carbon cycle
eters are retrieved for five versions of the Data Assimila-        structures. The top row shows the DALEC model carbon structure
tion Linked Ecosystem Carbon (DALEC) terrestrial ecosys-           as previously described in Bloom and Williams (2015) as is used for
tem model, of differing complexity (see Sect. 2.2; Table 1).       M1–3. The middle row shows M4 where Ra is partitioned between
The DALEC calibrations are evaluated using independent es-         Rm and Rg . The bottom row shows the inclusions of a wood litter
timates of net biome exchange (NBE) of CO2 , GPP and fire          pool used in M5.
(see Sect. 2.4). The calibrated DALEC models are then simu-
lated into the future under four climate change scenarios (see
Sect. 2.5) used in phase 6 of the Coupled Model Intercom-             Pixel-level uncertainties are estimated directly from the
parison Project (CMIP6; O’Neill et al., 2016).                     CARDAMOM-retrieved ensembles of parameters and their
                                                                   model-generated C stocks and fluxes. However, we lack a
                                                                   robust understanding of how uncertainties are correlated in
2.1    CARDAMOM                                                    space, making the propagation of uncertainties from the pixel
                                                                   level to Brazil wide challenging. Assuming an intermedi-
CARDAMOM is a MDF framework which uses a Bayesian                  ate value would lead to an arbitrary estimate of uncertainty
approach within an adaptive proposal – Markov chain                while assuming either fully correlated or uncorrelated uncer-
Monte Carlo (AP-MCMC) to estimate ensembles of DALEC               tainties leads to either an over- or under-estimate in Brazil-
model parameters (x; Table A1) consistent with observa-            wide uncertainties, respectively. To be conservative, here,
tional constraints and their uncertainties (Haario et al., 2001;   we assume uncertainties are fully correlated when propa-
Rodríguez-Veiga et al., 2020). CARDAMOM analyses are               gating from pixel-level to Brazil-wide estimates. To allow
conducted independently for each pixel location and repeated       for non-Gaussian distributions in the pixel-level ensembles,
three times (each repeat is known as a chain). Each chain as-      we assume that the fully correlated assumption is approx-
sesses 100 million parameter proposals, drawn from uniform         imated by aggregating the pixel-level 5 % and 95 % quan-
prior ranges, from which a subsample of 1000 accepted pa-          tiles across Brazil as previously done (e.g. Exbrayat et al.,
rameter vectors are stored. Parameters from the second half        2018b). Again, to be conservative, we will only discuss in
of the accepted subsample are used for post-processing, as         detail between-model differences which are also supported
we expect the chains to have converged by this point and           in the pixel-level estimates.
thus represent a realistic approximation of the real pixel-
level uncertainty. The chains are used to assess AP-MCMC
                                                                   2.2   DALEC models
quality; in each location, the chains are expected to statisti-
cally converge based on the Gelman–Rubin convergence cri-          The DALEC model suite used here comprises five related in-
terion (Gelman and Rubin, 1992). Any location which did            termediate complexity models of the terrestrial carbon cycle
not achieve convergence is re-run. For further details, see        (M1–5). Each model version tracks the state and dynamics
Sect. A1 in the Appendix.                                          of live and dead carbon pools, their interactions and their re-

Earth Syst. Dynam., 12, 1191–1237, 2021                                              https://doi.org/10.5194/esd-12-1191-2021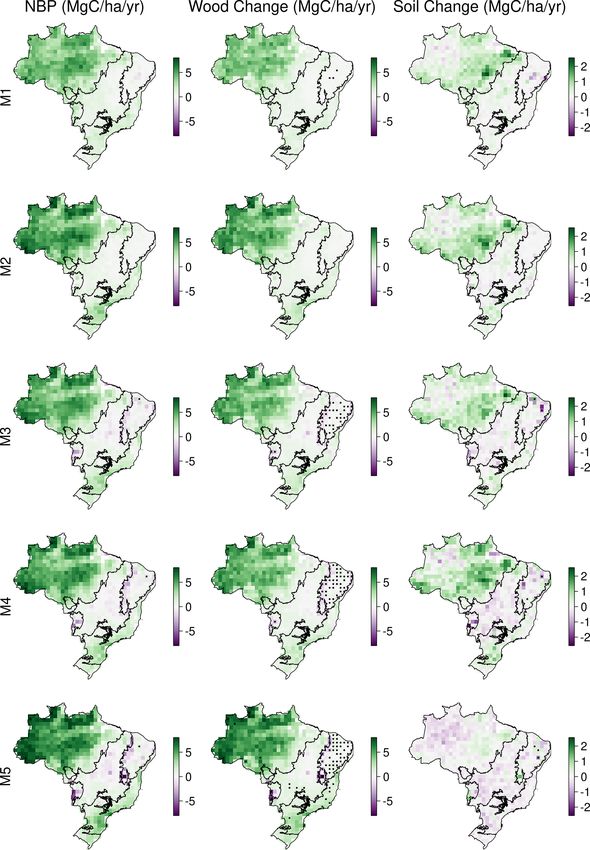
T. L. Smallman et al.: Parameter uncertainty dominates C-cycle forecast errors across Brazil                                    1195

Table 1. Summary information of process representations and total number of calibrated parameters of the different Data Assimilation
Linked Ecosystem Carbon (DALEC) models. Model complexity increases from models M1–5. ACM is the Aggregated Canopy Model used
to predict photosynthesis (GPP), with ACM1 the simplest version and ACM2 more complex with links to water balance. Plant respiration
(Ra ) can be determined as a simple ratio of GPP or by separate maintenance (Rm ) and growth (Rg ) components.

                           Model     Photosynthesis    Water    Plant respiration       Wood       No. of
                                                       cycle                            litter   parameters
                           M1            ACM1          No       Ra : GPP                No          23
                           M2            ACM2          No       Ra : GPP                No          23
                           M3            ACM2          Yes      Ra : GPP                No          23
                           M4            ACM2          Yes      Rm : GPP + Rg : NPP     No          27
                           M5            ACM2          Yes      Rm : GPP + Rg : NPP     Yes         29

sponse to climate and exogenous factors such as fire or distur-       2.3.2    Wood C
bance. The complexity (numbers of carbon pools, their con-
                                                                      A single estimate per pixel of AGB and uncertainty is ex-
nectivity) and process representation (component submodels
                                                                      tracted from a combination of the Avitabile et al. (2016) and
of varying complexity) vary between DALEC models. There
                                                                      Longo et al. (2016) maps. Avitabile et al. (2016) combines
are three alternate carbon cycle structures (Fig. 2), plus a
                                                                      multiple years of EO and field data to create a pan-tropical
range of different submodels (Table 1). The submodels are
                                                                      map nominally representative of 2007. Longo et al. (2016)
related to different simulations of GPP, Ra , and carbon–water
                                                                      covers the Brazilian Amazonia only and uses field inventory
interactions. These submodels build on a common baseline
                                                                      and airborne lidar explicitly representing 2014. These maps
structure, facilitating efforts to disentangle the impact of each
                                                                      are created using different source data and algorithms; they
specific process representation. Due to their varied complex-
                                                                      will contain unique errors and bias. Therefore, we use the
ity the DALEC models have different numbers of parameters
                                                                      Longo et al. (2016) map to provide constraint on Amazonian
which are calibrated for each location. DALEC parameters
                                                                      AGB and the Avitabile et al. (2016) map elsewhere (Fig. A1).
for each model can be found in Table A1 including a sum-
                                                                         The DALEC models simulate a combined above- and
mary of the key features of each model in Sect. A2 in the
                                                                      below-ground woody pool. To link the AGB maps to the sim-
Appendix.
                                                                      ulated wood pool, we use an allometric relationship to es-
                                                                      timate the below-ground biomass (BGB) following Saatchi
2.3     Observational constraints and driving information             et al. (2011) (units of Mg ha−1 ).
CARDAMOM uses a diverse array of data as both obser-
vational constraint and model inputs. Information on LAI              BGB = 0.489 · AGB0.89                                       (1)
(time series), above-ground biomass (AGB) and soil carbon
                                                                         AGB uncertainty is similarly converted based on the allo-
includes assimilated observations with an associated uncer-
                                                                      metric equation neglecting statistical uncertainty of the allo-
tainty. Meteorology, burned area, forest cover loss and soil
                                                                      metric equation itself. Wood C and its uncertainty are then
texture (sand/clay fractions) are inputs without uncertainty.
                                                                      spatially aggregated assuming uncorrelated uncertainties as
Summary information on the assimilated observations and
                                                                      error covariance remains unknown.
their uncertainties is shown in Fig. A1.
                                                                      2.3.3    Soil C and texture
2.3.1    Leaf area index
                                                                      Location-specific estimates of soil carbon and sand/clay frac-
Time series information on LAI magnitude and uncertainty
                                                                      tion are extracted from the SoilGrids database (Hengl et al.,
is extracted from the 1 km × 1 km 8 d product from Coperni-
                                                                      2017). Soil carbon is used as a prior on the initial soil carbon
cus Service Information (2020). LAI was aggregated to the
                                                                      stock, while soil texture information is used as an input to the
analysis resolution. Each LAI estimate has a corresponding
                                                                      soil hydrology submodel. SoilGrids uses inventory data of
uncertainty value; however, the robustness of the uncertainty
                                                                      soil properties and interpolates these across a 250 m × 250 m
provided with EO LAI products remains unclear (Zhao et al.,
                                                                      grid using a machine learning (ML) approach (Hengl et al.,
2020). To be conservative, we assumed the maximum uncer-
                                                                      2017). However, SoilGrids lacks an estimate of uncertainty.
tainty value reported from the raw data used in the aggrega-
                                                                      For simplicity, we assumed an uncertainty was the standard
tion of each time step. Each pixel will typically assimilate
                                                                      deviation of the spatially aggregated dataset.
204 EO-based LAI estimates, i.e. 12 months × 17 years.

https://doi.org/10.5194/esd-12-1191-2021                                               Earth Syst. Dynam., 12, 1191–1237, 2021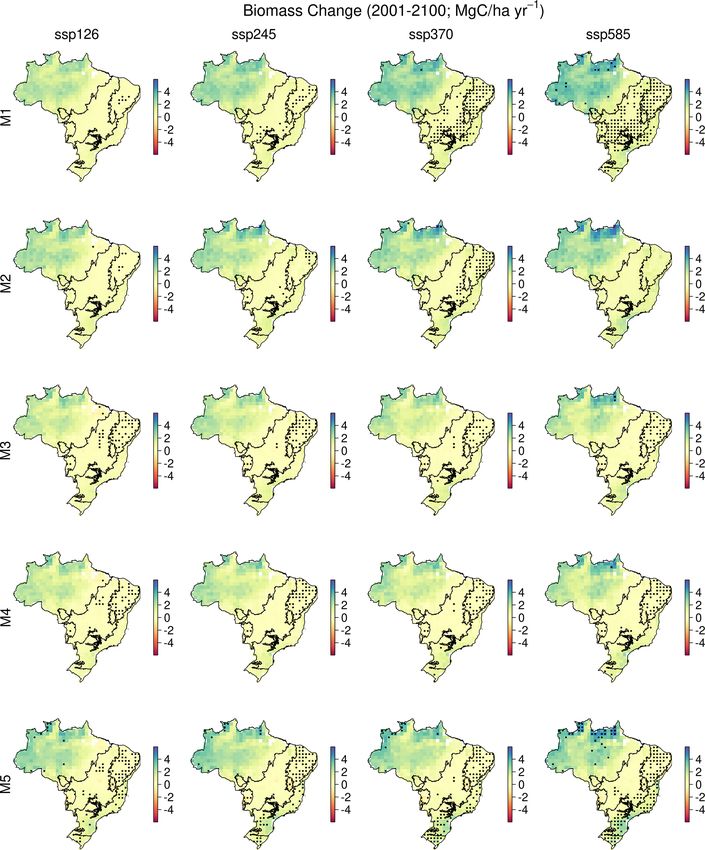
1196                          T. L. Smallman et al.: Parameter uncertainty dominates C-cycle forecast errors across Brazil

2.3.4    Disturbance                                              In addition to CTE’s standard atmospheric measurements,
                                                                  CT-SAM includes airborne estimates focused over the Ama-
Fire and forest biomass removal was imposed using EO
                                                                  zon forest (Gatti et al., 2014) and uses zoom regions over
information. The MODIS burned fraction product (Giglio
                                                                  South America for improved atmospheric transport (van der
et al., 2018) determines the areas where fire is imposed.
                                                                  Velde et al., 2015). The ensemble uses five net ecosys-
Emissions are determined assuming a fraction of simulated
                                                                  tem exchange (NEE) priors and three fire emission drivers
biomass undergoes combustion or is converted to litter based
                                                                  (combined to estimate NBE) but with a common set of at-
on tissue-specific combustion-completeness factors, follow-
                                                                  mospheric constraints and transport model (Schaefer et al.,
ing Exbrayat et al. (2018b). Forest biomass removal is im-
                                                                  2008; Bodesheim et al., 2018; van Schaik et al., 2018;
posed using the Global Forest Watch (GFW) forest cover
                                                                  Haynes et al., 2019; Koren, 2020). The mean pixel-level
loss product (Hansen et al., 2013). GFW provides the year in
                                                                  uncertainty between ensemble members is ∼ 0.5 g C m2 d−1
which a forest area is removed, with biomass losses assumed
                                                                  which, due to the near-neutral estimates, is ∼ 50 times the
to occur evenly across the year. All biomass is assumed to
                                                                  mean value. By using a range of priors, it covers the uncer-
be subject to removal, except fine roots which remain in the
                                                                  tainty in the seasonal variation of C fluxes in tropical regions
ecosystem.
                                                                  (Saleska et al., 2003; Restrepo-Coupe et al., 2013; Koren
                                                                  et al., 2018; Mengistu et al., 2020). In the remainder of this
2.3.5    Meteorological drivers                                   text, the CTE and CT-SAM datasets are collectively referred
Meteorological drivers are drawn from the Climatic Research       to as CTE.
Unit and Japanese reanalysis (CRU-JRA) v1.1 dataset, a 6-            Evaluation of GPP is provided by the combination of three
hourly 0.5◦ × 0.5◦ reanalysis (University of East Anglia Cli-     independent estimates of GPP (FLUXCOM, Copernicus and
matic Research Unit and Harris, 2019). Atmospheric CO2            FluxSat v2). FLUXCOM GPP is estimated by an ensemble
concentration is taken from the Mauna Loa global CO2 con-         of ML approaches driven with meteorological reanalysis and
centration (https://www.esrl.noaa.gov/gmd/ccgg/trends/, last      EO-derived vegetation indices and calibrated using eddy co-
access: 22 August 2020). Due to their differing complexities,     variance information drawn from the FLUXNET network
the DALEC models use different drivers. All models use tem-       (Jung et al., 2020). FLUXCOM has been widely evaluated
perature, short-wave radiation and atmospheric CO2 concen-        using eddy covariance information and has been used to eval-
trations. M2–5 additionally use vapour pressure deficit and       uate TEMs (Jung et al., 2020). Copernicus gross dry mat-
wind speed. M3–5 use precipitation. Summary information           ter productivity (i.e. GPP; Copernicus Service Information,
for mean climate is shown in Fig. A2.                             2020) uses a modified Monteith (1972) approach which es-
                                                                  timates GPP as a function of absorbed photosynthetically ac-
                                                                  tive radiation, temperature, atmospheric CO2 concentration
2.4     Evaluation of models against independent data
                                                                  and land-cover-specific parameters. FluxSat v2 combines
To address research question 1, the five models were eval-        MODIS reflectance and meteorological information within a
uated against a series of independent data on NBE of CO2 ,        ML framework to estimate GPP (Joiner et al., 2021). Similar
GPP and fire emissions. These datasets were derived from          to FLUXCOM, FluxSat v2 is calibrated using observations
atmospheric inversions, upscaling from flux measurements          from the FLUXNET network. Collectively, these indepen-
and from remote sensing of burned area. A key evaluation          dent GPP estimates are assumed to represent a more realis-
metric is the degree of consistency at pixel level between        tic estimate of GPP uncertainty (mean of ∼ 1.2 g C m2 d−1 or
the DALEC models and the independent historical evalua-           20 %) from observation-orientated sources for comparisons
tion data. We define consistency as the pixel-level ensemble      with CARDAMOM-DALEC.
of DALEC C-cycle estimates overlapping independent ob-               Independent estimates of fire emissions are drawn from the
servations at > 90 % of observed time steps.                      Global Fire Emissions Database version 4.1s (GFEDv4.1s
   CarbonTracker Europe (CTE) is a widely used atmo-              (2001–2017); van der Werf et al., 2017) and the Global
spheric inversion system which estimates NBE by combining         Fire Assimilation System (GFAS (2003–2017); Kaiser et al.,
time-varying prior information on NBE along with imposed          2012). Neither product comes with uncertainty information.
CO2 fluxes from fire, fossil fuels and ocean exchange with        GFEDv4.1s uses MODIS burned area to impose fire on a
observations of atmospheric CO2 concentrations (van der           TEM with actual emissions determined based on the sim-
Laan-Luijkx et al., 2017). A single CTE analysis which spans      ulated magnitude of carbon pools at steady state in con-
the whole analysis period (2001–2017) is used to provide a        junction with pool-specific combustion-completeness param-
long-term comparison of the trend in NBE (van der Laan-           eters (van der Werf et al., 2017). The GFAS product uses
Luijkx et al., 2017). Spatial comparisons are restricted to the   MODIS radiative energy and active fire products combined
2009–2017 period using the dataset described below.               with ecosystem-specific parameters to estimate carbon emis-
   An ensemble of 15 analyses (1◦ × 1◦ ; 2009–2017) which         sions from fire (Kaiser et al., 2012). As these products are
builds on the CarbonTracker South America (CT-SAM)                based on fundamentally different approaches, we assume that
framework provided robust uncertainty estimates of NBE.           the range between them approximates the fire emissions un-

Earth Syst. Dynam., 12, 1191–1237, 2021                                            https://doi.org/10.5194/esd-12-1191-2021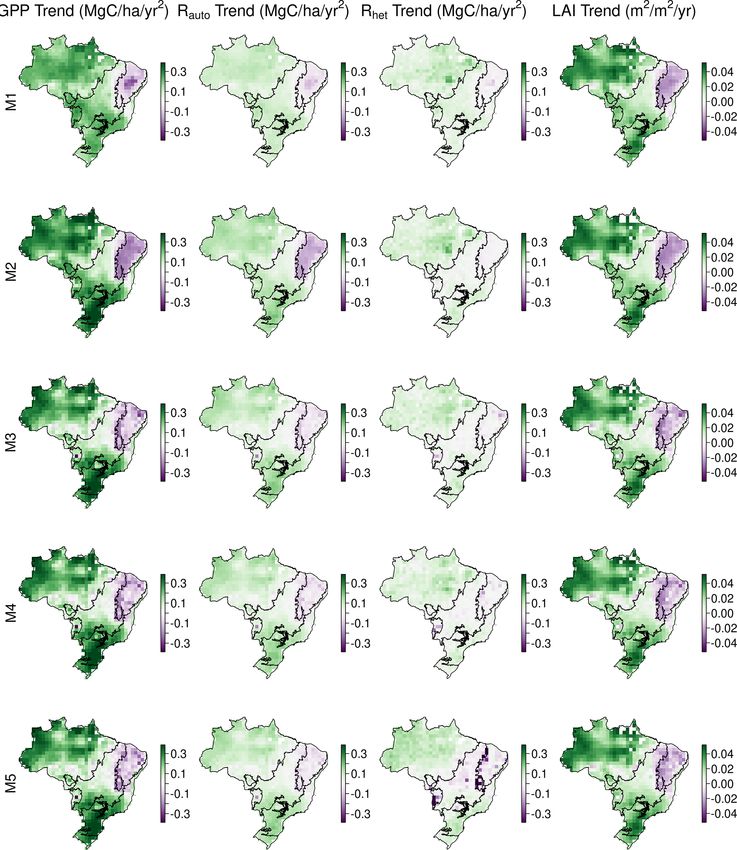
T. L. Smallman et al.: Parameter uncertainty dominates C-cycle forecast errors across Brazil                               1197

certainty (mean of ∼ 0.04 g C m2 d−1 or ∼ 100 %). We eval-          To address question 3, quantifying the role of key ecosys-
uate DALEC for their overlapping period (2003–2017).             tem traits (NPP partitioning and MRTs) on C stock trajec-
                                                                 tories, the ensemble of pixel-level estimates of GPP, CUE,
                                                                 NPP allocation and MRTs is correlated with the ensem-
2.5   Analysing the drivers of forecast uncertainty              ble of biomass and DOM stock change estimated between
                                                                 2001–2100. It is the ensembles of per-pixel parameters, and
To project DALEC to 2100, future climate drivers were ex-        by extension ensembles of C stock and flux estimates, that
tracted from the UK Earth System Model (UKESM; Sellar            uniquely allow CARDAMOM to explicitly quantify the un-
et al., 2019) contribution to CMIP6 (Eyring et al., 2016).       certainty in critical ecosystem properties with C stock dy-
This study uses the core Shared Socioeconomic Pathway            namics.
(SSP) scenarios – SSP1-2.6 W m−2 , SSP2-4.5 W m−2 , SSP3-
7.0 W m−2 , SSP5-8.5 W m−2 – spanning a mean global              3     Results
warming of 1.7–5 ◦ C (O’Neill et al., 2016). The scenarios
are also used to impose future forest biomass extraction. The    We conducted MDF analyses to retrieve ensembles of
contemporary meteorology from observations differs from          location-specific parameters for five DALEC models of var-
that generated in the climate models used to project future      ied complexity across Brazil. Each model simulated the cal-
climate. As a result, there are step changes in drivers be-      ibration data with a good degree of skill, returning similar
tween historical and future climate, impacting the simulation    likelihood scores (R 2 > 0.98; Figs. 3–5, A4 and A5). Sim-
of the carbon cycle in an unrealistic manner. To avoid these     ulated NBE, GPP and fire emissions have been evaluated
step-change impacts, future meteorology is imposed as an         at 1◦ (Fig. 4) and national scale (Fig. 5; Table 2) against
anomaly relative to 2018. Specifically, each month of the fu-    independent estimates. The 1◦ spatial parameter ensembles
ture meteorology extracted from the UKESM has the corre-         show that there is a strong dependency between NBE and
sponding month from 2018 subtracted creating the anomaly         wood stocks (R 2 > 0.8; Fig. A6). Furthermore, we quantify
time series; i.e. for each month of 2018, the anomaly would      the reduction in posterior parameter distributions relative to
be equal to 0. The anomalies are then added to the absolute      their prior ranges, which indicates substantial variability both
values of the monthly values from 2018 from the calibra-         spatially (Fig. A7), between parameters (Table A2) and pa-
tion meteorology time series but with sanity checks to pre-      rameters representing different ecosystem components (Ta-
vent negative values in positive definite variables. The mean    ble A3). The DALEC parameter ensembles have been pro-
temperature (M1–5), incoming short-wave radiation (M1–5),        jected to 2100 (Fig. 6) and show that parameter, not structure
vapour pressure deficit (M2–5), wind speed (M2–5) and pre-       or climate change scenario, dominates overall uncertainty in
cipitation (M2–5) anomalies for each scenario are shown in       most areas (Fig. 7). Finally, using the parameter ensembles
Fig. A3. The time series of future atmospheric CO2 concen-       to quantify the correlation between ecosystem variables and
tration is prescribed for each scenario. Disturbance due to      future carbon stock dynamics, we identify allocation of NPP
forest harvest is driven by the management scenarios associ-     to wood (NPPwood ) and MRTwood as targets for further con-
ated with each SSP. However, as DALEC does not represent         straint on model forecasts (Figs. 8 and 9).
land-cover types, we neglect land-use change in the drivers.
Thus, any forest which undergoes biomass removal subse-
                                                                 3.1    Calibration constraints
quently remains a forest and is allowed to regrow. Finally, as
we currently lack a predictive model of fire in DALEC (i.e.      All DALEC models match their calibration information with
we drive fire with EO burned area), we extended observed         a high degree of skill (Fig. 3). The root mean square error
fire for the contemporary period into the future simulations.    (RMSE) is small for LAI and the initial soil carbon stock
   Model analyses quantified the relative contribution of        (< 5 %). The RMSE between simulated wood stocks and cal-
variation in model parameters, model structure and climate       ibration observations is larger in wood stocks (< 16 %) and
change scenario to overall uncertainty in the simulation of      is dominated by a model–observation mismatch at smaller
biomass and dead organic matter (DOM) to 2100. Parameter         wood stocks (< 50 Mg C ha−1 ; 20 %–28 %) with smaller er-
uncertainty was estimated to be the 90 % CI resulting from       rors (< 1 %) otherwise. The calibrated Ra : GPP (CUE =
the simulation of the retrieved parameter ensembles. Model       1 − Ra : GPP) fraction across Brazil is consistent with the
structural uncertainty was estimated as the between-model        assimilated prior (M1, 4, 5 are 0.43; M2 is 0.46; M3
range of the pixel-level median estimates. Both parametric       is 0.44) for each model (mean deviation < 0.06; prior of
and structural uncertainties were estimated for each climate     0.46 ± 0.12; Fig. A5). The largest deviations from the prior
change scenario and then averaged across scenarios to pro-       are found in the Caatinga (Fig. A5), a hot, dry biome with
vide an overall estimate. Climate change scenario uncertainty    mean air temperature > 25 ◦ C and rainfall < 800 mm yr−1
was estimated as the pixel-level range of median estimates       (Fig. A2). In M2 (ACM2, no water cycle), the Caatinga has a
across scenarios for each model. This analysis addresses re-     higher Ra : GPP (deviations up to 0.33), while models M3–5
search question 2.                                               (ACM2, with water cycle) estimate a lower Ra : GPP in the

https://doi.org/10.5194/esd-12-1191-2021                                          Earth Syst. Dynam., 12, 1191–1237, 2021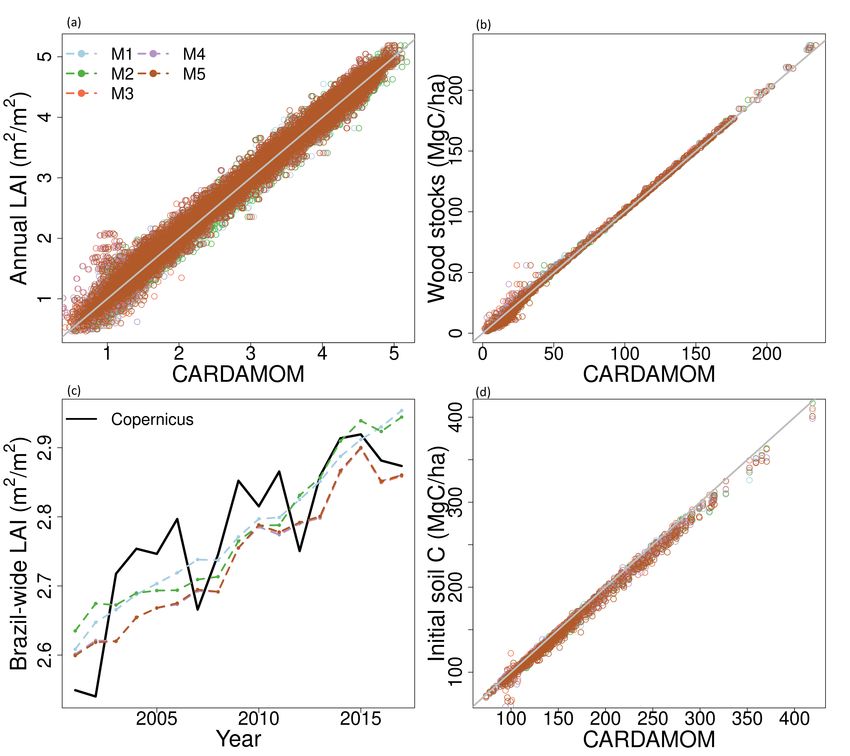
1198                             T. L. Smallman et al.: Parameter uncertainty dominates C-cycle forecast errors across Brazil

Table 2. Summary of Brazil-wide carbon budgets for each DALEC model and independent estimates. Fluxes are GPP, autotrophic res-
piration (Ra ), heterotrophic respiration (Rh ), forest biomass loss, carbon emissions due to fire, NEE of CO2 (Ra + Rh − GPP) and NBE
(NEE + fire). All units are in Pg C yr−1 . Values given as the median pixel-level estimates averaged across Brazil, while values in parentheses
are averaged Brazil-wide for the 5 % and 95 % quantiles, i.e. assuming fully correlated uncertainties. Independent estimates are derived from
FLUXCOM FluxSat v2 and Copernicus for GPP, GFW (for forest loss), Global Fire Emissions Database v4.1s for fire and CarbonTracker
Europe for NBE. The time period of all data is 2001–2017.

   Flux                       M1                  M2                   M3                 M4                  M5     Independent estimate
   GPP            17.7 (9.8/23.4)    19.0 (14.6/22.3)    17.8 (12.7/21.8)    17.8 (12.7/21.8)    17.8 (12.7/21.8)                18.4–20.9
   Ra               7.7 (3.5/12.9)     8.8 (5.1/13.0)         7.8 (4.2/12)      7.7 (3.8/11.9)      7.6 (3.8/11.9)                       –
   Rh               7.3 (3.2/14.3)     7.4 (3.6/14.1)       7.6 (3.7/14.2)      7.6 (3.8/14.4)      7.3 (3.5/14.0)                       –
   Fire          0.11 (0.07/0.19)    0.11 (0.08/0.18)    0.11 (0.07/0.18)    0.12 (0.08/0.23)     0.17 (0.1/0.38)                     0.20
   Forest loss   0.18 (0.12/0.28)    0.18 (0.12/0.28)    0.18 (0.12/0.29)    0.18 (0.12/0.28)    0.18 (0.13/0.28)                     0.24
   NEE           −1.9 (−6.1/3.9)     −2.3 (−6.2/3.5)     −2.0 (−6.3/4.4)     −2.1 (−6.4/4.5)     −2.5 (−6.7/3.9)                    −0.26
   NBE           −1.8 (−5.9/4.0)     −2.2 (−6.1/3.7)     −1.9 (−6.1/4.6)     −2.0 (−6.3/4.7)     −2.3 (−6.5/4.1)                     0.014

                                                                          in the parameter posteriors relative to the prior bounds
                                                                          (1 − posteriorCI90 : prior range) varies between models (M2
                                                                          of 0.55, M5 of 0.46; Table A2) but with much larger vari-
                                                                          ability between parameters (Rhet coefficient of 0.12, initial
                                                                          soil of 0.96) and across Brazil (0.62–0.7 for the Caatinga,
                                                                          0.42–0.5 for the Amazon; Fig. A7). The spatial pattern across
                                                                          Brazil broadly follows the spatial distribution of precipita-
                                                                          tion (Fig. A2). The greatest reduction in posterior parame-
                                                                          ter uncertainty is typically achieved in M2 with the lowest
                                                                          in M5 and broadly similar values in M1, 3 and 4. Parame-
                                                                          ters related to initial C conditions and canopy phenology are
                                                                          best constrained, as expected given the majority of observa-
                                                                          tions directly relate to these parameter groups, while NPP al-
                                                                          location and turnover-/decomposition-related parameters are
                                                                          least constrained in the posterior (Table A3).

                                                                          3.2   Independent evaluation of Brazilian C cycling

Figure 3. Comparison between observational constraints used to            DALEC-simulated NBE was statistically consistent with
calibrate the DALEC models and the corresponding model out-               the CTE ensemble at the 90 % confidence interval (CI)
puts. The grey line (a, b, d) shows the 1 : 1 line. LAI is presented      across > 95 % of Brazil (2009–2017; Fig. 4); i.e. there is
as a pixel-wise comparison of the mean annual LAI (a) and as a            overlap between CARDAMOM’s 90 % CI and the spread
Brazil-wide average time series highlighting the long-term trend of       of estimates from the CTE ensemble across > 90 % of time
increasing LAI (c). The colours of the lines shown in panel (c) rep-      steps with CTE estimates. Moreover, both CTE and DALEC
resent the different models matches that are shown in the legend in       models indicate a long-term decreasing trend in NBE (i.e. in-
panel (a).
                                                                          creasing net carbon uptake) (Fig. 5). While statistically con-
                                                                          sistent, there is a persistent negative bias between DALEC
                                                                          and CTE (i.e. DALEC models estimate a large sink over the
Caatinga (deviations up to −0.25). M1 shows no substan-                   whole time period, while CTE transitions from a small source
tial spatial patterning (ACM1, no water cycle). The inter-                to small sink) over the Amazon (M1–5; Fig. A8). This Ama-
model differences follow the switching between photosyn-                  zon bias leads to the DALEC models consistently estimat-
thesis models and the inclusion of the water cycle, indicating            ing Brazil’s NBE to range between −2.3 and −1.8 Pg C yr−1 ,
that drought stress has a significant impact on Ra : GPP (Ta-             which contrasts the near-neutral 0.014 Pg C yr−1 estimated
ble 1).                                                                   by CTE (2001–2017; Table 2). However, both the CTE
   The reduction of parameter uncertainty between the 90 %                ensemble and DALEC uncertainties cross the source–sink
confidence interval and the prior range is highly vari-                   boundary, indicating that neither analysis can confidently
able across Brazil, between parameters and to a lesser ex-                quantify Brazil as a net source or sink overall for 2009–2017
tent models (Tables A2 and A3, Fig. A7). The reduction                    (Fig. 5; Table 2).

Earth Syst. Dynam., 12, 1191–1237, 2021                                                      https://doi.org/10.5194/esd-12-1191-2021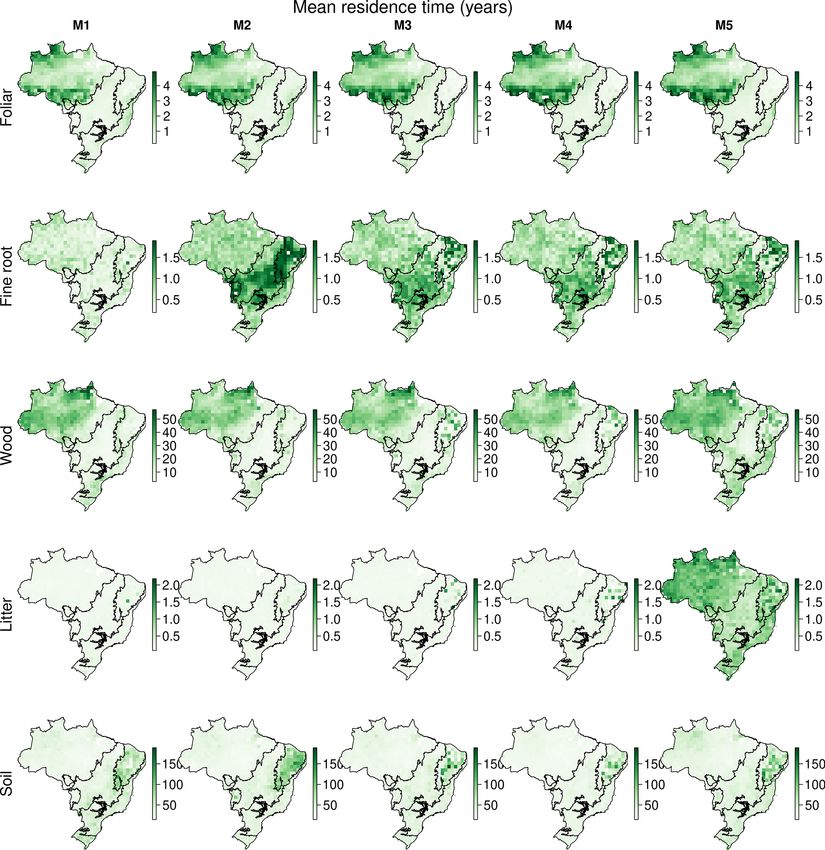
T. L. Smallman et al.: Parameter uncertainty dominates C-cycle forecast errors across Brazil 1199
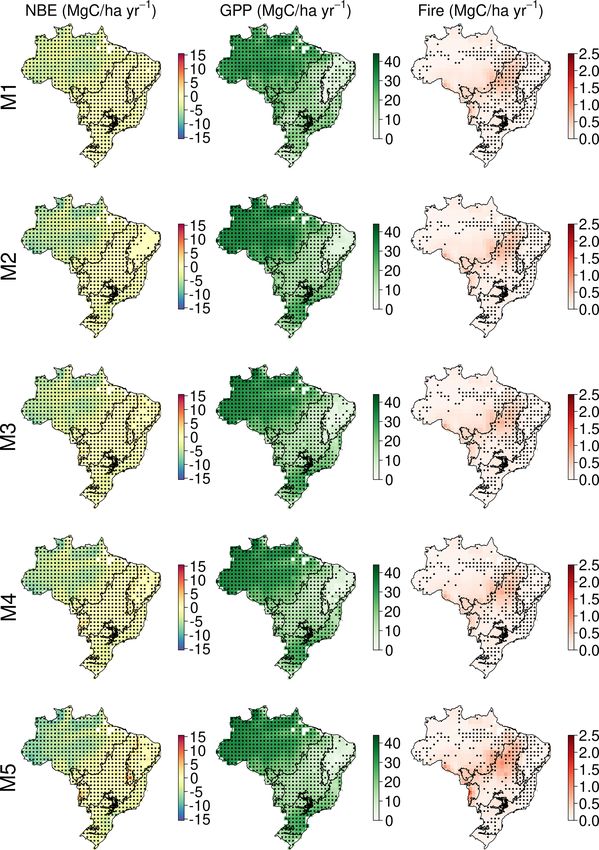
Figure 4. Comparison of DALEC model M1–5 estimated NBE
and GPP with independent estimates of NEE from Carbon-
Tracker Europe (2009–2017), GPP (2001–2017) from FLUX- Figure 5. Time series comparison showing the carbon budget for
COM/FluxSatv2/Copernicus and fire (2003–2016) GFEDv4.1s and Brazil as estimated by CARDAMOM for each version of DALEC
GFAS. Stippling shows areas where the 90 % confidence interval using the pixel-level median estimates. Independent data, where
derived from DALEC analysis overlaps with the independent value. available, are shown as a single solid line. The shaded areas denote
the maximum range the independent estimate for CTE (blue), the
maximum range between FLUXCOM, Copernicus and FluxSat v2
(orange), and the range between GFEDv4.1s and GFAS fire emis-
sions estimates (purple).
The DALEC models are consistent with independent GPP
at the 90 % CI across 93 %–97 % of Brazil (Fig. 4). Inter-
model variation follows the implementation of the differing of 7 % but varies substantially in space with declines across
photosynthesis models and inclusion of carbon–water cy- the Cerrado and Caatinga of ∼ 30 %.
cle interactions. The simplest model, M1 (ACM1, no wa- Brazil’s mean annual GPP estimated by the DALEC mod-
ter cycle; 97 %), was the most consistent with independent els (17.7–19.0 Pg C yr−1 ) encompasses the range of inde-
estimates; followed by M2 (ACM2, no water cycle; 94 %). pendent estimates (18.4–20.9 Pg C yr−1 ) as do the model-
M3–5, which use ACM2 and simulate water cycling, are specific uncertainties (Table 2). All DALEC models es-
least consistent (∼ 93 %) over Brazil. The non-consistent timated Brazil’s mean annual GPP to increase between
areas for all models are concentrated in the Caatinga and 2001 and 2017 (∼ 0.15 Mg C ha−1 yr−2 ), while respiration
Cerrado (Fig. 4), which have strong seasonality in rainfall increased by roughly half that of GPP (Figs. 5 and A9).
and more extreme temperatures (Fig. A2). Moreover, the The net change between GPP and respiration is con-
DALEC models all estimate a lower GPP for these regions sistent with the trend of declining NBE estimated by
(by ∼ 5 Mg C ha−1 yr−1 ) than independent estimates, sug- both DALEC (−0.038 to −0.06 Mg C ha−1 yr−2 ) and CTE
gesting different high temperature and drought sensitivities (−0.032 Mg C ha−1 yr−2 ; Fig. 5). However, the increasing
between analyses (Fig. A8). The activation of water cycling GPP trend is not uniform, with GPP declining in the Cer-
between M2 and M3–5 reduces Brazil’s GPP by an average rado and Caatinga (range ± 0.45 Mg C ha−1 yr−2 ; Fig. A9).
https://doi.org/10.5194/esd-12-1191-2021 Earth Syst. Dynam., 12, 1191–1237, 2021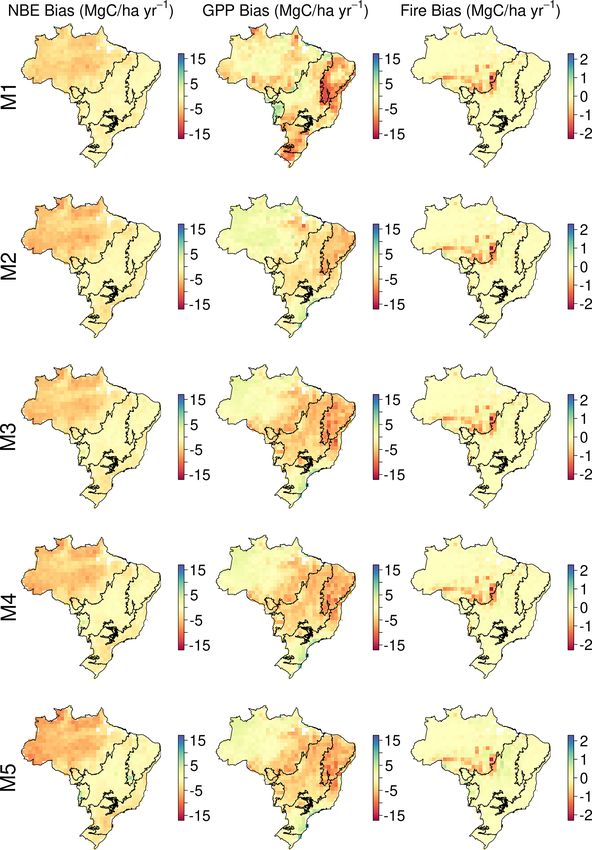
1200                           T. L. Smallman et al.: Parameter uncertainty dominates C-cycle forecast errors across Brazil

Independent estimates of GPP are in agreement with the sign        Fig. A13). Moreover, our analysis allows us to partition MRT
of the GPP trend across most of Brazil (i.e. the Cerrado,          into its constituent drivers, i.e. natural, fire and biomass re-
Caatinga, Atlantic Forest, Pampas and Pantanal). The Ama-          moval, which indicates that given currently available driver
zon is the exception which is consistently estimated to re-        disturbance is only a major determinant of MRT across the
main constant or declining GPP, which contrasts the DALEC          Amazon–Cerrado boundary (Fig. A14). All five models esti-
estimates.                                                         mate similar mean Brazil-wide partitioning of NPP to plant
   DALEC-estimated fire emissions show large interannual           tissue. The MRT of the foliar pool is best constrained across
variation between ∼ 100 and ∼ 300 Tg C yr−1 , reducing the         models, consistently estimated to be ∼ 1.5 years with an un-
annual net C uptake by 3 %–30 % over this period (Fig. 5).         certainty ranging between 84–116 d. The MRT of fine roots
At the 90 % CI, the DALEC models are consistent with               increases by 67 %–101 % between M1, which uses ACM1
GFEDv4.1s and GFAS fire emissions estimates over 41 %–             and M2–5, which use ACM2. A key feature of ACM2 is the
47 % of Brazil (Fig. 4). DALEC has, however, a per-                inclusion of fine roots in determining potential water sup-
sistent low bias (∼ 2 Mg C ha−1 yr−1 ) across the bound-           ply to the canopy underpinning stomatal conductance. Wood
ary between the Amazon and the Cerrado (Fig. A8). Spa-             MRT, while associated with large uncertainty (∼ 50 years),
tial consistency is greatest in M1 (47 %) and M4 (45 %),           is consistently estimated to be 15–16 years for M1–4. In M5,
whereas a comparison of total fire emissions shows that            with the inclusion of the wood litter pool, median wood MRT
M1–4 estimates are substantially lower than either GFAS            increased by 25 % to 21 years. No significant impacts on
(mean of 65–69 Tg C yr−1 ) or GFEDv4.1s (mean of 92–               mean estimates or uncertainty of litter or soil MRT are noted.
96 Tg C yr−1 ) (Fig. 5), and M5 estimates, while still lower          These analyses show clear spatial patterning both between
than GFAS (mean of 13 Tg C yr−1 ) or GFEDv4.1s (mean of            and within biomes in the estimates of NPP (Fig. A12) and
41 Tg C yr−1 ), fall between the independent estimates in 11       MRT (Fig. A13). Spatial patterns of NPP allocation are sim-
of 15 years in which these datasets overlap (Fig. 5). Despite      ilar between models, except M2, which has several notable
the improvement in estimation of C emissions due to fire,          differences in the Cerrado and Caatinga. All models estimate
there is no corresponding improvement in NEE or NBE due            the fraction of NPP allocated to foliage across the Amazon,
to compensating changes in both autotrophic and plant res-         Atlantic Forest, Pantanal and Pampas to be relatively low
piration (Table 2). This result highlights the need for greater    at 0.1–0.2 with a larger fractional allocation (0.3–0.5) esti-
overall constraint on the C cycle, for instance, independent       mated across the Cerrado and Caatinga. The change in foliar
estimates of respiratory fluxes. DALEC-estimated C losses          allocation is compensated for in the allocation to fine roots,
due to forest biomass removals from GFW show substan-              where models M1 and 3–5 estimate the fractional allocation
tial interannual variation (120–400 Tg C yr−1 ) reducing net       to fine roots across Brazil to be 0.5–0.6 except in the Cer-
uptake by 5 %–32 % (Fig. A11). For further details, see Ap-        rado and Caatinga, which have a lower fractional allocation
pendix B.                                                          at ∼ 0.4. M2 estimated a similar spatial pattern and magni-
                                                                   tude of fine root allocation except over the Cerrado and espe-
3.3    Constraints on Brazilian C cycling
                                                                   cially the Caatinga, which is estimated to have a larger allo-
                                                                   cation fraction of up to 0.8. The larger fractional allocation to
Simulated NBE (NEE + fire) is dominated by wood stock              fine roots comes as a trade-off with allocation to wood lead-
dynamics. Variation in wood stock dynamics explains 85 %–          ing to very low wood allocation fractions across the Cerrado
93 % of variation of simulated NBE, while variation in soil        and Caatinga (< 0.15).
stock dynamics explains 1 %–18 % (Fig. A6). Carbon dy-                There are substantial variations between models in es-
namics of wood, not soil, is the primary driver of net ex-         timated MRTs, in addition to biome-level differences
change. Using the per-model 1◦ resolution parameter ensem-         (Fig. A13). MRTroot shows the greatest between-model vari-
bles provides quantification across Brazil of whether a given      ation with short (< 1 year) MRTs estimates across the ma-
1◦ pixel is a net source or sink of carbon, i.e. the sign of NBE   jority of Brazil (i.e. little biome-level variation) in M1 but
(Fig. A6). At the 90 % confidence interval, our analyses indi-     longer MRT in all other models (1–2 years). Models M2–
cate there is currently insufficient observational constraint to   5 have larger biome-level variability in MRT, with longer
confidently determine the sign of NBE or soil C dynamics.          (> 1 year) MRTroot in the drier Cerrado and Caatinga regions
The same was largely true for wood stock dynamics, except          compared to other biomes. In models M1–4, MRTwood is
that the sign of wood stock trajectories could be confidently      ∼ 10 years across much of Brazil, except the Amazon, which
determined for ∼ 5 % of Brazil’s land area after the inclu-        has MRTs of up to 50 years but notable short MRT along the
sion of the water cycle increasing to 11 % on the inclusion        boundary of with the Cerrado (i.e. the arc of deforestation).
of a wood litter pool. The areas of statistical confidence are     Longer residence times were estimated across parts of the
concentrated in the Cerrado (Fig. A6).                             Caatinga in M3–5, likely linked to the inclusion of the water
   The CARDAMOM analyses provide spatially explicit es-            cycle in these models. In M5, where an explicit wood litter
timates of critical ecosystem traits such as the allocation of     pool is included, MRTwood increased in the southern Cerrado
NPP to live tissue (Fig. A12) and carbon stock MRT (Table 3,       and Atlantic Forest from < 10 years to > 10 years. Finally,

Earth Syst. Dynam., 12, 1191–1237, 2021                                              https://doi.org/10.5194/esd-12-1191-2021
T. L. Smallman et al.: Parameter uncertainty dominates C-cycle forecast errors across Brazil 1201
Table 3. Mean Brazilian C-cycle NPP allocation fractions and MRTs (years) calculated with five different model structures (M1–5). The
Brazil-wide mean is calculated from the median pixel-level estimates, with the equivalent estimates for the 5 % and 95 % quantiles in
parentheses denoting the 90 % confidence interval. Note that litter in M5 includes the additional wood litter pool.
M1 M2 M3 M4 M5
NPP Foliage 0.22 (0.09/0.41) 0.21 (0.1/0.38) 0.21 (0.1/0.38) 0.18 (0.09/0.32) 0.19 (0.10/0.33)
Fine root 0.47 (0.20/0.73) 0.52 (0.26/0.74) 0.48 (0.22/0.71) 0.46 (0.21/0.69) 0.43 (0.19/0.67)
Wood 0.28 (0.1/0.55) 0.25 (0.1/0.49) 0.29 (0.1/0.54) 0.28 (0.1/0.53) 0.30 (0.1/0.54)
MRT Foliage 1.3 (0.6/2.3) 1.5 (0.8/2.4) 1.5 (0.8/2.4) 1.6 (0.9/2.4) 1.5 (0.8/2.4)
Fine root 0.48 (0.19/1.7) 1.0 (0.39/1.85) 0.86 (0.3/1.8) 0.82 (0.29/1.8) 0.80 (0.29/1.8)
Wood 16.3 (5.6/58.7) 15.2 (5.5/51.8) 15.5 (5.8/50.5) 14.9 (5.6/49.3) 21 (7.0/58.6)
Litter 0.18 (0.08/1.5) 0.18 (0.08/1.4) 0.18 (0.07/1.3) 0.24 (0.1/2.8) 0.96 (0.29/3.4)
Soil 36.0 (10.3/146) 36.2 (11.0/131.3) 33.2 (10.3/120) 27.8 (9.5/73.6) 38.4 (12.2/110.3)
considered to be the central pathway, and the model average
response for each of the four scenarios (O’Neill et al., 2016).
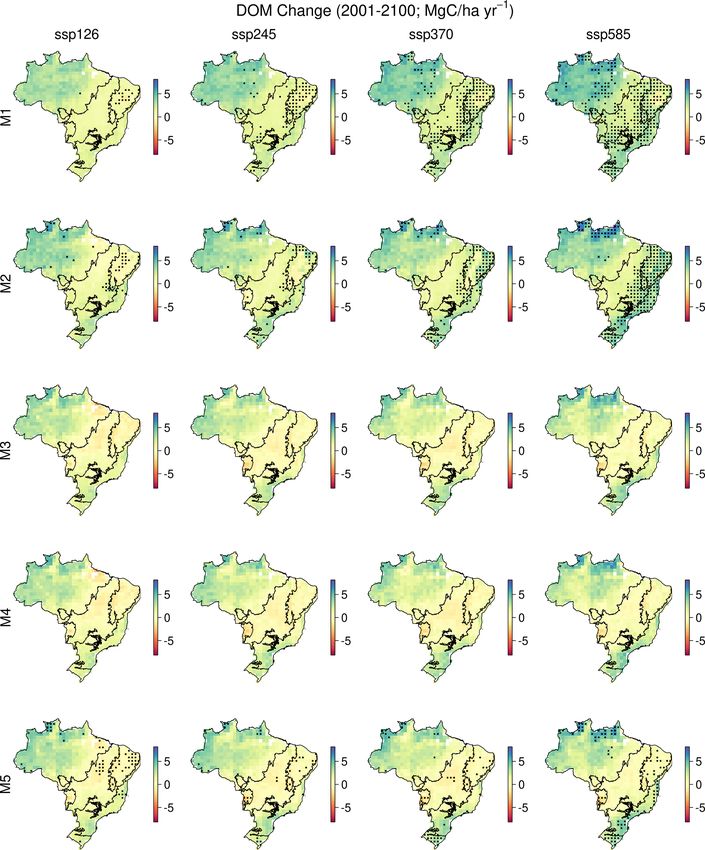
The median forecasts of all DALEC models simulated a
net increase of biomass and DOM by 2100 under the SSP2-
4.5 W m−2 climate change scenario (Figs. 6 and A3). M1–
2 and M5 simulated a larger C accumulation (∼ 75 Pg C),
while M3–4 simulate a smaller increase (∼ 40 Pg C). The
90 % CI (i.e. the 5 %–95 % quantiles) is greater than the me-
dian predicted accumulation for each model, therefore cross-
ing the source–sink boundary for the next century in all cases
(Fig. 6). Using our ensemble-based approach, we estimate
that the likelihood of a net increase of C in biomass by 2100
is 73 %–85 %, while the likelihood of a net accumulation in
DOM is 64 %–84 % (Table A6). C accumulation is simulated
to be most likely concentrated in the Amazon and to a lesser
Figure 6. Simulated Brazil-wide total stock change between 2001 degree the Atlantic Forest (e.g. M5). However, only across
and 2100 for biomass (labile, foliar, fine root and wood) and dead the Caatinga does our analysis estimate confidence in the
organic matter (DOM; litter, wood litter (M5 only) and soil). The sign of C accumulation with > 90 % confidence as either a
left column shows each model for the SSP2-4.5 W m−2 climate sce- small source or sink (Figs. A15 and A16).
nario, while the right column shows the DALEC suite mean for each
The analyses indicate that live biomass and DOM stocks
climate scenario. Median estimates are shown using a solid line,
will most likely increase under each climate change scenario
while the dashed lines indicate the 90 % confidence interval. Note
that uncertainties were propagated from the pixel level to Brazil- (Fig. 6). Median C accumulation under SSP1-2.6 W m−2
wide totals assuming fully correlated uncertainties. plateaus by 2080 before turning into a carbon source by 2100
(i.e. begins losing its accumulated carbon), while all other
scenarios continue to accumulate carbon to 2100. As ex-
the estimate of the combined litter (i.e. foliar, fine root and pected, accumulation of DOM lags behind that of biomass, as
wood) MRT in model M5 was greater across Brazil than in turnover of biomass provides inputs to DOM in the models.
other models due to the explicit inclusion of slowly decom- Analysis uncertainty is larger than the mean predicted accu-
posing wood litter. mulation for all scenarios, with the lower bound of the 90 %
CI indicating a possible net loss of carbon for the next cen-
tury. The spatial variation in carbon source–sink distribution
3.4 Quantifying uncertainty in the future Brazilian C indicated for SSP2-4.5 W m−2 is consistent for each scenario
cycle (Figs. A15 and A16).
3.4.1 Future Brazilian carbon stocks
3.4.2 Partitioning uncertainty: parameter, model
The calibrated DALEC models were simulated under four structure and climate change scenario
climate change scenarios to estimate changes in biomass and
DOM between 2001 and 2100 (Fig. 6). We assess the model- Across Brazil for forecasts of live biomass and DOM change
specific behaviour under scenario SSP2-4.5 W m−2 , which is to 2100, the largest proportion of uncertainty is derived from
https://doi.org/10.5194/esd-12-1191-2021 Earth Syst. Dynam., 12, 1191–1237, 20211202 T. L. Smallman et al.: Parameter uncertainty dominates C-cycle forecast errors across Brazil
Figure 7. Quantification of the relative contribution of model parameter (top row), structural (middle row) and climate change scenario (lower
row) uncertainties on the simulated Brazilian carbon cycle in 2100 at 1◦ resolution. Carbon cycle components shown in columns as the live
biomass (Bio) and DOM stocks in 2100, and their change between 2017 and 2100. The colour bar indicates the fractional contributions.
parameters (biomass of 0.62, DOM of 0.68), followed by 3.4.3 Quantifying the determinants of future carbon
model structure (biomass of 0.21, DOM of 0.24), with the re- stock change
mainder due to climate change scenario uncertainty (biomass
of 0.16, DOM of 0.18) (Fig. 7). However, there were impor- Our analysis highlights substantial differences in the mag-
tant spatial variations in uncertainty contributions both be- nitude and spatial variation of correlations between ecosys-
tween and within biomes. Parameter uncertainty was on av- tem variables for both biomass (Figs. 8 and A18) and DOM
erage the largest across the Amazon (biomass of 0.74, DOM (Figs. 9 and A19). Overall, both simulated biomass and
of 0.72) and Atlantic Forest (biomass of 0.71, DOM of 0.66), DOM change are most strongly correlated with NPPwood ,
with smaller contributions in the Cerrado (biomass of 0.64, MRTwood and MRTsoil , with only small variations in this pat-
DOM of 0.52) and Caatinga (biomass of 0.49, DOM of 0.38; tern among models.
Fig. 7). Structural uncertainty follows the inverse spatial pat- On average, MRTwood (r of 0.57) is the most important
tern, contributing its largest component (though still smaller correlate with biomass change, followed by NPPwood (r of
than parameters) across the Cerrado (biomass of 0.20, DOM 0.31), MRTsoil (r of 0.27; Fig. 8) and GPP (r of 0.25). There
of 0.30) and Caatinga (biomass of 0.29, DOM of 0.36). Un- is substantial spatial variation with NPPwood being the dom-
certainty due to climate change scenarios was relatively large inant correlate in 12 %–29 % of pixels (between-model vari-
in the Cerrado and Caatinga (0.11–0.26) but was still the mi- ation). MRTwood is strongly correlated with biomass change
nority contribution in all cases. Moreover, in absolute uncer- (r > 0.9) across most of Brazil, except the Amazon and iso-
tainty terms, structural (range of 0.4–1.0 Mg C ha−1 ) and cli- lated areas of the Cerrado and Caatinga where the correla-
mate change (range of 0.3–0.7 Mg C ha−1 ) uncertainties vary tion coefficient declines (r < | 0.25 |). In contrast, NPPwood
relatively little compared to parameter uncertainty (range of is the process most strongly correlated with biomass in the
0.9–4.9 Mg C ha−1 ), which has its largest absolute uncertain- Caatinga and parts of the Amazon, consistent for all models.
ties across the Amazon and Atlantic forests with smaller val- There are some between-model differences indicating varied
ues over the Cerrado and Caatinga (Fig. A17). sensitivity to ecosystem variables (Fig. 8). For example, GPP
becomes on average an increasingly important correlate as
model complexity increases (from M1 of 0.16 to M5 of 0.30),
potentially in response to the implementation of drought im-
Earth Syst. Dynam., 12, 1191–1237, 2021 https://doi.org/10.5194/esd-12-1191-2021You can also read