Petrological study of the Iraty Formation Shale Rocks from Paraná Basin, Limeira, São Paulo.
←
→
Page content transcription
If your browser does not render page correctly, please read the page content below
BRAZILIAN JOURNAL
                                                  OF
                                            RADIATION SCIENCES
       BJRS                                        09-01A (2021) 01-17

     Petrological study of the Iraty Formation Shale Rocks
            from Paraná Basin, Limeira, São Paulo.

      Bernardesa T. L. S., Amadeua R. A., Santosa R. S., Garciaa R. H. L., Veloa A. F.,
                               Cavallarob F. A., Mesquita C. H., Hamadaa M. M
           a
               Instituto de Pesquisas Energéticas e Nucleares (IPEN/CNEN-SP), 05508-000, São Paulo-SP, Brazil
                                                 thiagolsbernardes@gmail.com
                       b
                           Universidade Cidade de São Paulo (UNICID), 03071-000, São Paulo-SP, Brazil
                                                  assiscavallaro@gmail.com

ABSTRACT

Shales are fine-grained rocks formed by clays and silt-sized particles in thin, relatively impermeable layers. They are
originated from rocks that suffered weathering and erosion and their composition is quite variable. When oil
production declines, interest arises to improve the understanding of the physicochemical properties of unconventional
rocks, like shale. For the characterization of the shale samples of the Iraty Formation, the gamma-ray computed
industrial tomography technique has been proposed to be used as an alternative to obtaining information about each
element present in the mineral, the pore distribution, through the shale morphology. The tomographic results were
compared with those obtained by conventional methodologies used in the petrological analysis, such as scanning
electron microscopy (SEM), x-ray fluorescence, and x-ray diffraction.

Keywords: shale rock, rock morphology, gamma-ray tomography.

ISSN: 2319-0612
Accepted: 2020-12-30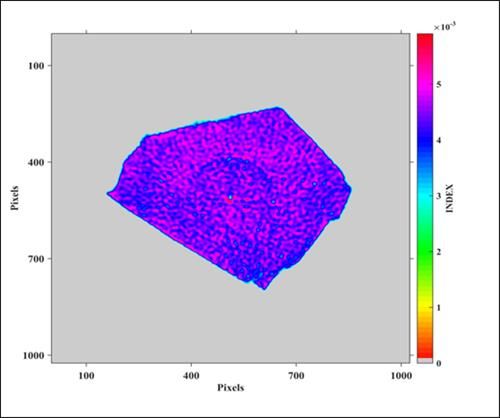
Bernardes et al. ● Braz. J. Rad. Sci. ● 2021                         2

    1. INTRODUCTION

    In the current world scenario, there is a growing demand for energy resources, due to the accelerated
development of technology and means of production. One of the main raw materials that drive this cycle
is oil, but in a few years, the conventional resources for its production will no longer be able to
correspond to that increase. For this reason, the study and exploration of non-conventional resources
become necessary. Thus, studying shale reservoirs are on the agenda because they are rocks with great
potential as oil reservoirs. [1, 2]
    Shales are one of the most abundant sedimentary rocks found in sedimentary basins [1]. Brazil is
classified by the IEA (International Energy Agency) as the 10th shale gas reserve in the world, with
about 245 trillion cubic feet of recoverable shale gas resources, behind countries such as China, the
United States, and Argentina [2]. These rocks are formed by the consolidation of silt, mud, or clay,
presenting a very thin granulometry. Their chemical composition is quite varied, according to the
geomorphology of the place where they have been formed, however, even when this variation is present,
shales are rich organic matter rocks when compared to rocks of other types, and they may be a great
source of hydrocarbons (HC) [3]. Thus, the study and the exploitation of the shale reservoirs are of great
economic interest in the countries.
    The deposits of known shales in the world vary from Cambrian to Tertiary period and may be found
in several depositional environments such as marshes, marine basins, freshwater lakes, saline lakes, as
well as in coastal zones. In Brazil, at least nine deposits of oil shale from the Devonian to Tertiary
period have been reported. These deposits may contain little organic matter, being of low economic
value and without much interest in their study, or they may contain enormous amounts of oil, attracting
attention to their exploitation [4].
    Although there are other sources of cheaper energy and a greater focus on investment in other areas,
like mining, the shale may represent a very important resource. According to studies in some countries,
standing out among them Germany, China, Israel, Estonia, and even Brazil, it is shown that besides oil
and gas, it is possible to obtain other resources from these reservoirs, such as electricity, heat, cement,
chemicals, and others. All of them present reasonable prices, allowing competitiveness in the market, in
addition to an increase in the generation of jobs in various sectors [5].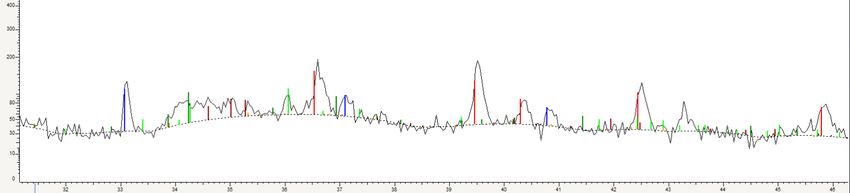
Bernardes et al. ● Braz. J. Rad. Sci. ● 2021                             3

   The reservoir rocks are those that have good porosity and permeability, propitious to keep oil, gas,
and/or water. These fluids are retained in the interstices of the rocks. Therefore, greater and better
knowledge about the physical properties of these rocks is necessary. Among these properties, it can be
quoted: (a) the filling of fluids in their pores, (b) their stratigraphy, and (c) their internal geometry are
the most important, having a fundamental role in increasing the recovery factor of hydrocarbons. There
is, already, a great deal of information about rocks such as sandstones and carbonates, which are the
most common types of reservoir rocks. Also, unconventional reservoirs, such as the bituminous shales,
are found. Yet, the porosity and permeability properties of shales as reservoir rocks are still little known.
These properties, compared to conventional reservoirs (sandstones and carbonates), are more complex.
   Thus, the more information is collected, the more tools engineers and other professionals involved
will have so that their work may be improved. With this knowledge in hand, there may be optimization
in the extraction of the desired material, as previously mentioned, besides a reduction in the time of the
operations and the final costs involved.
   The shale samples analyzed in this work were collected from the surrounds of Limeira, in the
countryside of São Paulo. Because they are rocks that have impermeable structures, formed by the
consolidation of clay in layers with thin laminations, differently from the structures usually explored,
deeper characterization is necessary. The rock samples were assessed using the Scanning Electron
Microscopy (SEM), X-Ray Fluorescence, and X-Ray Diffraction techniques, conventionally used in
petrophysical analyzes. Additionally, an alternative technique for the characterization of the shale rock
was proposed using the gamma-ray Industrial Tomography system developed in our laboratory. This
technique characterizes rock microstructures through high-resolution images. It is a non-destructive
technique and it has the advantage of not requiring preparing the sample and can measure the rock in its
original form, in different dimensions and shapes. As far as it is known, a study on the methodology for
characterizing shale rocks using gamma-ray tomography has not been found in the literature.
Bernardes et al. ● Braz. J. Rad. Sci. ● 2021                          4

   2. MATERIALS AND METHODS

   Samples of shale rock containing hydrocarbons in their pores were found in the city of Limeira, in
the interior of São Paulo, at the coordinates (22º32'47 "S - 47º26'33" W). Specific petrographic hammers
and mallets were used for fieldwork on outcrops (rocks exposed to the surface). The shale samples were
analyzed using X-Ray Diffraction (XRD), X-Ray Fluorescence, Scanning Electron Microscopy (SEM)
with and without the use of energy dispersive spectroscopy (DES) and Gamma-Ray Industrial Process
Tomography.

   2.1. Sample preparation
   Previously, the shale samples were prepared for use in analytical measurements. For the
fluorescence technique measurements, the shale rock was pulverized and, then, 0.009 kg of powdered
shale was mixed with 0.001 kg of microcrystalline wax, which was pressed as a tablet in a 0.036 m
diameter matrix, for analysis. For use in the electron microscopy technique, the powdered shale samples
were dispersed in carbon adhesive and covered with carbon, to be inserted in the equipment sample
holder. For the X-ray diffractometry technique, powder samples were added to the glass sample holder.
In the tomography technique, the collected shale sample has been used without requiring prior
preparation, only adjusting the sample on the tomograph carefully so that the entire structure is in the
path of the radiation beam and no "edge" is omitted from the measurements.

   2.2. X-ray fluorescence
    The X-ray fluorescence technique is very useful for the detection and quantification of heavy
metals, based on the measurement of the characteristic X-ray intensities that are emitted by the chemical
elements contained in the sample. The mode of operation of this technique consists of the use of a
source of controlled excitation, to cause an increase in the agitation of the molecules of the atoms
present in the analyzed substances, obtaining a fluorescence emission spectrum characteristic of the
chemical elements present in the sample. The source used may be an alpha or gamma particle from
radioactive sources or even a bundle of charged particles from accelerators or X-ray tubes. After the
molecules are excited, the atom absorbs a large amount of energy and moves to an unstable state,
Bernardes et al. ● Braz. J. Rad. Sci. ● 2021 5 causing some transition to its electrons between the energetic layers (layers L and M to layer K, layers M and N to layer L and/or in outer layers). Due to these movements among layers, characteristic spectra of the elements are emitted and may be measured qualitatively and quantitatively [6,7]. The X-ray luorescence equipment used to carry out the measurements was the EDX-900HS model, from the SHIMADZU brand. 2.3. X-ray diffraction X-ray diffraction is a rapid analysis technique most often used to identify the crystalline phase of the rock. The equipment used, the diffractometer, consists of three basic elements: an X-ray emitter tube, an X-ray detector and a holder for the sample to be placed. For the execution of this technique, the sample of interest is placed in the support where it will be bombarded by fast electron beams. A cathode ray emitter tube will emit X-rays to heat a filament; electrons are produced and, then, accelerated toward the target of interest. When the emitted electrons reach enough energy to remove the electrons present in the target material, electronic transitions will start in the energetic layers of the sample and a single-layer electron will be pulled out; when it is filled again, there will be an emission of radiation with a length of the characteristic wave of this transition (diffracted rays). As the sample and the detector are rotated, the intensity of the reflected X-rays is recorded, being the ratio between the angle that the electrons were bombarded and collected the most important component of the diffraction. When the geometry of the incident X-rays contemplates the Bragg Equation (nλ = 2d sin θ), there is constructive interference and a peak of intensity is generated. This signal is collected and processed by a detector that sends it to the equipment, where it may be seen or printed. The instrument that is used to hold the angle and rotate the sample is called a goniometer; this sample rotates in the path of the X-ray beam at an angle θ, while the detector rotates at an angle of 2θ [8,9]. The X-ray diffraction equipment used to carry out the measurements was the BRUKER D8 Advanced 3kW diffractometer, equipped with a copper radiation tube, 0.25 m goniometer, a graphite monochromator, and a scintillation detector. 2.4. Scanning electron microscope (SEM) To evaluate the morphology, topography, and elemental chemical composition of the shale, a scanning electron microscope was used to observe the homogeneity and the structural quality with high
Bernardes et al. ● Braz. J. Rad. Sci. ● 2021                            6

resolution (magnification of 10-20.000X), having a scale with order values of 2 to 5 nanometers (20-
50Aº). The principle of a scanning electron microscope consists in the use of a beam of small diameter
electrons, incident on the surface of the sample, for the production of electrons and photons, which may
be collected by suitable detectors and, subsequently, converted into a signal of video. Later, this signal is
transmitted to a cathode screen with scanning perfectly synchronized with that of the incident beam. To
be detected, the electromagnetic rays resulting from this interaction between the beam and the sample
have to be returned to the detector. Their results are influenced by the intensity of the particle energy
incident on the detector or captured by the detector. Most of these instruments used, such as a source of
electrons and a heated tungsten (W) filament, operate in a range of 1 to 50 kV acceleration voltages
[10].
    The great advantage of SEM over other types of microscopes is the possibility of combining a
microstructural analysis with a chemical microanalysis, as well as enabling the generation of images
with a large focus and a three-dimensional appearance [10, 11]. The dispersive energy spectroscopy
(DES) analysis was also used and is a very important tool of this SEM, since it allows the
characterization of metallic and semiconductor materials, identifying the composition of the sample,
even if qualitatively, in specific points of the image [11]. In this study, the equipment used for the
analyzes was the scanning electron microscope LX-30, from Philips.

    2.5. Gamma-ray industrial tomography
    The industrial tomography used in this work consists of the transmission of gamma rays through a
heterogeneous medium, accompanied by attenuation, which will provide the integral measure of the
mass distribution line, through the path traveled by the beam. The measurement of several beams with a
different orientation, both spatial and angular concerning the studied volume, followed by an image
reconstruction process, provides the density distribution of the phases with a high degree of spatial
resolution [12]. With this technique, it is possible to generate images that are not influenced by the
external structure, being able to obtain detailed information on the internal structure of the object of
interest [13].
    For the characterization of these shale rock samples, tomography measurements were carried out
using a third-generation computed tomography developed at IPEN/CNEN-SP [14,15]. This system
Bernardes et al. ● Braz. J. Rad. Sci. ● 2021 7
comprised eight NaI(Tl) detectors of 25 x 50 mm2 (diameter, thickness) shielded with lead and 192
Ir
radioactive source, with an activity of 7.4 GBq (200 mCi), placed into a radioactive shield-case, with an
aperture angle of 36 degrees. The eight NaI(Tl) detectors were placed on a gantry in fan-beam geometry,
192
opposite to a radioactive shield-case containing Ir gamma-ray source. The eight detectors were
individually collimated with lead-containing septa of 2 x 5 x 50 mm3 (width, height, depth). The
movement of the detector and radioactive source assembly is controlled by a stepper motor, which
rotates one degree forward, and this process goes on up to complete 360 degrees, totalizing 360
projections. The counting time for sampling was 6 seconds. This system was, previously, described by
Mesquita et al [14,15]. The image was reconstructed using Filtered Back Projection (FBP), in the grid
matrix of 512 x 512 [15].
3. RESULTS AND DISCUSSION
The composition of the elements present in the shale rock was estimated semi-quantitatively by
the X-ray fluorescence technique. The elements found by this technique in the shale sample are
presented in Table 1. As it may be observed, the main element constituting this sample is SiO2
(22.4%), followed by other elements, such as Fe2O3 (5.9%), MgO (5.6%), and CaO (6,0%), with
very close concentrations among them. Also, elements with lower concentrations, called trace
elements (concentration below 1%), such as Na2O (0.3%), SrO (0.2%), P2O5 and BaO (0.1%) were
found.Bernardes et al. ● Braz. J. Rad. Sci. ● 2021 8
Table 1: Concentration of the elements present in the shale, by the fluorescence method
Z Element Oxide Concentration
14 Silicon SiO2 22.4%
26 Iron Fe2O3 5.9%
12 Magnesium MgO 5.6%
20 Calcium CaO 4.6%
13 Aluminum Al2O3 2.6%
16 Sulfur SO3 1.2%
19 Potassium K2O 1.1%
11 Sodium Na2O 0.3%
22 Titanium TiO2 0.3%
38 Strontium SrO 0.2%
15 Phosphorus P2O5 0.1%
25 Manganese MnO 0.1%
36 Barium BaO 0.1%
In the diffractogram of the shale sample shown in Figure 1, several intensity peaks were observed:
however, only three of these peaks stand out with higher values. Figures 2 and 3 show diffractograms
with the patterns of elements from the EVA database, used as a parameter to identify the elements
present in the sample. From the analysis of these diffractograms, specifically at higher intensity peaks, it
may be stated that the element with the highest concentration is quartz, highlighted with red circles in
Figure 1. At lower intensity peaks from the standard diffractogram (Fig. 2), it is possible to observe the
presence of pyrite (FeS2) in the blue line and some silicates, such as Calcium Silicate (Ca2SiO4) and
Potassium, Magnesium Aluminum Silicate (KMg2AlSi4O12), traced in light and dark green lines,
respectively, in Figures 2 and 3. These peaks are pointed out with a green circle in Figure 1.
From the results of X-ray fluorescence and X-ray diffraction, it may be stated that both show similar
results to the chemical composition present in the sample.Bernardes et al. ● Braz. J. Rad. Sci. ● 2021 9 Figure 1: Diffractogram of the shale sample.
Bernardes et al. ● Braz. J. Rad. Sci. ● 2021                         10

Figure 2: Diffractogram with the patterns of elements and peak of the shale overlapped (black line).

Figure 3: Diffractogram with the patterns of elements and peak of the shale overlapped (black line).

     In the images obtained by the scanning electron microscope technique, it was possible to observe
 that the sample is composed of a fine granulation, characteristic of the shales, with grains dispersed
Bernardes et al. ● Braz. J. Rad. Sci. ● 2021 11
as it may be seen in Figure 4 (a), increasing by 1000 times its normal size and Figure 4(b),
increasing by 2500 times. As it may be observed in these images, apparently there is no
cementation, thus, several void spaces are present, which confers to this rock the condition for
storing hydrocarbons. From these images, it is, also, possible to notice that the structure of the grains
does not follow a defined pattern, with grains of several formats (sub-angular, rounded, sub-
rounded).
(a) (b)
Figure 4: Shale structure images increased by 1000 (a), and 2500 (b) times.
The images of the grain surface in this sample, magnified 100 and 500 times, are shown in Figure 5.
As observed in these figures, the images exhibit two contrasting gray colors, a lighter shade, and a
darker tone. This signal contrast may be an indication of the differences in the composition of the shale
grains, light areas indicating grains with high atomic numbers and dark areas, grains with low atomic
numbers. This fact suggests that the lighter area is the rock matrix, mainly composed of SiO2, similar to
what was found by the other techniques studied in this work. The dark area represents the hydrocarbon
present inside.
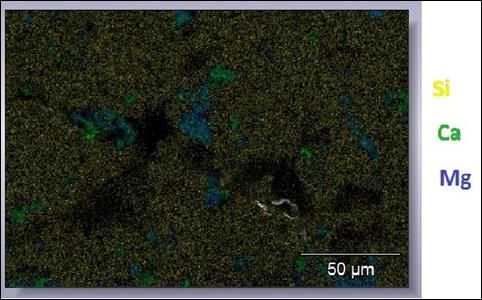
Using the dispersive energy spectroscopy tool, with the image shown in Figure 6, it was possible to
identify, in the sample, the presence of silicon elements (yellow color) in greater quantity and calcium
and magnesium elements (green and blue color, respectively), corroborating the results found by the
techniques of X-ray fluorescence and X-ray diffraction. It was, also, possible to notice a dark color in
the image, where the porous area is observed, probably, containing hydrocarbon.Bernardes et al. ● Braz. J. Rad. Sci. ● 2021 12
(a) (b)
Figures 5: Images enlarged by 100 times (a) and 500 times (b) of the structure of grains present in the
sample analyzed.
Figure 6: Dispersive energy spectroscopy map performed on a sample grain.Bernardes et al. ● Braz. J. Rad. Sci. ● 2021 13 From the analysis of the reconstructed image of a slice of shale rock by gamma-ray industrial tomography shown in Figure 7, and, by inference, the linear attenuation coefficient values (color bars), it may be stated that the rock presents a denser matrix, represented in pink color in the image. Probably, it should the silica (Si), the main element that constitutes the sample. There is, also, a small amount of red dots positioned in the central region, which, from the scale shown in the image, it may confirm that it is an element with a high-density value, maybe iron (Fe). Besides, it is possible to observe the presence of other elements with different densities, represented by the dark blue color. These elements may be calcium (Ca) and magnesium (Mg), both having similar density values, lower than Si and Fe. All of these elements corroborated the results obtained by the conventional techniques used in this work. Additionally, it is possible to observe some well-spread and poorly connected pores (green color), with some material inside and lower densities, suggesting that this substance could be a hydrocarbon. Further studies should be carried out to corroborate these results. However, these findings showed the feasibility of using this tomographic technique to characterize rocks, with the advantage of not having to fragment or spray as done in the conventional analytical or X-ray microtomography techniques. Thus, the present methodology could be used in large and different dimensions and shapes, as collected in nature. In future studies, it is planned to improve the spatial resolution of the tomograph to evaluate the porosity and its distributions in the interior of rocks, the interconnectivity between the pores, the permeability, and the density.
Bernardes et al. ● Braz. J. Rad. Sci. ● 2021                        14

                       Figure 7: A reconstructed image of the shale rock sample.

   4. CONCLUSIONS

   From the diffraction analysis, it was possible to conclude that the main components of the shale
sample analyzed are silica (Si), one of the most abundant chemical elements in the crust, presenting very
high diffraction peaks, followed by other elements such as iron, magnesium, and calcium, but in smaller
amounts. The presence of all these elements could be confirmed by the results obtained by the
fluorescence method, which determined that the silica value is approximately 22.4%, while, as to the
other elements, is between 4% and 6%. Also, the dispersive energy spectroscopy technique corroborated
Bernardes et al. ● Braz. J. Rad. Sci. ● 2021 15
the results of these elements in the shale sample. From the diffraction analysis, it was possible to
conclude that the main components of the shale sample studied are silica (Si), one of the most abundant
chemical elements in the crust, presenting very high diffraction peaks, followed by other elements such
as iron, magnesium, and calcium, but in smaller amounts. The presence of all these elements could be
confirmed by the results obtained by the fluorescence method, showing that the silica value is
approximately 22.4%, while, as to the other elements, is between 4% and 6%. Also, the dispersive
energy spectroscopy technique corroborated the findings of these elements in the shale sample. It was
demonstrated the feasibility of the tomography technique to be used for the characterization of the shale
rock, as established in this work. Further studies should be carried out to improve the spatial resolution
of the tomograph to obtain more details of the characteristics of the rocks, such as porosity distribution
in the interior of the rocks, the interconnectivity among the pores, the permeability, and the density.
ACKNOWLEDGMENTS
The authors express their acknowledgment to CNEN, CNPQ, and the IAEA for the financial support
and IGC/USP for the shale rock sampling plus help in the sample preparation. Thiago Lynyker da Silva
Bernardes thanks CAPES (finance code 0001) for his fellowship. Margarida Mizue Hamada and Carlos
Henrique Mesquita thank CNPQ for their research productivity scholarship.
REFERENCES
[1] SUGUIO, K. Geologia Sedimentar. Edgard Blücher ltda. /EDUSP, 400pp, 2003.CEMBER, H.
Introduction to health physics, 3rd ed. New York: MCGraw-Hill, 1996.
[2] BRANCO, P. M. O gás do xisto. CPRM. Brasília, Brazil. 2014. Available at:
. Last accessed: 22 jun. 2019.Bernardes et al. ● Braz. J. Rad. Sci. ● 2021 16
[3] UNIVERSIDADE ESTADUAL PAULISTA (UNESP). Folhelho. Available at:
. Last accessed: 14 jun.
2019.
[4] DYNI, J. R., 2006, Geology and resources of some world oil-shale deposits: U.S. Geological
Survey Scientific Investigations Report 2005-5294, 4p.
[5] BRENDOW, K. 2002. Global oil shale issues and perspectives. Synthesis of The Symposium on
Oil Shale. Tallinn, Estonia. v. 20, nº 1 p. 81-92. 2002.
[6] BECKHOFF, B.; KANNGIEBER, B.; LANGHOOF, N.; WEDELL, R.; WOLFF, H. Handbook of
Practical X-Ray Fluorescence Analysis, 1st ed. Berlin-London: Springer, 2006.
[7] NASCIMENTO FILHO, V. F. Técnicas Analíticas nucleares de fluorescência de raios X por
dispersão de energia (EDXRF) e por reflexão total (TXRF). Piracicaba: ESALQ/USP;
CENA/USP, 1999. 32p.
[8] MOORE, D. M.; Reynolds, R. C. X-ray Diffraction and the Identification and Analysis of Clay
Minerals. Oxford: Oxford University press, 1989.
[9] DUTROW, B. L.; CLARK, C. M. X-ray Powder Diffraction (XRD). 2009. Available at:
. Last ac-
cessed: 26 jul. 2019.
[10] MALISKA, A. M. Apostila Microscopia Eletrônica de Varredura, Universidade Federal de
Santa Catarina – UFSC. Available at: . Last accessed: 15 jun. 2019.
[11] NAGATANI, T. et al. Development of an Ultra High Resolution Scanning Electron Microscope by
Means of a Field Emission Source and in-Lens System. Scanning Microscopy, v. 11, p. 901-909,
1987.
[12] IAEA – International Atomic Energy Agency. Industrial Process Gamma Tomography.
TECDOC 1589, Viena, May 2008.
[13] VELO, A. F.; CARVALHO, D. V. S.; ALVAREZ, G. A.; HAMADA, M. M.; MESQUITA, C. H.
Evaluation of Interative Algorithms for Tomography Image Reconstruction – A Study Using a
Third Generation Industrial Tomography Version, In: INTERNATIONAL NUCLEAR AT-
LANTIC CONFERENCE, 2017, Belo Horizonte, Brazil, 2017.
[14] MESQUITA, C.H.; VELO, A.F.; CARVALHO, D.V.S.; MARTINS, J.F.T.; HAMADA, M.M.
(2016). Industrial tomography using three different gamma ray. Flow Measurement and
Instrumentation, v. 47, p. 1-9.Bernardes et al. ● Braz. J. Rad. Sci. ● 2021 17
[15] VELO A. F. Análise da Aplicação de Diferentes Algoritmos de Reconstrução de Imagens
Tomográficas de Objetos Industriais. IPEN/USP, São Paulo, Brazil, 2018. p. 122.You can also read