Phase IV monitoring 2020-21 All India Tiger Estimation 2021-22 - Karnataka Forest Department
←
→
Page content transcription
If your browser does not render page correctly, please read the page content below
Phase IV monitoring 2020-21
    All India Tiger Estimation 2021-22

Karnataka Forest Department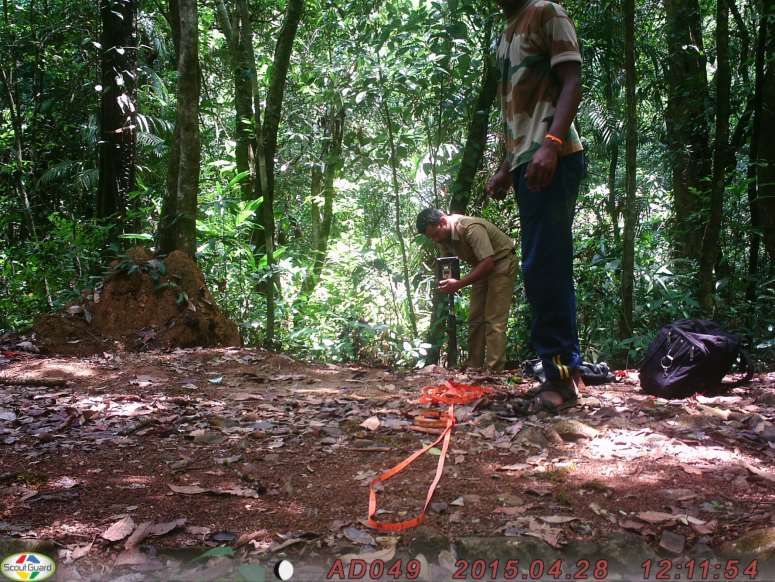
Index Data- Beats in place of Grids as a practical solution
                  for Systematic Sampling

                               -Carnivore sign index
                               -Ungulate abundance index
            Phase- I
            (8 day             -Human disturbance index
            protocol in
            all Tiger          -Habitat indices
            Bearing
 Indices    Forests)

                              -“Human Foot Print” indices
            Phase- II         -Habitat indices
            (Remotely
            Sensed            -Landscape indices
            by WII)
                                           - Camera Traps – Mark-
                                           recapture- Tigers
Absolute Abundance        Phase- III
                          ( Tiger          -Distance Sampling for
                          Reserves)        Ungulates.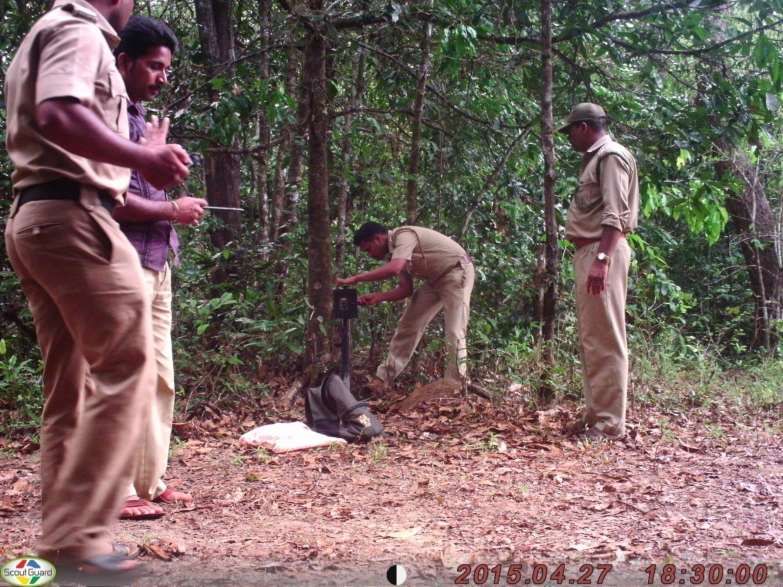

Basic understanding & concept

◼   Field data collected by beat guard is useful not
    only for his own area but more importantly, also
    for the entire landscape.
◼   Casual, defective or cooked up data collected by
    few individuals can distort the results of entire
    landscape.
◼   Even absence of tiger signs is an important
    indicator, in relation to the other parameters.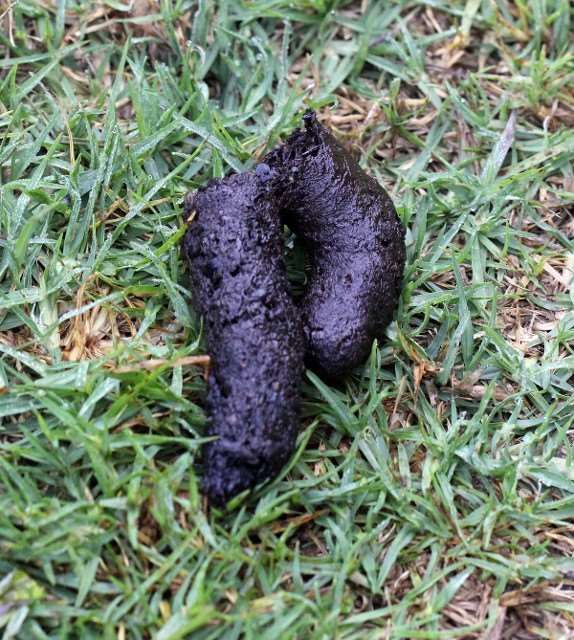
Form 1: Carnivore
 sign survey and
     analysis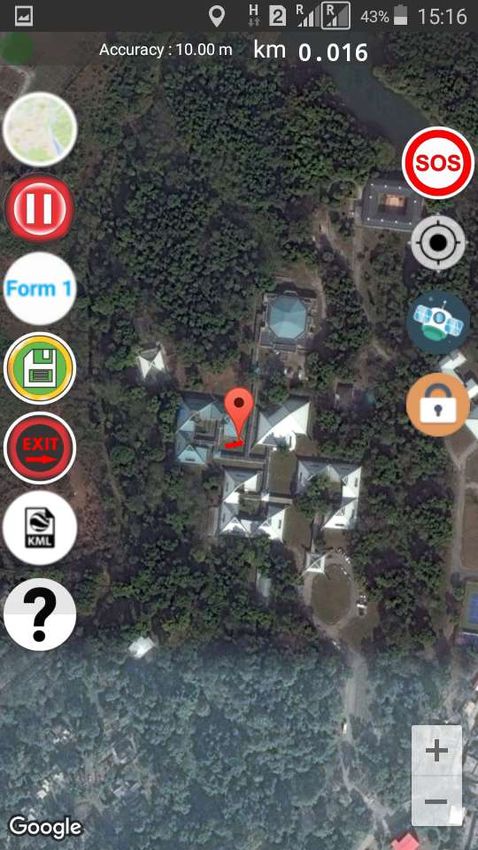
Beat wise monitoring of sign encounters

• Field Days - 3

• 3 days carnivore sign survey - 4-6 km on different
  trails everyday
• For 3days 15kms

• Form-1      Carnivore and Mega-Herbivore Sign
             Survey Datasheet

• Materials : Android sets / GPS/ Battery / Camera
                /Scat collection kit / wooden scale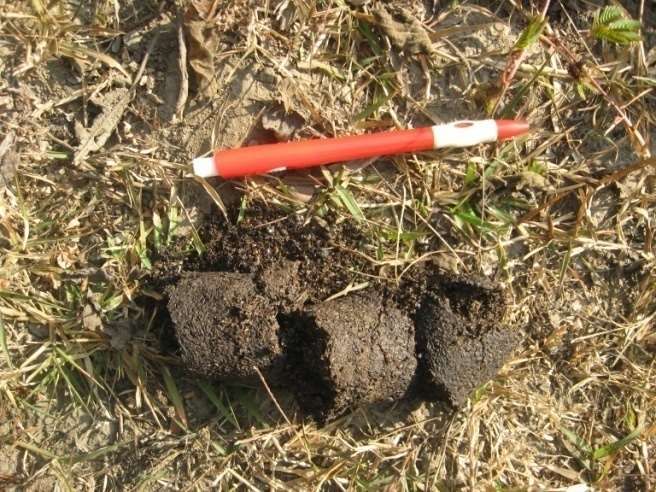
Carnivore sign survey

◼   Day 1
     ◼   Walk at least 5 km in a part of beat & record data as per
         instructions.
     ◼   Use Form 1 of MSTrIPES Ecological application.
◼   Day 2 & 3
     ◼   Repeat the exercise in remaining area of beat covering entire
         beat.
     ◼   Walk at least 15 km per beat in the 3 days survey.

     It is not mandate that entire division has to conduct the survey
         on the same dates, block wise method can be implemented
         based on logistics and skilled manpower availability.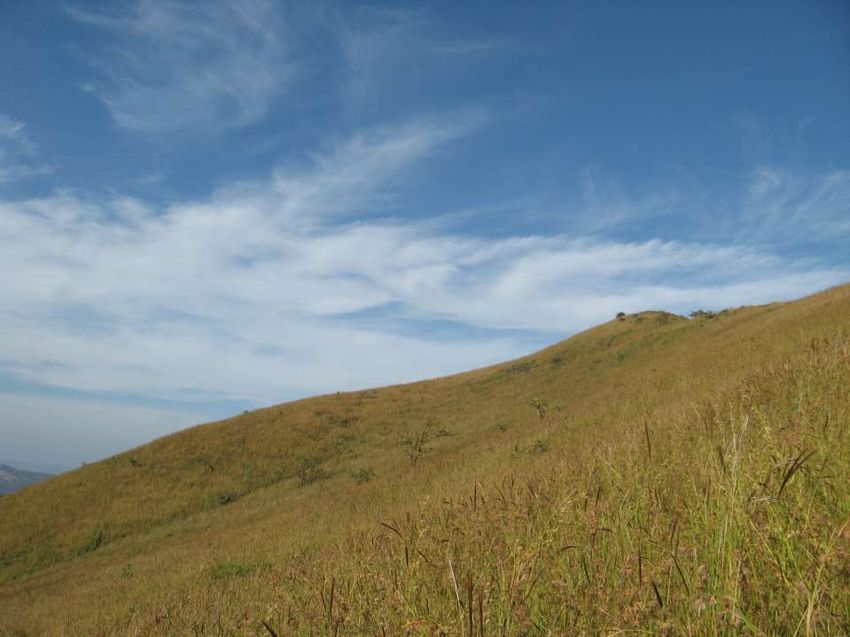
…carnivore sign survey

◼   There are also 5 questions in datasheet-I. Fill up the
    information for tigress and female leopard with cubs and
    incidences of cattle attack.
◼   Cases of recent human attack can be recorded in
    remarks. ( para. 6 )
◼   If sign types are not identifiable, note their details in
    remarks.
◼   Note any other important observation in remarks section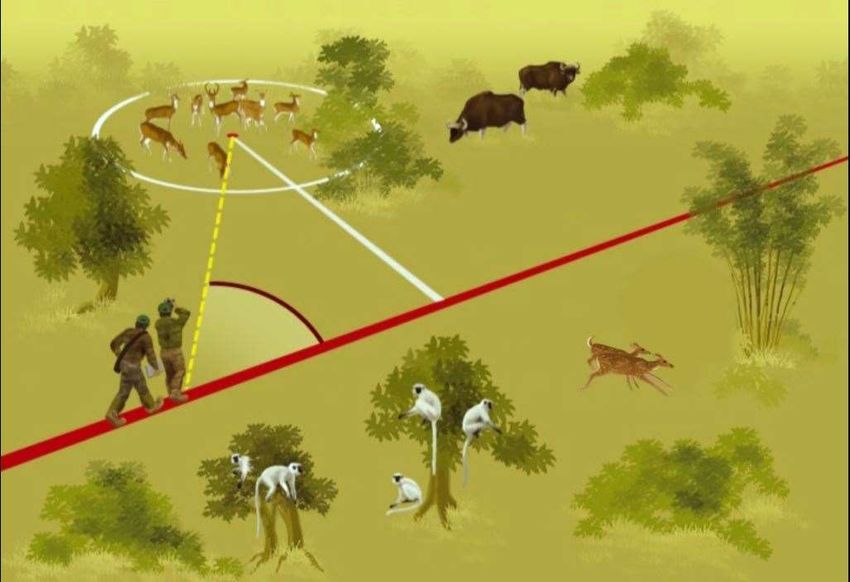
Issues in sampling design

                     1

                     2
             3
        1

        3        2
Day 2

       Day 1

                                                       Day 3

Carnivore sign survey in a beat- Beat divided into 3 parts.
Forest Beat with 3 Sign Sampling tracks and 2 Transect lines
(Beat size :10-12 Sq. Kms)
Line transect-1 Line transect-2
1
2
3Carnivore sign survey
• Illusive species, but
visible signs
• Intensive search
• Search in most
likely areas in each
Beat
• 3 searches each of
4-6 km
• Important to record
distance covered in
each search
• Same cluster of beats
identified for
camera trap
samplingForm – 1 Field protocols • Minimum 3 members in the Team • Person in middle will scan for signs in the middle of road, Team members on left and right will scan the edge of the road 2-3 m away. • Each Pugmark trail set ( say 1 km) is considered as “one sign”, record repetitive pugmarks every 500m • Be more Vigilant at Road/Foot-trail Junctions, Waterholes or water bodies and scan wider areas. • Intensive search.
Indirect Evidences
1. Foot prints
2. Faecal matters
3. Signs left by the animals
Pugmarks
c. Pug marks
Tiger                 Leopard

           Wild dog
Sloth Bear
OtterForm-1 PUGMARK_TRA CK
1. Faecal matters
a. Scats
   Civets, Cats, Wild dog, Sloth Bear, Otter
b. Pellets
   Sambar, Deer, Black naped Hare
c. Dung
   Elephant, Gaur
d. Droppings
   Primates, Wild pig, Porcupine
Tiger
• Large size in cluster
Leopard
• With primate hair
Wild Dog
• In several clusters
Sloth Bear
• With seeds and beetles
Form-1

    SCAT_DUNG
Form-1
SCRAPERAKE MARKS
MSTrIPES ecological app:
Android version 9 and above
MSTrIPES ecological app: Form 1
MSTrIPES ecological app: Form 1
MSTrIPES ecological app: Form 1
MSTrIPES ecological app: Form 1
MSTrIPES ecological app: Form 1
Importing in MSTrIPES desktop
Carnivore occupancy

• It is possible that the surveyed beat is having the
  presence of tigers or other carnivores, however,
  during the sign survey no evidence was found.
• In such cases occupancy models allow and correct
  imperfect detection. Therefore, report actual data as
  collected from the field and do not worry if it does
  not show a tiger sign.
• Occupancy models also incorporate covariates, i.e.
  factors that influence the presence of carnivores
  (tigers/leopards/etc. ) in an area, eg. Human
  disturbance, prey availability, habitat quality.
Form 2:
Ungulate line
transect and
   analysis
Ungulate line transect
               • Visible species

               • Systematic search

               • Search in dominant
                 forest type in each Beat
               • 1 line transect of
                 minimum 2km
               • Walk early morning.
                 Count no. of each
                 species, group size,
                 young ones seen.

               • Record forest type and
                 terrain type of the
                 transect

               • Transect should not be
                 along the river or road
Angular Sighting Distance
(Laser Range Finder)
Compass Bearing
GPS readingPerpendicular Distance
Data Sheet-2

         Important
         species to
         Record
Data Sheet-
2
Important
species to
RecordData Sheet-
2
Important
species to
RecordForest Beat with two Transect lines (Beat size :10-12 Sq.
Kms)
Line transect-1 Line transect-2Forest Beat with two Transect lines (Beat size :10-12 Sq.
Kms)
Line transect-1 Line transect-2MSTrIPES ecological app: Form 1
MSTrIPES ecological app: Form 2
MSTrIPES ecological app: Form 2
MSTrIPES ecological app: Form 2
Importing in MSTrIPES desktop
MSTrIPES Form 2 analysis
Form 3 (A,B,C)
   & Form 4:
 Habitat and
  pellet plots
Habitat and pellet plots
                 • Absolute countable
                   parameters

                 • Systematic sampling

                 • Plot at every 400m while
                   returning from each
                   transect

                 • 6 plots on an average
                   on a 2 km transect
                 • Form 3 has (A)
                   vegetation parameters
                   (B) human disturbance
                   signs and (C) ground
                   cover

                 • Form 4 to pellet counts
Forest Beat with 3 Sign Sampling tracks and 2 Transect lines
(Beat size :10-12 Sq. Kms)
Line transect-1 Line transect-2Form-3 (A,B,C) and 4
Vegetation
Survey
0m 400 m 800 m 1200 m 1600 m 2 Km
Plot
ID 0 1 2 3 4 5Habitat and pellet plots
2m Pellet plots
20m
Habitat plotsForm 3 (A,B,C)
Data sheet 3A- Canopy cover- examples

                     Canopy cover
     0 or 0%              0.2 or 20%            0.6 or 60%             1
or 100%

   (Fully open, no     (Sky 80%           (Sky 40%    (Fully closed,
   canopy, sky         open)              open.)     sky not
   fully visible)                                    visible)
Form 3 (A,B,C)
Data sheet 3A- Shrub Percent Cover- examples

            Shrub/Shruby weed Percent cover

 0 or 0%        1 or 25%           2 or 50%           3 or 75%
4 or 100%

No Shrub                                                   Full Shrub
Form 3 (A,B,C)
Dry leaf litter % in 1 m circular plot- Datasheet 3C

                                             Dry leaf
                                             Litter 40%

              1m

              Dry leaf litter @ 70%
Ground % cover
cover type
Weeds- 5 %
Dry grass- 10%
Green grass-
15%
1m
Herbs -20%
Bare ground -
50%
Data sheet 3C- Ground
Total ground 100%
cover in 1m radius circular coverForm 4
Pellets of different herbivore- DCF WL Allapalli. Dec. 2009
MSTrIPES ecological app: Form 1
MSTrIPES ecological app: Form 3 & 4
MSTrIPES ecological app: Form 3 & 4
MSTrIPES ecological app: Form 3 & 4
MSTrIPES ecological app: Form 4
MSTrIPES ecological app: Form 4
MSTrIPES ecological app: Form 4
MSTrIPES ecological app: Form 3 & 4
Importing in MSTrIPES desktop
MSTrIPES Form 3 analysis
Camera Trap Field Protocols

• Remove grass blades, leaves in front of camera that blocks
  camera sensors and flash
• Align the cameras properly
• Place the cameras at Knee height ( 1.5 feet) from ground level
• Each camera should be at 3-4 m from the center of the
  road/trail
• Minimum disturbance at the site where camera is deployed
• Insert AA Batteries with correct polarity
• Check and set Date, Time and Location ID correctly
• Enter all observations in datasheets
• Checking the camera units regularly
• Submitting data cards to Range office along with datasheets
• Do not share data
Deployment of Camera Traps
Deployment of Camera Traps
Thank You !
You can also read