Philanthropic Landscape - Snapshot of Today's 10TH EDITION - CCS ...
←
→
Page content transcription
If your browser does not render page correctly, please read the page content below

20
                  Snapshot of Today’s
               Philanthropic
                Landscape
                                   10 TH EDITION   21

A GUIDE TO PHILANTHROPY IN THE U.S .
Table of
    Contents
    SNAPSHOT OF GIVING                                           4

    KEY THEMES IN PHILANTHROPY TODAY
        The COVID-19 Pandemic and Philanthropy                    9
        Diversity, Equity, and Inclusion (DEI) in Philanthropy   14

    DATA DEEP DIVES
        Individual Giving                                        20
        High Net Worth Giving                                    30
        Gift Planning                                            40
        Digital Giving                                           48
        Foundation Giving                                        55
        Corporate Giving                                         61

    APPENDIX
        The CCS Philanthropic Landscape Team                     67
        The 2020 Philanthropy 50                                 69

PHILANTHROPIC LANDSCAPE REPORT   2021                                 2
PHILANTHROPIC LANDSCAPE REPORT 2021

    Introduction
    Welcome to the tenth edition of our annual Snapshot of Today’s Philanthropic Landscape
    report. Our first edition of this publication reported on Giving USA’s estimates for charitable
    giving in 2010 as philanthropy was bouncing back from the depths of the Great Recession. In
    2010, Americans gave $288.16 billion—$341.83 billion in inflation-adjusted dollars. In 2020,
    Americans gave $471.44 billion, a record amount and an incredible increase of 38% in inflation-
    adjusted dollars from giving levels at the start of the decade.

    Today’s philanthropic landscape is one of resiliency, responsiveness, and continued evolution.
    In 2020, a year like no other, Americans donated generously in response to a public health crisis,
    heightened human needs like food security, a dramatic upending of nonprofit operating models,
    and urgent calls for justice. Donors and nonprofits adapted to a world that rapidly became more
    digital. As the U.S. reckoned with racial inequity and social injustice, the field of philanthropy
    followed suit and took important and necessary, albeit unfinished, steps toward change.

    This report compiles and analyzes industry research to provide a snapshot of the state of
    philanthropy today. Nonprofit professionals and board members can use this guidebook to
    understand American philanthropy and set data-informed fundraising strategies for their
    organizations. Returning annual readers of this report will find expanded discussion of key
    themes in philanthropy today such as COVID-19 response and DEI (diversity, equity, and
    inclusion), tips for fundraising practitioners, and links to further resources throughout the report.

    American giving will continue to evolve over the next decade's worth of Philanthropic Landscape
    reports. CCS looks forward to tracking that evolution with you and helping our nonprofit partners
    achieve all that is possible in such a dynamic and generous landscape.

    Robert Kissane
    Chairman, CCS Fundraising

                                        Nonprofit professionals and board members can use this guidebook
                                        to understand American philanthropy and set data-informed
                                        fundraising strategies for their organizations.

PHILANTHROPIC LANDSCAPE REPORT   2021                                                                       3
SNAPSHOT OF GIVING

      Key Findings from This Year’s Report
      1. Individuals, foundations, and corporations donated $471.44 billion in 2020, a new record and an incredible
          demonstration of generosity and resilience in a complex year.1

                 Read more in Snapshot of Giving (page five)

      2. Donors are responding to the unique conditions of today’s world, making philanthropic gifts and pledges of more
          than $21 billion to U.S. COVID-19 relief and more than $14 billion to U.S. racial justice efforts in 2020 and 2021 to date.2

                 Read more in COVID-19 and Philanthropy (page nine) and Diversity, Equity, and Inclusion in Philanthropy (page 14)

      3. Donations in support of pandemic relief and racial justice did not diminish overall philanthropic giving in 2020;
          donations to eight of the ten charitable causes tracked by Giving USA increased in 2020.1
                 Read more in Snapshot of Giving (page five)

      4. Individuals continue to drive U.S. philanthropy, contributing 69% of giving in 2020.1 An increasingly large portion
         of giving comes from wealthier individuals: 80% of charitable dollars come from 20% of households.3
                 Read more in Individual Giving (page 20)

      5. Foundation giving grew faster than any other source in 2020, at a rate of 17%.1
                 Read more in Foundation Giving (page 55)

      6. Though corporate giving decreased by 6.1% in 2020,1 corporations stood out for significant philanthropic commitments
          to U.S. racial equity efforts and pandemic relief.2
                 Read more in Corporate Giving (page 61)

      7. The wealth of high net worth individuals grew in 2020, as did their giving; 2020’s top 53 donors gave
          a combined $24.7 billion.4
                 Read more in High Net Worth Giving (page 30)

      8. N
          onprofits accepting non-cash donations grow nearly five times faster on average than organizations accepting
         only cash gifts.5
                 Read more in Gift Planning (page 40)

      9. D
          igital giving increased by 21% to comprise 13% of all charitable giving in 2020, a new height.6
                 Read more in Digital Giving (page 48)

Sources:
1 Giving USA Foundation, Giving USA: The Annual Report on Philanthropy for the Year 2020 (2021).
2 Candid, “Philanthropic response to coronavirus (COVID-19)” (Accessed July 16, 2021) and “Funding for racial equity” (Accessed July 16, 2021).
3 Blackbaud, Vital Signs, Part 3: How Major Donors Are Shaping Philanthropy (2020).
4 The Chronicle of Philanthropy, “The Philanthropy 50” (2021).
5 Dr. Russell James III, Cash is Not King in Fundraising: Results from 1 Million Nonprofit Tax Returns (2018).
6 Blackbaud, Charitable Giving Report (2021).

PHILANTHROPIC LANDSCAPE REPORT                        2021                                                                                        4
SNAPSHOT OF GIVING

      Giving Reached Record Levels
      in a Year Unlike Any Other
      Giving USA estimates that charitable giving in the United States reached $471.44 billion in 2020, its highest level ever. On
      average, individuals, foundations, and corporations gave a combined $1.29 billion per day. Despite a mixed economic picture
      in which Gross Domestic Product (GDP) declined by 2.3% in current dollars, total giving grew by 5.1% in current dollars and
      3.8% in inflation-adjusted dollars. Giving USA attributes this growth to strong stock market performance by the end of 2020
      and an outpouring of generosity in response to the COVID-19 pandemic, its reverberating effects on human needs, and
      efforts to advance racial equity.

                                                                           TOTAL GIVING, 1980-2020
                                                                                                                                                                               $471.44
               $500B
                                                                                                                                                                                Billion
               $450B
               $400B
               $350B
               $300B
               $250B
               $200B
               $150B
               $100B
                $50B
                 $0B
                         1980 1982 1984 1986 1988 1990 1992 1994 1996 1998 2000 2002 2004 2006 2008 2010 2012 2014 2016 2018 2020

                                  Inflation-adjusted dollars, 2020 = $100                       Inflation-adjusted dollars in recession              Current dollars

      Underneath this aggregate growth, different types of donors and charitable causes saw uneven results.

                                YOY CHANGE, BY SOURCE                                                            YOY CHANGE, BY RECIPIENT

                                                                                                    Arts, Culture, & Humanities           -7.5%
                       Corporations            -6.1%
                                                                                                                           Health            -3.0%

                           Individuals                                                                                    Religion                        1.0%
                                                                   2.2%
                                                                                                          Giving to Foundations                            2.0%
                             Bequests                                    10.3%                                         Education                                  9.0%
                                                                                                           International Affairs                                  9.1%
                        Foundations                                           17.0%                             Human Services                                    9.7%
                                                                                                         Environment & Animals                                         11.6%
                                                                                                            Giving to Individuals                                      12.8%
                                                                                                          Public-Society Benefit                                         15.7%

Source: Giving USA Foundation, Giving USA: The Annual Report on Philanthropy for the Year 2020 (2021).

PHILANTHROPIC LANDSCAPE REPORT                      2021                                                                                                                                  5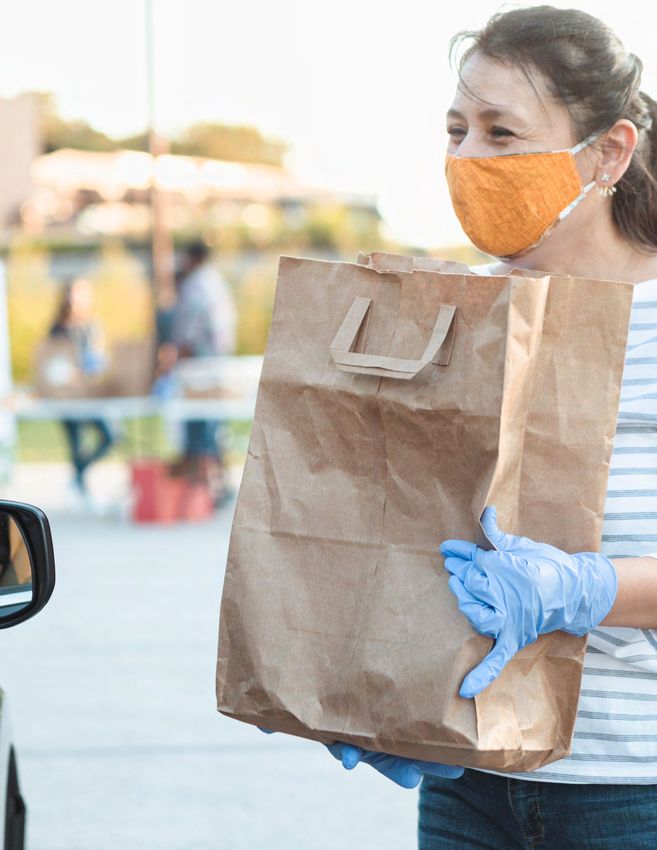
SNAPSHOT OF GIVING

      Individuals Contribute the Overwhelming
      Majority of U.S. Philanthropy
      Philanthropic giving is dominated by individuals.1 The $324.10 billion donated to charity exceeds the amount Americans
      spend on clothing ($310.90B), education services ($299.60B), and communication ($249.40B).2

                               Corporations                                     GIVING BY SOURCE1
                         Corporations
                              $16.88B // 3%
                         $16.88B / 4%
                                 Bequests
                         Bequests
                            $41.91B // 9%
                         $41.91B / 9%
                                   Foundations
                         Foundations
                               $88.55B // 19%                                                                                  Individuals
                         $88.55B / 19%                                                                                         $324.10B / 69%
                                                                                                                          Individuals…

                                               CCS Insight
                                               Much more than 69% of philanthropy can be traced to individual donors. If bequests (9%) and the
                                               approximately half of foundation giving that comes from family foundations (9.5%) are added, about
                                               88% of philanthropy comes from individuals, both living and deceased.

                                  2020 INDIVIDUAL GIVING RELATIVE TO 2019 CONSUMER SPENDING2
                                                                                    (in billions of dollars)

                                                                                                               $335.40         $350.60          $357.40
                                                                     $310.90                 $324.10
                                              $299.60
                      $249.40

                 Communication               Education                Clothing               Charitable    Gasoline and       Household      Furnishings and
                                              services                                         giving      other energy        utilities       household
                                                                                                              goods                            equipment

             “Communication” includes telecommunication services, postal and delivery services, and internet access. “Clothing” excludes footwear.

Sources:
1 Giving USA Foundation, Giving USA: The Annual Report on Philanthropy for the Year 2020 (2021).
2 Bureau of Economic Analysis, “Personal Consumption Expenditures by Type of Product” (2020).

PHILANTHROPIC LANDSCAPE REPORT                      2021                                                                                                       6
SNAPSHOT OF GIVING

      Foundation Giving Grew Faster
      than All Other Sources over Five Years
                                                                  TOTAL GIVING
                                                                     ↑3.52% CAGR*
                             $500B
                                                                                                                          Total giving grew
                             $400B                                                                                        by 3.52% on average
                                                                                                                          over five years
                             $300B
                                              2016              2017              2018              2019    2020

                                                            INDIVIDUAL GIVING
                                                                     ↑3.01% CAGR*
                                                                                                                          Individual giving grew
                             $300B
                                                                                                                          by 3.01% on average
                                                                                                                          over five years
                             $200B
                                              2016              2017              2018              2019   2020

                                                           FOUNDATION GIVING
                                                                     ↑7.01% CAGR*
                             $100B
                                                                                                                          Foundation giving grew
                               $50B                                                                                       by 7.01% on average
                                                                                                                          over five years
                                $0B
                                              2016              2017              2018              2019   2020

                                                               BEQUEST GIVING
                                                                      ↑3.90% CAGR*
                             $50B
                                                                                                                          Giving by bequest grew
                                                                                                                          by 3.90% on average
                                                                                                                          over five years
                               $0B
                                             2016             2017              2018              2019     2020

                                                           CORPORATE GIVING
                                                                    ↓-2.75% CAGR*
                             $25B
                                                                                                                          Corporate giving decreased
                                                                                                                          by 2.75% on average
                                                                                                                          over five years
                               $0B
                                             2016             2017              2018              2019     2020

              * Compound annual growth rate (CAGR): the rate of growth of an investment over a specific period of time.

Source: Giving USA Foundation, Giving USA: The Annual Report on Philanthropy for the Year 2020 (2021).

PHILANTHROPIC LANDSCAPE REPORT                      2021                                                                                               7
SNAPSHOT OF GIVING

      Giving Grew for Eight Out of Ten Sectors
      The largest share of charitable dollars goes to Religion, which includes congregations, missions, religious media, and other
      related organizations.
      Together, Religion, Education, and Human Services received 57% of contributions in 2020. The fastest growing sectors were
      Public-Society Benefit, Giving to Individuals, Environment & Animals, and Human Services.

                                                                          GIVING BY RECIPIENT TYPE

                                             3% 3%
                                        4%
                                   5%                         28%

                              9%                                                      Religion // $131.08B                               Education // $71.34B
                                                                                      Human Services // $65.14B                          Giving to Foundations // $58.17B
                                                                                      Public-Society Benefit // $48.00B                  Health // $42.12B
                             10%
                                                                                      International Affairs // $25.89B                   Arts, Culture, & Humanities // $19.47B
                                                               15%                    Giving to Individuals // $16.22B                   Environment & Animals // $16.14B
                                   12%
                                                 14%

         SECTOR                                                                              AMOUNT                      CHANGE SINCE 2019                         % OF TOTAL
         Religion                                                                            $131.08B                    Increased 1.0%                            28%
         Education                                                                           $71.34B                     Increased 9.0%                            15%
         Human Services                                                                      $65.14B                     Increased 9.7%                            14%
         Giving to Foundations                                                               $58.17B                     Increased 2.0%                            12%
         Public-Society Benefit                                                              $48.00B                     Increased 15.7%                           10%
         Health                                                                              $42.12B                     Decreased 3.0%                            9%
         International Affairs                                                               $25.89B                     Increased 9.1%                            5%
         Arts, Culture, & Humanities                                                         $19.47B                     Decreased 7.5%                            4%
         Giving to Individuals                                                               $16.22B                     Increased 12.8%                           3%
         Environment & Animals                                                               $16.14B                     Increased 11.6%                           3%

      Donations to Health and Arts, Culture, & Humanities organizations decreased last year. Giving to Arts, Culture, & Humanities
      organizations normally dips during economic downturns, and 2020 was a uniquely challenging year due to shutdowns
      impacting in-person events, visits, and performances. In the Health sector, many gifts that typically would go to specialized
      healthcare areas were redirected or put on hold amid the COVID-19 crisis. Moreover, many large gifts directed toward
      healthcare or medical research were given to academic medical institutions, meaning that in Giving USA’s methodology these
      dollars will show up in Education rather than Health.

                                                            CCS Resource
                                                            The philanthropic landscape within each sector has nuances that do not appear
                                                            in the field-wide data contained in this publication. Check out CCS’s sector-specific
                                                            data publications to dive deeper.

Source: Giving USA Foundation, Giving USA: The Annual Report on Philanthropy for the Year 2020 (2021). Growth rates are in current dollars.

PHILANTHROPIC LANDSCAPE REPORT                       2021                                                                                                                         8
The COVID-19
Pandemic and
Philanthropy
While the effect of the pandemic on philanthropy is still developing,
the crisis to date has illustrated the generosity of Americans in trying
times and the adaptability of nonprofits and donors alike.

                                                                           9
COVID-19 AND PHILANTHROPY

      Unprecedented Times
      Elicited Extraordinary Generosity
      The philanthropic response to the COVID-19 pandemic is monumental and reflects the unparalleled scale of COVID-19’s
      global impact. As of July 2021, Candid has recorded more than $25 billion granted and pledged in support of COVID-19 relief
      worldwide.1 Over $21 billion of that total has been designated for organizations based in the United States.

                                            KNOWN GIFTS AND PLEDGES FOR U.S. PANDEMIC RELIEF

                                                                                         3%

                     $21B+                                                    24%
                                                                                                                 Corporations // $9.5B

                                                                                                                 Individuals // $6.2B
                                                                                                         44%
                 Grants and pledges to
                                                                                                                 Foundations // $5.1B
                 U.S.-based recipients
                    as of July 2021                                                                              Public Charities* // $745.8M
                                                                                   29%

      This total is especially impressive considering it is an incomplete picture of pandemic-related generosity in America. Candid’s
      totals draw only from publicly available sources (e.g., press releases, websites, and local reporting) and information submitted
      directly by funders. Philanthropy not covered in Candid’s dataset includes grants from donor-advised funds (DAFs) and
      contributions from households submitted directly to nonprofits without a public announcement.2
      *Public charities in this dataset include grantmaking organizations that are not classified as foundations or corporate giving programs. Examples include Blue
       Meridian Partners, United Way chapters, and the Center for Disaster Philanthropy. Please note that funding from governments and government-linked sources is
       excluded. Totals include cash grants, pledges, and in-kind support.

                                             CCS Insight
                                             The source distribution of pandemic relief donations above looks quite different from the distribution of
                                             overall philanthropic giving shown on page six. Notably, corporations made up 4% of overall giving in 2020
                                             but 44% of relief commitments from 2020 to 2021.
                                             What explains the prominence of corporate donations here, especially given that overall giving by
                                             corporations decreased by 6.1% last year? The nature of the data is one factor: this dataset includes both
                                             grants and pledges. Businesses will pay many of these commitments over multiple years. Moreover, other
                                             giving sources are underrepresented due to Candid’s methodology. Corporate donations tend to be publicly
                                             announced shortly after they are made, while many individual and foundation donations are not.
                                             Caveats aside, this data does speak to a special emphasis that corporations place on disaster-response giving.
                                             For further discussion on this topic, refer to page 64 in the Corporate Giving section.

Sources:
1 Candid, “Philanthropic response to coronavirus (COVID-19)” (Accessed July 16, 2021).
2 Candid and Center for Disaster Philanthropy, Philanthropy and COVID-19: Measuring One Year of Giving (2021).

PHILANTHROPIC LANDSCAPE REPORT                      2021                                                                                                                10
COVID-19 AND PHILANTHROPY
Americans Remained Generous
amid Early Uncertainty
Americans gave generously to both pandemic-related and non-pandemic-related causes in the early months of the crisis.
Depending on the cause area, between 77% and 81% of households maintained or increased their giving in March through
May 2020. Nearly one-third (32%) of households donated to charities, individuals, or businesses for pandemic relief.
CHANGES IN HOUSEHOLD GIVING TO CHARITABLE ORGANIZATIONS
(In First Three Months of Pandemic: March 2020-May 2020)
Giving to charitable organizations
for basic needs and health
18% 63% 19%
Giving to charitable organizations
for religious purposes
7% 72% 21%
Giving to charitable organizations
for all other purposes
6% 71% 22%
Increased Stayed the Same Decreased
HOUSEHOLD PARTICIPATION IN PANDEMIC RELIEF GIVING*
(In First Three Months of Pandemic: March 2020-May 2020)
Any Giving Indirect Giving Direct Giving
to Support Pandemic Relief to Support Pandemic Relief to Support Pandemic Relief
32%
44% 52% 48%
56%
68%
Gave Did not give
Gave Did not give
*D
irect giving in this study included gifts to charitable organizations, individuals, or businesses. Indirect giving included more informal philanthropic
actions toward individuals and businesses, like paying vendors for services that they could not render due to social distancing requirements.
Source: Women’s Philanthropy Institute at IUPUI Lilly Family School of Philanthropy, COVID-19, Generosity, and Gender: How Giving Changed During the Early Months of a Global Pandemic (2020).
PHILANTHROPIC LANDSCAPE REPORT 2021 11COVID-19 AND PHILANTHROPY
More Affluent Individuals Increased
than Decreased Their Giving in 2020
During 2020, nearly 90% of affluent* households gave to charity. This figure is consistent with reports of this group’s
giving rates from 2018, the most recent year for which a comparison is available. Nearly half (47%) donated in direct
response to the pandemic during 2020.
CHANGES IN GIVING IN RESPONSE TO THE PANDEMIC
Giving to charitable organizations to help people in need of food, shelter, or other basic necessities
or giving to charitable organizations focused on health and medicine
37% 56% 7%
37% 56% 7%
Giving to charitable organizations for religious purposes or spiritual development
16% 37%(e.g., churches, synagogues, mosques, or TV/radio
56% ministries)
69% 15%7%
16% 69% 15%
37% 56% 7%
16%
12% 69%
81% 15%6%
Giving to charitable organizations for other purposes not listed above
(e.g., for educational purposes, for the arts, for environmental causes)
12% 16% 81% 69% 15% 6%
Increased
12% 81% 6%
12%
Increased 81% 6%
Increased Increased
Did not change Decreased
Depending on the cause area, between 85% and 93% of households maintained or increased their level of support for
nonprofits. Affluent households were more likely to increase their level of giving than decrease it across all sector categories.
Notably, more than one-third (37%) of affluent households increased their giving to organizations focused on health,
medicine, and/or helping people in need of food, shelter, or other basic necessities.
* “Affluent” households are defined in this study as those with either an annual household income of at least $200,000 and/or a net worth of at least
$1 million, excluding primary residence. Note that the trends on the previous page apply to the general United States population.
Source: Bank of America and IUPUI Lilly Family School of Philanthropy, Affluent Americans Expand Generosity during the Pandemic (2021).
PHILANTHROPIC LANDSCAPE REPORT 2021 12COVID-19 AND PHILANTHROPY
Fundraising
Went Virtual
Social distancing requirements rapidly transformed how SUCCESS OF VIRTUAL MAJOR
nonprofits engaged their donors. CCS’s findings from surveying GIFT SOLICITATIONS
more than 1,000 nonprofit leaders, staff, and board members
in January 2021 provided insight into how organizations found
fundraising success in a virtual world throughout 2020.
23% 49%
ADOPTION OF VIRTUAL DONOR ENGAGEMENT
More successful As successful
than in-person as in-person
61% of respondents held a virtual fundraising event
56% of respondents held a virtual major gift solicitation
72%
of respondents who held virtual
major gift solicitations found them to be
either as successful or more successful
than the results they’d expect from
a typical in-person solicitation
19% 9%
Less successful Unsure/
than in-person too soon to tell
Dive Deeper
Explore additional findings from CCS’s four-part Philanthropic Climate Survey series
and read our perspectives on virtual major gift solicitation and virtual event strategies.
Source: CCS Fundraising, CCS Philanthropic Climate Survey, Edition IV (2021).
PHILANTHROPIC LANDSCAPE REPORT 2021 13Diversity, Equity,
and Inclusion in
Philanthropy
Like many of our nonprofit partners, CCS is continuing to challenge itself to be
a more diverse, equitable, and inclusive firm. Our intention is that this chapter
is not merely informational, but will also serve as a field-wide call to action to
make the practice of fundraising more diverse, equitable, and inclusive.
CCS is grateful to Birgit Smith Burton, Chair-Elect of AFP Global Board and
Founder of the African American Development Officers network (AADO),
and Yolanda F. Johnson, Founder of Women of Color in Fundraising and
Philanthropy (WOC), for their insight and guidance on developing this chapter.
14DEI IN PHILANTHROPY
Giving to Organizations Fighting
for Equity Spiked
In 2020 and 2021 to date, American donors used philanthropy as a tool to advocate for racial justice amid a pandemic that
exacerbated existing inequities, a widespread movement for racial equity spurred by the murder of George Floyd, and a surge
in hate crimes against Asian Americans and Pacific Islanders. Candid found that the amount of publicly announced donations
in support of racial equity efforts in 2020 and 2021 alone is 3.8 times more than the donations they have tracked for the
previous nine years combined.1
KNOWN GRANTS AND PLEDGES IN SUPPORT OF RACIAL EQUITY
2020-2021 YTD $14.7B
2011-2019 $3.9B
Moreover, many foundations announced new efforts to support communities disproportionately affected by the pandemic.2
FOUNDATION SURVEY RESPONDENTS REPORTING NEW EFFORTS
TO SUPPORT ORGANIZATIONS SERVING SPECIFIC POPULATIONS
Black or African American communities 75%
People from lower-income communities 71%
Hispanic, Latino, Latina, Latinx, or Latin American communities 63%
Undocumented immigrants 47%
People with disabilities 30%
Asian or Asian American communities 28%
Native American, Native Alaskan, or Indigenous communities 25%
Middle Eastern or North African communities 18%
Native Hawaiian or Pacific Islander communities 12%
The intentions described in this graph align with the spirit of a Council on Foundations Pledge—signed by more than
800 foundations—to make operational changes to better support nonprofits during the COVID-19 pandemic, which is
discussed in more detail on page 58.
CCS Insight
The data available on equity-focused giving are incomplete. Anecdotal reports demonstrate an influx
of funding for many groups whose safety, rights, and opportunities are threatened today but are not
included in the data sources above, including the Jewish population, women, and members of the
LGBTQ+ community.3 While philanthropy alone cannot remedy the varied layers of inequity in the
United States, the influx of financial generosity is an important lever in driving systemic change.
Sources:
1 Candid, “Funding for racial equity” (Accessed July 16, 2021). As this data source only includes publicly announced gifts and gifts reported directly to Candid that are earmarked for racial equity, it is
an underestimate of all giving in support of racial equity. For further discussion of Candid's methodology, see page 10.
2 The Center for Effective Philanthropy, Foundations Respond to Crisis: Toward Equity? (2020).
3 See, for example, Inside Philanthropy, “In a Difficult Year, LGBTQ Fundraisers Saw Strong Support, New Opportunities” (2021), “With Antisemitic Attacks on the Rise, Who’s Giving to Combat Hate?“
(2021), and “Women Face Amplified Risks in the Pandemic. Funders Are Responding” (2020).
PHILANTHROPIC LANDSCAPE REPORT 2021 15DEI IN PHILANTHROPY
Individuals Are Generous Regardless
of Race, Gender, or Sexual Orientation
In the U.S., we know that wealth is not (and never has been) distributed evenly among population demographics.
For example, women on average hold less wealth than men1 and households of color on average hold less wealth
than white households.2
This narrative may contribute to an incorrect assumption that certain groups, especially women and people of color,
are not philanthropic.3 But this is a myth—research shows that Americans are generous regardless of race, ethnicity,
gender, or sexual orientation.
PERCENTAGE OF AFFLUENT* INDIVIDUALS DONATING TO CHARITY4
Women 93%
Men 87%
African American 92%
Asian American 85%
Hispanic 89%
White 90%
LGBTQ 87%
Non-LGBTQ 90%
*P
articipants in this study had either an annual household income of at least $200,000 and/or a net worth of at least $1 million, excluding
primary residence.
The U.S. Trust Study of High Net Worth Philanthropy illustrates that among affluent individuals, an overwhelming majority
donate to charity regardless of identity group. The only difference that researchers found to be statistically significant was
between women and men, with women being more likely to donate.
For Consideration on Your Organization’s DEI Journey
1. Review your own donor pipeline data on diversity. If no information is available, what data could
your organization begin tracking to aid in evaluating DEI in your fundraising operations?
2. When engaging communities that you yourself are not a part of, ensure that your approach
is personalized and culturally sensitive. For guidance on this topic, check out our article
“Intercultural Competence for Nonprofit Fundraising.”
3. Continually evaluate your organization’s overall operations and programs through a DEI lens,
and share information about these efforts with donors where appropriate. Consider formalizing
measurable goals as they relate to your mission.
Sources:
1 Boston Consulting Group, “Managing the Next Decade of Women’s Wealth” (2020).
2 Federal Reserve, “Disparities in Wealth by Race and Ethnicity in the 2019 Survey of Consumer Finances” (2020).
3 Faculty of the Lilly Family School of Philanthropy, “Eight Myths of US Philanthropy” (2019).
4 Bank of America and IUPUI Lilly Family School of Philanthropy, U.S. Trust Study of High Net Worth Philanthropy (2018).
PHILANTHROPIC LANDSCAPE REPORT 2021 16DEI IN PHILANTHROPY
The trends seen among affluent donors also show up in the general population.1 The Indiana University Lilly Family School of
Philanthropy’s analysis of Philanthropy Panel Study (PPS) data illustrates that when factors like wealth, income, and education
are controlled for, a donor’s race or ethnicity does not significantly influence their charitable giving levels. As the Lilly School
writes, “initial racial differences actually appear to reflect larger income and wealth gaps.”
AMOUNT OF GIVING, AS A PERCENTAGE OF PERMANENT HOUSEHOLD INCOME
3% 3%
3% 2% 3%
2%
African American
African American HispanicWhite White
Hispanic
Asian American-headed households were excluded due to a small sample size. Though Hispanic-headed households gave approximately one percentage point
less of their income on average in this study, the Lilly School researchers found that this difference was not statistically significant.
As in the U.S. Trust Study of High Net Worth Philanthropy, women in the Philanthropy Panel Study were more likely to donate
to charity than men.
CCS Insight
This general population data is slightly outdated (it was collected in 2015) and is limited in terms of the
identity groups studied. But it does illustrate an important concept: Americans of all identities are charitable.
Myths about a population’s desire to give can impede relationship building with donors. For example,
in a study of 1,000-plus donors conducted by Blackbaud, African American and Hispanic donors
reported being solicited for gifts less frequently than other racial and ethnic groups.2 These donors
also suggested that if asked more often, they would donate more.
If a nonprofit wants to reach all donors who may support its mission, an inclusive fundraising approach is
essential. Diverse groups of Americans are charitable, but nonprofits have in the past failed to seek out
and serve a diverse donor base. Individual nonprofits may need to devote time to evaluating their donor
pipeline and outreach efforts to correct course.
Sources:
1 IUPUI Women’s Philanthropy Institute at the Lilly Family School of Philanthropy, Women Give 2019: Gender and Giving Across Communities of Color (2019).
2 Blackbaud, Diversity in Giving: The Changing Landscape of American Philanthropy (2015).
PHILANTHROPIC LANDSCAPE REPORT 2021 17DEI IN PHILANTHROPY
A Call to Action: Approaching DEI
in Fundraising with New Urgency
In a CCS survey of more than 1,000 nonprofit leaders and staff in January 2021, half of respondents reported some
level of change in their nonprofits’ practices in response to society’s renewed focus on racial equity and social justice.
The most frequently reported changes revolved around overall workplace policies and board activities.
51% 43%
Made workplace more diverse, Made board more diverse,
equitable, and/or inclusive equitable, and/or inclusive
Fewer respondents reported new actions specific to their relations with donors and volunteers. These data suggest
a widespread opportunity for nonprofits to examine DEI in their philanthropic operations.
37% 14% 14% 7%
Modified messaging Modified volunteer Revised donor Changed giving
used with donors recruitment/management pipeline strategies purposes (case for
practices support)
Source: CCS Fundraising, CCS Philanthropic Climate Survey, Edition IV (2021).
PHILANTHROPIC LANDSCAPE REPORT 2021 18DEI IN PHILANTHROPY
Further Resources
The following resources can help nonprofits get started with building a more diverse, equitable, and inclusive
fundraising program.
Cause Effective Money, Power and Race: The Lived Experiences of Fundraisers of Color 2019
Who Funds the World? Girls: How Nonprofits Can Avoid Overlooking the Value
CCS Fundraising 2021
of Women Donors
LGBT Giving Project LGBT Giving Project 2011-2020 2020
Lisa Schohl
How to Create a Culture of Inclusive Fundraising 2021
(Chronicle of Philanthropy)
Catherine Hyde Townsend
5 Actions Nonprofits Can Take to Embrace Disability Rights and Access 2020
(Ford Foundation)
Urvashi Vaid and The Apparitional Donor: Understanding and Engaging High Net Worth Donors
2017
Ashindi Maxton of Color
“It is extremely important that we continually conduct research that produces
valuable data focused on inclusion, diversity, equity, and access (IDEA) in the
philanthropic space, specifically data that represents all groups of people. This
will enable our field to make informed decisions around how we engage these
communities, empowering us to address societies’ most challenging issues.”
– Birgit Smith Burton, Chair-Elect of AFP Global Board and Founder of the African American
Development Officers network (AADO)
PHILANTHROPIC LANDSCAPE REPORT 2021 19Individual
Giving
Individuals continue to drive U.S. giving. Accordingly,
understanding the motivations, interests, and
preferences of individual donors is key for nonprofits
looking to elevate their fundraising.
20INDIVIDUAL GIVING
Individual Giving Continued to
Grow in 2020
$324.10B 2.2% 69%
Individuals gave $324.10 Giving by individuals increased by Individuals made up 69%
billion in 2020 2.2% from 2019 to 2020 of all charitable giving in 2020
Individuals contribute most charitable giving in the United States.
GIVING BY INDIVIDUALS, 1980-2020
$324.10
$300B Billion
$250B
$200B
$150B
$100B
$50B
$0B
1980 1982 1984 1986 1988 1990 1992 1994 1996 1998 2000 2002 2004 2006 2008 2010 2012 2014 2016 2018 2020
Inflation-adjusted dollars, 2020 = $100 Inflation-adjusted dollars in recession Current dollars
Individual giving increased in 2020 amid a mixed economic picture in which GDP decreased and unemployment soared.
Growth in individual giving has been linked over time to stock market performance and disposable personal income (DPI),
or income available for spending and saving. In 2020, the stock market recovered by the end of the year, with the S&P 500
growing 16.3% in current dollars. DPI increased in 2020 by 7% compared to 2019.
Giving USA’s calculations include both non-itemized and itemized contributions. Gifts of cash, securities, and property are all included. On the sources side, gifts
to donor-advised funds (DAFs) are counted in individual giving when a donor’s initial contribution to the DAF is made. Since DAFs function as a pass-through for
donations, to avoid double counting Giving USA typically takes the net of incoming contributions and outgoing grants when calculating giving to recipient groups.
The exceptions to this process are grants made from DAFs housed at a community foundation, which are treated as foundation grants. On the recipient side, DAFs
are counted where the organization that hosts the DAF is counted.
Source: Giving USA Foundation, Giving USA: The Annual Report on Philanthropy for the Year 2020 (2021).
PHILANTHROPIC LANDSCAPE REPORT 2021 21INDIVIDUAL GIVING
Individual Giving Is Top-Heavy
The amount of money given by individuals is growing each year. At the same time, the number of individual donors is going
down.1 Charitable giving is increasingly concentrated among wealthier households.
53% 90%
of all households give of affluent* households give
($2,763 on average annually)1 ($29,269 on average annually)2
* Affluent” is defined as having annual household income of more than $200,000 and/or a net worth of more than $1 million, excluding primary residence.
Eighty percent (80%) of charitable giving comes from only 20% of households. Nearly half (45%) of giving comes from only
1% of households.
20% 1%
of households provide 80% of households provide 45%
of dollars donated3 of dollars donated
CCS Insight
This “dollars up, donors down” trend means that a small portion of a nonprofit’s donor base often
has an outsized effect on its fundraising results. Accordingly, nonprofits should understand which
donors contribute the majority of funds and consciously steward those supporters.
Sources:
1 IUPUI Lilly Family School of Philanthropy, 16 Years of Charitable Giving Research (2019).
2 Bank of America and IUPUI Lilly Family School of Philanthropy, The U.S. Trust Study of High Net Worth Philanthropy (2018).
3 Blackbaud, Vital Signs, Part 3: How Major Donors Are Shaping Philanthropy (2020).
PHILANTHROPIC LANDSCAPE REPORT 2021 22INDIVIDUAL GIVING
Most Donors Are Motivated by Altruism
In thousands of interviews with donors since 2011, CCS has found that individuals are most frequently driven to give by
altruistic considerations, predominantly the belief that their gift can make an impact.1 Especially notable in today’s policy
environment is that tax considerations were the least commonly cited motivation.
MOTIVATIONS FOR OVERALL PHILANTHROPIC GIVING
As cited by nonprofit donors interviewed in CCS Feasibility and Planning Studies, 2011-2021
84%
67%
54% 51% 45%
25%
There isThere
a perceived/real
is a You believe those who
You believe Your religious
Your or moral
religious or You feel
You feel something
something is You were
You wereasked to
asked YouYou
will receive an income
will receive
benefit of the impact of have the ability should give obligation encourages owed to the community
perceived/real those who have moral obligation is owed to to contribute
contribute tax deduction
an income tax
the gift to those who are less giving
benefit of the the ability should
fortunate encourages giving the community deduction
impact of the gift give to those who
are less fortunate
CCS’s findings in feasibility and planning study interviews align with academic research on the psychology of giving.2 For
example, Drs. Sara Konrath and Femida Handy have developed a framework of six types of influences on charitable giving and
found that charitable donors are most likely to agree with motivation statements anchored in altruism and trust and
least likely to agree with statements anchored in egoism and tax benefits.3
INFLUENCES ON CHARITABLE GIVING
Framework developed by Drs. Sara Konrath and Femida Handy
Social benefits - nonmonetary benefits like being part of a
Altruism - concern or compassion for those less fortunate
social network
Trust - seeing charities properly use donations for public good Tax benefits - monetary personal benefits
Egoism - experiencing good feelings about oneself Financial constraints - monetary limitations, which can be a
or enhancing one’s reputation negative influence on giving
CCS Insight
Donors give for complex and interconnected reasons. Ultimately, the best donor outreach strategy is one
personalized to the individual, taking into account what may be a mix of selfless and self-interested motivators.
However, nonprofits can connect with the greatest number of donors by focusing on the impact of one’s gift.
Sources:
1 CCS Fundraising (2021).
2 René Bekkers and Pamala Wiepking, "A Literature Review of Empirical Studies of Philanthropy: Eight Mechanisms That Drive Charitable Giving" (2011).
3 IUPUI Lilly Family School of Philanthropy, “Why do people give?” (2019) and Sara Konrath and Femida Handy, “The Development and Validation of the Motives to Donate Scale” (2017). On a scale of 1
(strongly disagree) to 5 (strongly agree), average scores were as follows: 4.21 for altruism, 3.71 for trust, 3.15 for social, 2.45 for constraints, 2.20 for egoism, and 2.06 for tax.
PHILANTHROPIC LANDSCAPE REPORT 2021 23INDIVIDUAL GIVING
Donors Research Impact and Efficiency
at Organizations They Support
A donor survey conducted by Blackbaud found that 56% of donors say they actively research how an organization spends
its money prior to making a gift.1 Donors who research before giving examine the following factors.
WHAT DONORS RESEARCH BEFORE GIVING
Overall Efficiency 70%
Philanthropic Impact 59%
General Reputation 54%
Mission and Services 53%
Operating Costs 53%
Executive Salaries 43%
Funding Sources 31%
In addition to researching a nonprofit before giving a gift, a survey by Fidelity Charitable indicates that 39% of donors track
results for nonprofits that they already support.2 Millennials are more likely than their older peers to actively research results.
PERCENTAGE OF DONORS WHO TRACK RESULTS FOR MOST
OR ALL NONPROFITS THEY SUPPORT
39% 66% 40% 32%
of all donors of Millennials of Gen X of Baby Boomers
CCS Insight
Demonstrating the impact of philanthropic giving is not only an important tactic for donor
acquisition, but also an important tool for stewarding those who have already made a gift. When
crafting donor communications, nonprofits should clearly articulate the impact of a donor’s gift, as
well as the organization’s efficiency in carrying out its mission. Demonstrating results is especially
important in communications with younger donors.
Sources:
1 Blackbaud, The Next Generation of American Giving (2018).
2 Fidelity Charitable, The Future of Philanthropy: The Evolution from Charitable Giving to Charitable Living (2021).
PHILANTHROPIC LANDSCAPE REPORT 2021 24INDIVIDUAL GIVING
Most Couples Make Giving
Decisions Jointly
More than half of couples make decisions about their philanthropy together. In cases where one partner makes the giving
decisions, it is slightly more likely that the decision-maker is a woman (15% of couples) than a man (12% of couples).*
* LGBTQ+ individuals comprised 11% of participants in this study. The Lilly School of Philanthropy notes: “This study infers that in an LGBTQ+ household, the
spouse or partner is of the same sex; this is an imperfect method and will not be entirely accurate. In terms of coding for decision-making category, this
means, for example, that if a male respondent indicated he was gay, then the household would be categorized as ‘man decides’ if either the respondent or
his spouse/partner was the sole decider.”
DECISION-MAKING STYLES FOR CHARITY DONATIONS AMONG COUPLES
One partner
decides, 27%
One partner decides
27%
Jointly decide
Jointly
62%decide, 62% Separately
Separately decide
decide, 11%
11%
AVERAGE AMOUNT AN INDIVIDUAL FEELS COMFORTABLE GIVING WITHOUT
CONSULTING THEIR PARTNER, BY CHARITABLE DECISION-MAKING STYLE
Separately decide $1,180
Man decides $901
Woman decides $311
Jointly decide $239
Dive Deeper
Some female donors report feeling overlooked when fundraisers direct conversations to a male
partner. Learn more about strategies for engaging women donors in our article “Who Funds the World?
Girls: How Nonprofits Can Avoid Overlooking the Value of Women Donors."
Source: IUPUI Lilly Family School of Philanthropy, Women Give 2021: How Households Make Giving Decisions (2021).
PHILANTHROPIC LANDSCAPE REPORT 2021 25INDIVIDUAL GIVING
Donors Expect to Return to
Pre-Pandemic Volunteering Levels
Two studies of philanthropic individuals by Fidelity Charitable, though not representative of the U.S. population overall,
provide a glimpse into how the COVID-19 pandemic has affected volunteering.
HOW VOLUNTEER TIME CHANGED EXPECTATIONS FOR VOLUNTEER
DURING COVID-19 TIME AFTER COVID-19
45%
73% 27%
21%
23%
11%
Return to the amount of time I
Increased Stayed the same volunteered before the pandemic
Decreased Stopped entirely Continue to volunteer the amount of
time I am now
Amid pressing public health threats, more than half of donors decreased their volunteering or stopped volunteering
altogether during the COVID-19 pandemic but 73% of donors expect to return to their previous level of engagement.
CCS Insight
As the world re-emerges from the COVID-19 pandemic, donors will be eager to re-engage
with the nonprofits closest to their hearts. Dedicated outreach to donors who have lapsed
their volunteering during the pandemic can yield positive results.
Source: Fidelity Charitable, The Role of Volunteering in Philanthropy (2020).
PHILANTHROPIC LANDSCAPE REPORT 2021 26INDIVIDUAL GIVING
Volunteering Positively Correlates with
Donating to Charity
Volunteers tend to be strong prospects for fundraising programs. Approximately 30% of American adults volunteer.1 Of those
who volunteer, nearly 80% also donate money to charity. Thirty-nine percent (39%) of volunteers in Fidelity’s survey said they
are likely to begin volunteering with an organization before donating, while 53% said they take the reverse route.2
SEQUENCE OF VOLUNTEERING AND DONATING
Among philanthropic individuals who have ever volunteered
8%
I support a nonprofit financially, then
volunteer there
53% I volunteer at a nonprofit, then make a
39% donation
I do not make donations to the
organizations where I volunteer
In comparison to older age groups, Millennials are more likely to say they increase their giving to an organization as a result of
volunteering there.
EFFECT OF VOLUNTEERING ON GIVING LEVELS
Millennials 33% 63% 4%
Gen X 21% 75% 4%
Baby Boomers 12% 83% 5%
All Generations 18% 77% 5%
I give more than I would if I didn't volunteer
I give the same amount as I would if I didn't volunteer
I give less than I would if I didn't volunteer
Sources:
1 Corporation for National and Community Service, “Volunteering in America” (2018).
2 Fidelity Charitable, The Role of Volunteering in Philanthropy (2020).
PHILANTHROPIC LANDSCAPE REPORT 2021 27INDIVIDUAL GIVING
Collective Forms of Giving Are Becoming
More Prominent
Collective giving groups, such as giving circles and pooled funds, allow individuals to consolidate their donations and
award grants to various philanthropic causes.1 After a decade of strong growth, collective giving groups have continued
to increase in number throughout 2020 amid the COVID-19 pandemic, calls for racial justice, and widespread discussions
about democratizing philanthropy.2
Like crowdfunding campaigns (as discussed on page 54), collective giving groups tend to attract diverse participation in terms
of age, income, gender, and race.1 Especially among collective giving groups established in the past year, many funds focus on
granting for social justice causes.2 Giving circles are often started by members of marginalized communities including women,
people of color, and LGBTQ+ individuals.3
NUMBER OF GIVING CIRCLES OVER TIME4
3,000
2,000
500
50
1995 2010 2020 2025 (projected)
Philanthropy Together estimates that today there are more than 2,000 giving circles in the U.S. with approximately 150,000
members and $1.3 billion donated.5 The organization projects that giving circles will continue to grow in number over time
to reach 3,000 groups by 2025.4 In addition to giving circles, pooled funds augment today’s collective giving landscape in
terms of dollars granted and numbers of groups.
Growth in Pooled Funds, Spurred by Racial-Justice Protests and the Pandemic, Could Last
– The Chronicle of Philanthropy (February 5, 2021)2
“As the volume of calls for racial justice increased and the COVID pandemic upended
philanthropy ... the number of pooled funds ... multiplied rapidly, laying the groundwork for
what could be permanent changes in how billions of dollars in donor money is distributed.”
Sources:
1 Collective Giving Research Group, Giving Circle Membership: How Collective Giving Impacts Donors (2018).
2 Chronicle of Philanthropy, “Growth in Pooled Funds, Spurred by Racial-Justice Protests and Pandemic, Could Last” (2021).
3 Ms. Magazine, “We Are Unstoppable: How Female Philanthropists Are Turning Giving Circles into a Movement” (2019).
4 Philanthropy Together, What Is a Giving Circle? (2021).
5 Philanthropy Together homepage (Accessed July 13, 2021).
PHILANTHROPIC LANDSCAPE REPORT 2021 28INDIVIDUAL GIVING
Future Tax Policy Changes Could
Incentivize More Charitable Giving
In May 2021, the Biden Administration proposed a slate of tax changes that could affect individual giving, including an
increase to individual income and capital gains tax rates.1
For most donors, tax benefits are an incentive, not a motivator, for charitable giving. As discussed on pages 23 and 35,
financial incentives are among the least common reasons people give to charity. However, decades of academic studies and
historical tax data show that donors do respond to incentives like the ability to itemize charitable deductions.2
Since the Biden Administration is proposing tax increases to high-earning individuals, charitable giving may become more
attractive to wealthy donors.3 This is because the greater the tax rate is, the more tax savings a donor can realize by deducting
charitable giving.
As of July 20, 2021, no new tax policies have been passed by Congress and the proposals could change during the legislative
process. CCS will continue to update our website with resources and guidance for nonprofits as the Biden Administration’s tax
proposals develop further.
CCS Resource
Dive deeper into CCS perspectives on how potential tax policy changes may affect charitable
giving and how fundraisers should prepare in our article “Tax Policy Changes and Charitable
Giving: What Fundraisers Need to Know.”
Sources:
1 Department of the Treasury, General Explanations of the Administration’s Fiscal Year 2022 Revenue Proposals (2021).
2 Giving USA Foundation, Giving USA: The Annual Report on Philanthropy for the Year 2019 (2020).
3 The Wall Street Journal, “The Surprising Relationship Between Taxes and Charitable Giving” (2015) and New York Times, “Biden Aides Quietly Say His Tax Increases Would Help Charities” (2021).
PHILANTHROPIC LANDSCAPE REPORT 2021 29High Net
Worth Giving
Capgemini defines a high net worth individual (HNWI)
as a person with investable assets valued at $1 million
or more, excluding primary residence, collectibles,
consumables, and consumer durables.1 As charitable
giving becomes increasingly concentrated among
wealthier households in the United States, understanding
and engaging high net worth donors can yield
tremendous return on investment for nonprofits.
1 Capgemini, World Wealth Report 2021 (2021).
30HIGH NET WORTH GIVING
High Net Worth Individuals Increased
Their Wealth in 2020
The U.S. population of high net worth individuals (HNWIs, those with investable assets of more than $1 million, excluding
primary residence, collectibles, consumables, and consumer durables) grew by 12% in 2020 to reach appoximately 6,575,000
people.1 The number of very high net worth individuals (VHNWIs, those with a net worth between $5 million and $30 million)
grew by 8% in 2020 to reach about 1,045,865 people.2 The population of ultra high net worth individuals (UHNWIs, those
with a net worth above $30 million), also increased by 8% in 2020 to reach about 101,240 people.3
Moreover, in the first ten months of the COVID-19 pandemic, the U.S. minted 46 new billionaires. The collective wealth of
America’s 660 billionaires was $4.1 trillion as of January 2021, representing a 38.6% increase since March 2020.4
THE U.S. IS HOME TO…
4% 39% 27%
of the world’s of the world’s of the world’s
population5 millionaires6 billionaires7
SEVEN OF THE TOP TEN CITIES FOR VHNWIS ARE IN THE U.S.2
122K
81K
67K 60K
43K 43K 37K 35K 33K 33K
CCS Insight
Even amid a turbulent year, the U.S. population of high net worth individuals (HNWIs) increased
in number and collective wealth in 2020. As an increasingly large share of charitable giving comes
from the most affluent households, the wealth of HNWIs represents an opportunity for nonprofits
to sustain more support for their missions.
Sources:
1 Capgemini, World Wealth Report 2021 (2021).
2 Wealth-X, Very High Net Worth Handbook 2021 (2021).
3 Wealth-X, World Ultra Wealth Report 2021 (2021).
4 Forbes, “American Billionaires Have Added More than $1 Trillion in Wealth During Pandemic” (2021).
5 U.S. Census Bureau, “U.S. and World Population Clock” (2021).
6 Credit Suisse, Global Wealth Report 2021 (2021).
7 Wealth-X, The Billionaire Census 2020 (2020).
PHILANTHROPIC LANDSCAPE REPORT 2021 31HIGH NET WORTH GIVING
Giving by Top
Philanthropists PHILANTHROPY 50 MEMBERS,
BY TOP CAUSES SUPPORTED
Reached New
Heights in 2020 42% of donors on the list supported either
Higher Education, Healthcare, or Financial
Aid as their top cause.
The Chronicle of Philanthropy compiles a list of those who
give the most through publicly announced gifts over the Higher Education 23%
course of a year. This year’s Philanthropy 50 list contained Healthcare 11%
53 members due to ties in giving amounts. The 53 donors
cumulatively gave $24.7 billion.
Financial Aid 8%
Environmental 4%
Like philanthropy in America at large, giving from this list
is concentrated among the biggest of the big donors. Homelessness 4%
This year’s top five donors—Jeff Bezos, MacKenzie Scott, Neuroscience 4%
Michael Bloomberg, Philip and Penelope Knight, and Jack
Dorsey—cumulatively gave $20 billion, 80% of the total.
Artificial Intelligence 2%
Clean Water 2%
College-Loan Debt 2%
PHILANTHROPY 50 MEMBERS,
Economic Development 2%
BY AMOUNT OF 2020 GIVING
Human Services 2%
Nursing 2%
Pandemic Relief 2%
9%
Performing Arts 2%
34%
Racial Justice 2%
25%
Religion 2%
53 DONORS Multiple Cause Areas 28%
TOTAL
Some subsectors attracted donations from
these top donors at levels unseen in previous
years. In particular, Historically Black Colleges
32% and Universities (HBCUs), hunger relief,
and social justice organizations received
newfound attention.
>$1B $100M toHIGH NET WORTH GIVING
Technology Fortunes Dominate the
Philanthropy 50 List
The ever-increasing prominence of technology in today’s world is reflected in the Philanthropy 50 list. Nearly one-third of the
list members trace their wealth to technology.1 The Philanthropy 50's dominant sources of wealth have evolved over time; in
2000, ten members made their fortunes in media and entertainment.2 In the most recent list, only four members did.1
PHILANTHROPY 50 MEMBERS*, BY SOURCES OF WEALTH
* Multiple sources of wealth are possible, meaning some donors are double-counted.
16
9 9
5 4 3 3 2 2 1 1 1 1 1 1 1
The 53 donors are distributed across 21 states. California is by far the most well-represented location on the list, with 20
members residing in the state.
PHILANTHROPY 50 MEMBERS, BY STATE OF RESIDENCE
3
1
5
1 1
2
1 1
1
1
20 2
1
2
1
1
1 1
5
1
1
Sources:
1 The Chronicle of Philanthropy, “The Philanthropy 50” (2021).
2 The Chronicle of Philanthropy, “Billion-Dollar Giving Streak Shows New Sense of Urgency Among Top 50 Donors” (2020).
PHILANTHROPIC LANDSCAPE REPORT 2021 33HIGH NET WORTH GIVING
Most Ultra Wealthy Individuals
Have Self-Made Fortunes
SOURCES OF WEALTH
Very High Net Worth Individuals Ultra High Net Worth Individuals
(VHNWIs - $5M-$30M)1 (UHNWIs - $30M+)2
4.7% 7.4%
11.6%
20.1%
83.7% 72.5%
Inherited Self-made Inherited & self-made
Most VHNWIs and UHNWIs are self-made. As has been discussed throughout the media,3 the term “self-made” does not
necessarily indicate that these individuals were without privileges that aided their buildup of wealth, but rather that the
source of their fortune is not inherited money.
CCS Insight
Identifying as “self-made” can affect how high net worth donors see themselves and interact with nonprofit
organizations, as shown in a qualitative study of 20 self-made HNWIs conducted by the Leadership Story Lab.4
In interviews, these individuals felt that the label “wealthy” represented values that they didn’t adhere
to, and often abided by a concept of “stealth wealth”—avoiding showing off wealth and maintaining middle-
class values. They described feeling alienated by charities that sought to engage them with flashy events and
slick presentations. Though this study is not representative of all self-made HNWIs, the findings underscore a
core tenant of fundraising: taking a personalized and empathetic approach to donor relations is essential.
Sources:
1 Wealth-X, Very High Net Worth Handbook 2021 (2021).
2 Wealth-X, World Ultra Wealth Report 2021 (2021).
3 Forbes, “Here’s What Forbes Means By Self-Made: From Bootstrappers to Silver Spooners” (2018).
4 Leadership Story Lab, Transforming Partnerships with Major Donors (2021).
PHILANTHROPIC LANDSCAPE REPORT 2021 34HIGH NET WORTH GIVING
Affluent Donors Are Motivated
by Making a Difference for Missions
As discussed on page 23, donors of all income levels often report being motivated to give to charity by the impact
that their gift can have.
This focus on altruistic motivations is evident in the U.S. Trust Study of High Net Worth Philanthropy’s survey of
affluent donors. It is worth noting in today’s policy environment that tax benefits rank near the bottom of factors
influencing affluent philanthropy.
HOW OFTEN CHARITABLE DECISIONS ARE MADE
BASED ON CERTAIN FACTORS
Sometimes Always
Belief in the mission of the organization 40% 54% 94%
Belief that the gift can make a difference 51% 42% 93%
To support the same causes/organizations year after year 54% 34% 88%
When asked 82% 5% 87%
To give back to the community 63% 24% 87%
Personal satisfaction or fulfillment 54% 32% 86%
Spontaneously in response to a need 76% 9% 85%
To remedy issues affecting you or those close to you 63% 14% 77%
To honor someone 64% 10% 74%
To receive a tax benefit 51% 17% 68%
Political or philosophical beliefs 48% 17% 65%
To set an example for future generations 48% 11% 59%
Religious beliefs 32% 25% 57%
When on the board and volunteering for the organization 31% 15% 46%
Belief that leaving too much money to heirs is not good 16% 4% 20%
.
“Affluent” vs. “High Net Worth”
The data on this page applies to both high net worth individuals (defined in this study as those with a
net worth of at least $1 million or more, excluding primary residence) and individuals with an annual
household income of at least $200,000, who may or may not also be considered high net worth.
Throughout the remainder of this section, “affluent” refers to individuals who fit either of these criteria.
Source: Bank of America and IUPUI Lilly Family School of Philanthropy, U.S. Trust Study of High Net Worth Philanthropy (2018).
PHILANTHROPIC LANDSCAPE REPORT 2021 35HIGH NET WORTH GIVING
A Personalized Approach Resonates
with Wealthy Individuals
As described on the previous page, affluent donors’ overall charitable decisions are influenced by a multitude of factors,
principal among them a belief in a mission and an ability to make a difference.
When choosing a specific organization or cause to support, wealthy donors report that alignment with their personal values,
interests, and experiences are important influences on their selection.
FACTORS THAT LEAD TO CONTRIBUTING TO A
PARTICULAR CAUSE OR ORGANIZATION
Alignment with personal values 74%
Interest in issue area 57%
First/secondhand experience
benefiting from organization
54%
Nonprofit is recognizable or reputable 50%
Perceived need of organization or issue area 49%
Association with another institution 26%
Nonprofit report rankings 18%
Endorsement, recommendation,
or pressure from a friend/social circle
10%
Compelling pitch (in-person or collateral) 9%
CCS Insight
After a donor gives, it is vital to steward the relationship and demonstrate the difference that their
individual gift makes. The U.S. Trust Study of High Net Worth Philanthropy found that 54% of donors
do not know if their gift is having the impact they intended, suggesting an opportunity for nonprofits
to prioritize communicating the effect of a donor’s own gift.
Source: Bank of America and IUPUI Lilly Family School of Philanthropy, U.S. Trust Study of High Net Worth Philanthropy (2018).
PHILANTHROPIC LANDSCAPE REPORT 2021 36You can also read