POLITECNICO DI TORINO - Webthesis
←
→
Page content transcription
If your browser does not render page correctly, please read the page content below
POLITECNICO DI TORINO
                Collegio di Ingegneria Gestionale

                  Master of Science in
           ENGINEERING AND MANAGEMENT

             Master of Science Thesis
 STUDY ON THE AUTOMOTIVE CAR INDUSTRY IN
 INDIA: SCENARIO ANALYSIS AND NEW FUTURE
             BUSINESS MODELS.

Academic Supervisor

PROF. LUIGI BENFRATELLO

                                                    Candidate

                                   HARDIK BHARATBHAI DESAI

                                                    (S250004)

                         October 2020

                                                     1|Page
ACKNOWLEDGMENT

First and foremost, with due respect, I would like to express my sincere gratitude
to Professor Luigi Benfratello, for assistance in the completion of my thesis, for
continuous support on my thesis patterns, patient guidance, and motivation. He
helped me and gave constant support in the completion of my dissertation.

Secondly, I also place on record to the city of Turin and my friends here in
Politecnico di Torino, who has given me full cooperation through this master
studies, and my professors, who guided for being supportive of my work.

Last but not the least, I would wish to acknowledge my Indian friends and family
for supporting me through my entire master’s studies. Especially, I would like to
thank my parents for encouragement and love. It is not easy for me to pen down
my thanks, who helped me directly or indirectly in this dissertation.

આભાર - धन्यवाद - Thank you - Grazie

                                                             Author

                                              HARDIK BHARATBHAI DESAI
                                                 (s250004@studenti.polito.it)

                                                                        2|Page
ABSTRACT

The Indian Automotive Car Industry, it is one of the major industries, as it is the
fastest growing industry in the world as it has a strong democracy and global
partnership.
In this scenario, the demand is increasing day by day in this country to raise the
small car market in India. India is developing the 5th largest economy in the world
and India holds the US $2.94 trillion nominal GDP and the US $10.51 trillion
GDP (PPP).
Later after the Indian government’s successes and impulsivity economic growth
program focusing on economic policy in 1991, the automotive industry has
drifted along. In consideration of the consequence of the sector at the world level,
the current analytical research was conducted to analyze the latest updates and
patterns to deliver inventory based on Porter’s five forces model. Through
economic and industrial reforms, the automotive car industry with low energy
consumption has rendered it in attractive destination for worldwide automotive
manufacture which is combined with an increase in per capita and expendable
income of the working workforce.
However, the research indicates that the overall competitiveness of the Indian
Automotive car industry in the current context can be considered as moderate.
Consequently, the estimation for the expected growth rate in upcoming years and
opportunities in the fragmented Indian rule market with supportive government
initiatives, the desired aspect will decrease on a large scale.

                                                                         3|Page
Contents
  ACKNOWLEDGMENT ................................................................................... 2

  ABSTRACT ....................................................................................................... 3

  LIST OF FIGURES ........................................................................................... 6

  LIST OF TABLES ............................................................................................. 7

Chapter 1. The Economy: The Republic of India ............................8
  1.1 Introduction: An overview of India. ............................................................ 8
    1.1.1 Political structure. ...................................................................................................... 8

    1.1.2 Governmental size by major Indian states ................................................................. 9

    1.1.3 A Brief History of the Indian economy. .................................................................. 12

  1.2 Economic Profile of India. ......................................................................... 15
    1.2.1 Top Developing sectors of the Indian Economy. .................................................... 22

    1.2.2 Strength, Recent Development, and Future Aims. .................................................. 25

    1.2.3 Opportunities and Challenges. ................................................................................. 29

    1.2.4 Impact on the current economic situation due to Coronavirus ................................ 31

    1.2.5 Forecasting of future growth scenario. .................................................................... 32

Chapter 2. Evolving Car industry ...................................................34
  2.1 Automotive Car Industry: An Overview ................................................... 34
    2.1.1 A short timeline of the Global Automotive Car Industry in the world.................... 34

    2.1.2 History of Indian Automotive Car Industry ............................................................ 38

    2.1.3 Indian Automobile clusters and Top ten companies in India .................................. 40

  2.2 The Current Situation of the Automotive Car Market in India. ................ 45
    2.2.1 The Present Scenario of the Car segment Industry in India. ................................... 45

    2.2.2 The Indian Mission Plan is an evolving car industry. ............................................. 46

    2.2.3 Slowdown of the Car Industry ................................................................................. 47

                                                                                                                      4|Page
Chapter 3. Overall market demand in the Indian car industry. ..49
  3.1 Development and Future Prospects of the Car industry. ........................... 49
    3.1.1 Global Car sales of market growth .......................................................................... 49

    3.1.2 Car Sales trend in the Indian market. ...................................................................... 50

    3.1.3 Car industry attractiveness analysis in the Indian Market. ...................................... 56

    3.1.4 Future trends of Investment in the Car Industry in India. ....................................... 58

    3.1.5 Key Success Factor and SWOT Analysis of the Car Industry. ............................... 59

    3.1.6 Automotive components of suppliers and used car market in India........................ 60

Chapter 4. Automobile Car Business in India................................63
    4.1.1 Indian governmental policy evolves towards new future implementations ............ 63

    4.1.2 Self-drive of the Rental Car business ...................................................................... 64

    4.1.3 Car-sharing business ................................................................................................ 65

    4.1.4 Luxury Car business ................................................................................................ 66

    4.1.5 Revolution of Eco-Friendly Business: Electric Car Mobility ................................. 69

    4.1.6 Mergers and acquisitions ......................................................................................... 72

Chapter 5. CONCLUSION & SUGGESTIONS. ...........................75

Bibliography .......................................................................................77

Webography .......................................................................................81

Acronyms and Abbreviations...........................................................83

                                                                                                                 5|Page
LIST OF FIGURES
Figure 1: The map of India’s Gross state domestic product (GSDP) ...................................... 11
Figure 2: India’s annual GDP growth rate from 2000 to 2018. .............................................. 17
Figure 3: India’s annual GDP growth rate by constant price from 2001 to 2020. .................. 18
Figure 4: India’s inflation rate by average consumer prices from 2000 to 2020. ................... 18
Figure 5: India’s total employment by sector-wise from 2015 to 2019. ................................. 19
Figure 6: India’s unemployment rate from 1991 to 2019. ...................................................... 20
Figure 7: Total trade of India’s Export & Import by year wise. .............................................. 21
Figure 8: India’s Manufacturing as a share of GDP from 2011-12 to 2017-18. ..................... 24
Figure 9: India’s Current Account Balance per percent of GDP by year wise. ....................... 32
Figure 10: Forecasting India’s GDP growth rate per percent at year wise. ............................. 33
Figure 11: Forecasting India’s inflation rate at year wise........................................................ 33
Figure 12: Total car production in different countries in 2019. ............................................... 36
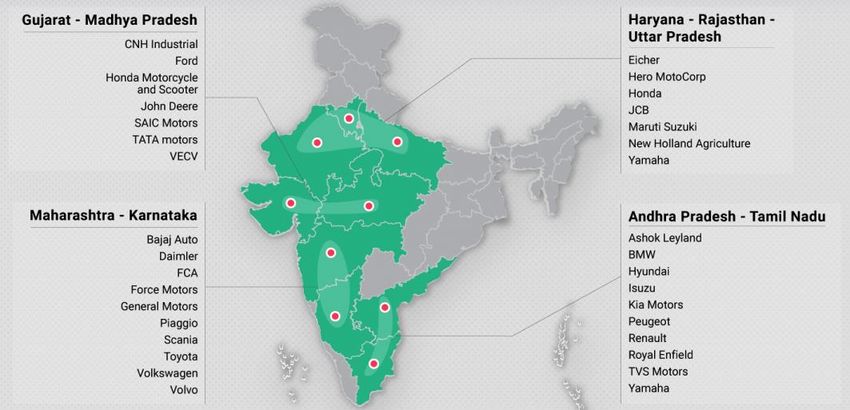
Figure 13: Automobile clusters in India .................................................................................. 40
Figure 14: Market share of an Indian passenger vehicle by different companies from 2019 to
2020.......................................................................................................................................... 44
Figure 15: Domestic Market Share of different vehicles from 2019-20. ................................ 46
Figure 16: Total number of New car sales all over the world from 2005 to 2019................... 49
Figure 17: Market share by segment from 2017 to 2018 ......................................................... 50
Figure 18: The total number of car sales in India from 2005 to 2019. .................................... 50
Figure 19: Production, domestic sales, and export data from 2019 to 2020. ........................... 51
Figure 20: Car sales data by segment-wise from May 2019 to May 2020. ............................. 52
Figure 21: Top 25 Selling Cars by the successful models in India from May 2019 to May 2020.
.................................................................................................................................................. 54
Figure 22: India’s fuel-based type of Car sales in 2019. ........................................................ 56
Figure 23: Porter’s five forces analysis of the car industry in India ........................................ 57
Figure 24: Size of Indian auto component industry. ................................................................ 60
Figure 25: Comparison between new cars and used car market sales performance. ............... 62
Figure 26: Forecasting revenue of the Indian car rental business from 2017 to 2024. ............ 64
Figure 27: Forecasting revenue of the Indian carsharing business from 2017 to 2024. .......... 66
Figure 28: Sales of the luxury car market in India from 2007 to 2019. ................................... 67
Figure 29: Luxury car OEM sales trend in India. .................................................................... 68
Figure 30: The overall oil consumption and spending on the import of crude oil................... 69
Figure 31: Individual carbon footprint comparison between petrol car and electric car ......... 70
Figure 32: EV assessment framework ..................................................................................... 71
6|Page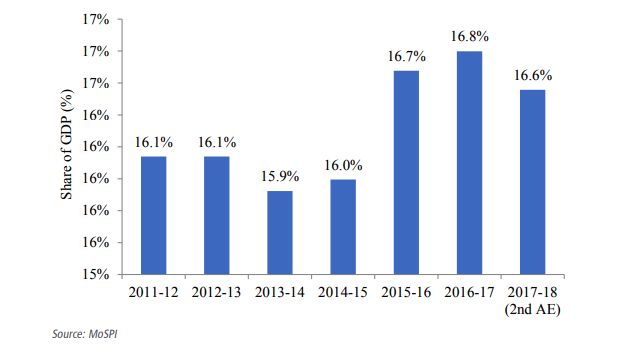
LIST OF TABLES

Table 1: Overall performance and economic profile of India from 1990 to 2018. .................. 16
Table 2: Total FDI inflow of India by financial year............................................................... 22
Table 3: The table of the top 20 global car manufacturing companies in the world. .............. 37
Table 4: Emission standards in the Indian car industry. .......................................................... 39
Table 5: India's top 25 models of car to export all over the world from 2018-19 to 2019-20.
.................................................................................................................................................. 53
Table 6: The top 14 OEMs car sales from 2018 to 2019. ........................................................ 55
Table 7: The top ten luxury cars with a price estimate in India ............................................... 68
Table 8: Comparison of the performance characteristics of an ICE and an electric car .......... 72

                                                                                                                                  7|Page
Chapter 1. The Economy: The Republic of India
1.1 Introduction: An overview of India.
The Republic of India is situated in the southern part of Asia and is located to
share borders with China, Nepal, Bhutan, Bangladesh, and Pakistan. India’s
currency is the Indian rupee (INR) as an official. India’s natural resources are
iron, coal, manganese, bauxite, mica, barite, limestone, thorium, diamonds,
titanium, and crude oil.
India is the oldest civilizations of the Indus valley with large landscapes, great
heritage sites, and dynamic culture. Indian stable democracy comprises 80
percent Hindu people, 14 percent Muslim, and the remaining 6 percent Christians,
Sikhs, Buddhists, and Jains.
It has an ample English-speaking population and majorly exports in IT services
and software workers. It has the best education system with advanced medicine,
science, and mathematics. It is an attractive country for strategic investment in a
vast range of industries with supportive governments. The main key is the youth
of this country because of the powerful driver for demand and ample source of
workers. The young generation is trying for growth and change in India. It has
mainly industries such as agriculture, iron, steel industry with the manufacturing
sector.
Indian prime minister Narendra Modi took office in 2014, to promote India’s
foreign policy to evolve economic relationships with global partnerships. Then in
2019, he was re-elected with a high margin victory in India.
1.1.1 Political structure.
India is a federal republic of democracy with a parliamentary arrangement of
administration mostly similar to the UK based model. India has a union of 29
8|Pagestates and 6 centrally administered territories. As per the Indian constitution, the
country obtained independence on 15 august 1947, and the Indian constitution
was issued on 26 January 1950. The constitution proffers one citizenship for the
entire nation to right vote after 18 years of age or older.
The central government’s duty involves inter-state relations, foreign affairs,
national security, poets and railways, national highways, trade, and commerce. it
regulates rule-setting over business access, trade, investment and defense, and
financial services. The state’s government has the power of law and order, health,
police, education, electricity, and water. It regulates business licenses and social
infrastructure, roads, electricity, water, schools, and healthcare facilities.
1.1.2 Governmental size by major Indian states
The top individual tax rate is 30.9 percent with education tax and 32.4 percent the
top corporate tax rate. The tax burden is 7.3 percent of domestic income. The
Indian government spent 27.1 percent of the country's GDP in the last three years.
Budget deficits have amounted to 6.9 percent of GDP with 69.8 percent of public
debt.
According to, the Indian state's economic output is based on economic surveys
2016-2017 and 2017-2018.
● 60 percent economic contribution by 8 states such as the capital New Delhi,
Andhra Pradesh, Gujarat, Kerala, Karnataka, Tamil Nadu, and Uttar
Pradesh.
● 70 percent of exports of Indian states are Gujarat, Maharashtra, Karnataka,
Tamil Nadu, and Telangana.
● 50 percent GST tax collected from 5 states of Maharashtra, Tamil Nadu,
Gujarat, Karnataka, and New Delhi.
India’s top 10 states of a major role in the economy.
● Delhi NCR
Delhi NCR is not only the central government headquarters in New Delhi. NCR
has a healthy customer base-New Delhi’s per capita income which is nearly three-
fold the national average. It consists of a quarter of FDI inflows into India. It is
9|Pagealso a considerable hub that holds several financial zones and industrial groups,
such as the Gurugram and Noida IT services centers and the Faridabad and Alwar
production hubs.
● Gujarat
Gujarat is India’s fifth-largest state economy and its strong economic execution
has been primarily focused on infrastructure development, accountability for the
public service, fiscal consolidation, and business regulations streamlining. It is
per capita income which is 40% more than the national average, however, the
home of Prime Minister Modi, receives tremendous national coverage.
● Maharashtra
India’s second populated district and most economically developed state,
consequently Maharashtra's Gross State Domestic Product (GSDP) grew up 7.3%
annually in five years over the year 2017 and the district accounted for 31% of
FDI inflows from the year 2000-2017.
● Karnataka
Karnataka is India’s technical enabled, significantly growing state, where it
complements the strengths in innovation such as ICT, healthcare, nanotech, and
start-ups. Moreover, it complements urban infrastructure, life sciences, and water
management as well. Bengaluru the state capital is India's Silicon Valley, home
to the world’s fourth-largest technology cluster. Apart from being IT-enabled
services, biotechnology, and pharmaceutical sectors, it is the epicenter as well.
● Tamil Nadu
Tamil Nadu is the second state in India, which provides the highest economy and
facilitates the opportunity in manufacturing, water supplies, and urban
infrastructure. Moreover, the state is India’s major producer of agriculture and
has the highest per capita income and best indicators for health. Chennai, the state
capital which is known as ‘Detroit of India’, and is the center of Indian
automotive and product manufacturing center and one of the top 10 automotive
hubs in the world.
10 | P a g e● Andhra Pradesh
Andhra Pradesh is the leading state in terms of business ranking and there is an
11% per annum increase in the state’s GSDP over three years to 2017. The
attraction of the city is the construction of a greenfield capital city that attracted
the majority of foreign players and offered an opportunity to metropolitan
employees. The state which holds the highest per capita income and is being
developed as a new fintech hub is the port city Visakhapatnam.
Figure 1: The map of India’s Gross state domestic product (GSDP)
Source: Data from the Ministry of statistics and program implementation.
● West Bengal
India’s third most populous state ‘WEST BENGAL’ is titled as the regional hub
for mining and METS interaction, including as the gateway to Jharkhand,
11 | P a g eChhattisgarh, and Odisha minerals-rich state. Kolkata’s state capital, which is
India's third-largest megacity, outbreaking as a center of development and home
to Indian oil. it forecasts to be in Asia’s top 10 fastest developing cities by 2021.
● Punjab
Punjab gives vast opportunities in agricultural business, as it produces an
agriculture powerhouse that produces 16% of India’s wheat, 11% of rice, and a
huge contribution to dairy products. More than 80% of the state is under intensive
farming and commodity prices per hectare are around twice the national average.
● Telangana
India’s upcoming state Telangana, which is India’s one the leading economies
with an annual growth of 9.5%per annum ever past three years to 2017, which
has capability along with its biotech, health, and energy, financial services, and
innovation. However, it is the Sixth largest metropolis city of India and the home
of major companies such as Google, Apple, Facebook, and Microsoft.
● Uttar Pradesh
Uttar Pradesh is India's biggest state which is over 220 million which leads to
national politics and 3rd largest state economy through agriculture. Agra which
produces most of the cultivation, which includes cotton, dairy, and flour
industries. However, it is the least developed state.
1.1.3 A Brief History of the Indian economy.
Since the independence Indian economy has been a mixed economy with a lower-
middle-income level. Independence of time, India had 17 percent literacy, with
32.5 years of life expectancy. India is also called Bharat and Hindustan. India is
more diverse from linguistic, food, geographical, and religious with 1.37 billion
the high population with 28 states and 8 union territories. It has 17 percent of the
12 | P a g epopulation with the second largest population in the world. The country is in
South Asia with the 7th largest country by area.
During British rule (1793 to 1947), India's economy was a supplier of raw
material to the export and import of final products from other countries. The rule
did not measure the capita income and national income of this country. The
economy was mainly dependent on agriculture with an engaged rural 85 percent
population.
From (1947-1991) after freedom of British rule, it commenced primarily by the
Indian national congress party. Nehru was the first prime minister of India, the
Congress party governed by 44 years. Nehru started the economy of the
foundation of this country with the cooperation of Sardar Patel, was a powerful
deputy prime minister. Both endeavored to make a self-sufficient economy and
achieved Indian companies into the competition. At that time, he regulated some
industries and Indian railways, mining, and the western education system. Indian
companies did evolve strongly under the new government. In that era, income
and growth rate was low at 1.3 percent between 1950 to 1990 with 54 percent
literacy.
The government replaced the rule minimum age for marriage to 18 years of age.
In this country, there were macroeconomic crises due to supply from internal and
external. There were two wars, the India-china war in 1962, the India-Pakistan
war in 1965.
In the 1970s, banks and major trades held nationalized and increased top income
tax 98 percent, 3.5 percent wealth tax. from 1969 to 1977, Indira Gandhi declared
a new policy to abolish poverty (Garibi Hatao policy) with planning a providence
for the poor. But the poverty ratio did drop at all until 1983. The growth rate was
4.4 percent a year from 1970 to 1980. Then it accelerated to 5.5 percent in 1990.
In 1991, India's main trading partner was the Soviet Union, it was collapsed with
the gulf war, so it augments oil prices with a result of the balance of payment
crisis for India. At that time, India took bailout loans from the international
monetary fund (IMF) as the US $1.8 billion.
13 | P a g eIn 1991 reformations, the Indian government reformed with a new policy of
economic liberalization and mainly concentrated on restrictive trade. They sold
some non-profit businesses such as banks, airlines, and oil companies and
proposed investment with foreign trade. After that many companies came to
invest in India such as Pepsi, General motors. India's growth rate had a steady
GDP growth with 5,86,212 crore rupees in 1991. From 1991 to 1996, the annual
growth rate was picked high from 1.057 to 7.55 GDP. that five years were most
important to increase the number of industries.
The first phase of growth, from 1991 to 2003, was with an acceleration average
GDP of 5.4 percent a year. In the second phase with high growth, 2004 to 2008,
it was rapid global growth. In 2005, US President Bush and Indian prime minister
Manmohan Singh agreed to work on civilian nuclear energy and outer space
cooperation then the USA passed that bill in 2008 but at that time GDP of India
was 3.087 lower. The Indian economy entered on difficult times from 1997 to
2003, to slow to 5.7 percent GDP. then GDP growth lifted over 9 percent per year
from 2005 to 2008. 2010-2011, there were more problems such as corruption,
high bank losses, and electricity theft, a more specific environment, and land
clearances.
In 2015, the new government of India faced the worst problems to achieve a
growth rate of 7.5 percent. So, India has enhanced the fastest-growing economy
in the world to have competition with china. It is a more prominent computer
software and business services sector to evolve the export sector, carrying the US
$110 billion with a growth of 7.5 percent from 2015 to 2016. The automotive
industry was highly protected for decades and became a global hub in India to
have more production and design in small cars.
In 2016, Gross Service Tax and demonstrations were applied to the economy to
implement the money circulation. So, it directly impacts the economy in 2017,
with slow growth. The gross tax revenue is US $168 billion, and the US $38.3
billion income tax in 2019. Indian companies raised the US $114 billion to help
768 initial public offers (IPO) in 2019. FDI equity inflows stood at the US $436.4
billion from 2000 to 2019, with a high contribution in computer software and
hardware, service, automobiles, trading, construction, telecommunications.
14 | P a g e1.2 Economic Profile of India.
Today, India is the fastest-growing economy in the world because it has powerful
democracy and global partnerships. The Indian economy is now developing the
5th largest economy in the world in 2019. India has the US $2.94 trillion nominal
GDP and the US $10.51 trillion GDP (PPP), it has the third rank in purchasing
power parity. India has 1.3 billion of the high population with a 7.3 percent
growth rate in 2018, to increase by 7.5 percent in 2019. The rate of overall literacy
is 74 percent.
The economy’s strength is mainly dependent on exports, agriculture, higher
savings rates, and middle-class households. The recent government is more
focused on “Make in India” in the manufacturing sector and digital India, startup
India program.
In the agricultural production, it is the largest producer of milk, millets, ginger,
bananas, mangoes, papayas, and cottonseed with the second-largest producer of
tea, sugarcane, wheat, onions, potatoes, rice, and garlic. The agriculture and
industry and services sectors are growing at 2.8, 2.5, and 6.9 percent as per
individual. The employment rate was 93.1 percent in 2018.
The National Statistical Office (NSO) released an advance growth rate of 5
percent at GDP constant market price with the gross value added (GVA) 4.9
percent in 2019-2020. On 31 January 2020, NSO rated real GDP growth 6.1
percent with gross saving (current market prices) at 30.1 percent from 2018 to
2019, and 7 percent real GDP growth, 32.4 percent gross saving from 2017 to
2018. The constant prices are expected to continue stable at 10.5 percent with
final consumption expenditure and gross fixed capital formation at 1 percent from
2019 to 2020. The Indian nominal GDP growth rate is 12 percent in 2019-20, and
11.5 percent for 2018-19. India has shown remarkable performance in the global
market. The growth has continued to slowly grow in the last few years. The
economy of global growth has been predicted to be more moderate.
Foreign exchange reserves achieved for the US $418 billion foreign exchange
reserves with the US $390 billion foreign currency assets, US $23 billion gold
assets. From 1998 to 2019, average foreign exchange reserves are US $221
million reserves. Indian Tourist destinations are better for international visitors
15 | P a g ewho visited 15.54 million to contribute 6.7 percent in annual growth rate in 2017.
The gross tax revenue is US $168 billion, and the US $38.3 billion income tax in
2019. Indian companies raised the US $114 billion to help 768 initial public offers
(IPO) in 2019. FDI equity inflows stood at the US $436.4 billion from 2000 to
2019, with a high contribution in computer software and hardware, service,
automobiles, trading, construction, telecommunications.
Economic Profile: India
Indian Economy (Financial Year) 1990 2000 2010 2018
GDP (current US $ billions) 320.98 468.39 1,675.62 2,718.73
GDP growth (annual percent) 5.5 3.8 8.5 6.8
Inflation, GDP deflator (annual percent) 10.7 3.6 10.5 4.1
Agriculture, fishing, and forestry (percent of GDP) 27 22 17 15
Industry and value-added (percent of GDP) 27 27 31 27
Exports of (goods and services by percent of GDP) 7 13 22 20
Import of (Goods and services by percent of GDP) 8 14 27 24
Gross capital formation (percent of GDP) 29 27 40 31
Revenue, Excluding grants (percent of GDP) 12.4 11.7 13.2 12.9
(+) Net lending/ (-) Net borrowing (Percent of GDP) -3.4 -3.8 -3.5 -1.9
Table 1: Overall performance and economic profile of India from 1990 to 2018.
Source: Data from the world bank group.
Gross Domestic Product (GDP)
According to the world bank group, in the GDP movement, in 2000, the annual
GDP was 3.8 percent than in 2003, peaking at 7.86 percent GDP. in 2008, the
GDP was 3 percent lower. From 2009 to 2010, it was high at 8.4 percent in 2010.
after that from 2011 to 2016, it reached 8.17 percent in 2016. In the last 2 to 3
16 | P a g eyears, it continually declined to 7.1 to 6.8 from 2017 to 2018. The growth of the
GDP rate is estimated at 5 percent in 2019 and 6.8 percent in 2018.
Figure 2: India’s annual GDP growth rate from 2000 to 2018.
Source: Data from the world bank group.
According to the ministry of statistics and program implementation, India's GDP
of constant price was 4.94 percent GDP than it continually grew at 9.8 percent in
2007. So, it dropped by 3.8 percent in 2008 but after that, it reached a maximum
of 10.26 in 2010. From 2011 to2016, The GDP constant price gradually
moderates at 6.6 to 8.2 percent but after that, it continually declined from 7.0 to
1.8 percent from 2017 to 2020.
17 | P a g eFigure 3: India’s annual GDP growth rate by constant price from 2001 to 2020.
Source: Ministry of Statistics & Program Implementation.
Inflation
The economy survey 2019-20 data presented in the parliament by the union
minister for finance and corporate affairs of India. CPI (Consumer Price Index)
inflation has increased from 3.7 to 4.1 from 2018-19 to the 2019-20 period. WPI
(Wholesale Price Index) inflation has decreased from 4.7 to 1.5 from 2018-19 to
the 2019-20 period.
Figure 4: India’s inflation rate by average consumer prices from 2000 to 2020.
Source: Ministry of Statistics & Program Implementation.
Inflation is estimated as average consumer prices to 3.8 percent in 2000. But then
it continually increased to 12.31 percent in 2009. After that, it decreased in the
last 9 years to 3.34 percent in 2020, according to data from the ministry of
statistics and program implementation.
Employment
India has 3 largest startups based in the world from 8900 to 9300 startups. In
2019, 1300 startups are starting with 160 to 170 million labor force by 2020. The
agriculture sector had the highest labor force with employment 45.6 percent in
2015. But then every year, it continued to decrease by approximately 1 percent,
42.38 percent in 2019. The industry sector had 24.05 percent of employment in
2015 than it increased to 25.57 in 2019. The service sector is the most important
18 | P a g esector at 30.26 percent in 2015 compared to rose 2 percent in 2019. Overall, the
industry and service sector are raised in the last five years, so the result of the
labor force is moved to getting employment in the city area.
Figure 5: India’s total employment by sector-wise from 2015 to 2019.
Source: Data from the world bank group.
Unemployment impacts on the economy
It is directly connected to the rising poverty problem and the young generation
will join illegal and unsuitable activities for money to engage high crime into the
nation. Without any job, people omit faith in democratic values, and they will be
addicted to drugs, suicide, alcohol so the nation will lose manpower. For example,
if unemployment increases 2 percent then it influences GDP to decrease by 4
percent.
According to the world bank’s data, India’s unemployment average rate is
estimated at 5.6 percent by the world bank group from 1991 to 2019. First, we
can see that the unemployment rate increased to 5.36 percent in 2019, but a less
rate of 5.33 percent in 2018. The highest rate is reported at 5.72 percent in 2003
and the lowest rate of 5.28 in 2008.
19 | P a g eFigure 6: India’s unemployment rate from 1991 to 2019.
Source: Data from the world bank group.
Export & Import
According to the Ministry of Commerce, India’s overall exports in 2019-20 are
estimated to be the US $263 billion. Overall imports are estimated at US $403
billion with the US $667 billion total trade in 2019-20. The highest trade achieved
in 2018-2019 was the US $844 billion. The lowest trade was the US $658 in 2016-
17.
In 2020, major exports are electronics goods to 32.81 percent, drugs &
Pharmaceuticals to 12.37 percent, petroleum products to 2.9 percent, organic and
inorganic chemicals to 2.5 percent, cotton yarn, and handloom products to 2.21
percent. India has main export partners such as the United States of America,
Japan, China, UAE, Indonesia, and the European Union.
Major imports are gold to 31.52 percent, coal and coke to 24.41 percent, organic
and inorganic chemicals to 11.98 percent, pearls and precious to 6.16 percent,
electronics goods to 4.66 percent.
20 | P a g eFigure 7: Total trade of India’s Export & Import by year wise.
Source: Ministry of Commerce & Industry.
(FDI) Foreign Direct Investment
India has Forex reserves of US $ 476.09 billion with US $ 491.64 billion value
of exports in February 2020, according to data from the Reserve bank of India.
Foreign companies invest to take advantage of lower wages and tax exemptions.
FDI equity inflows were the US $36.8 billion, to invest $6.52 billion in the service
sector in 2019.
As per countries, during 2019-2020, the FDI equity inflows are estimated
maximum from Singapore at the US $11.65 billion, Mauritius at the US $7.45
billion, Netherlands at the US $3.53 billion, Japan at US $2.80 billion, USA at
the US $2.79 billion.
Recently, some major companies wanted to invest and already invested such as
amazon investment is estimated to be the US $1 billion investment goal in small
and medium businesses to create 1 million jobs in 2025. In 2020, Mastercard
planned to invest the US $1 billion in India to enhance research and development.
In 2019, the French oil and gas giant invested a 37.4 percent stake in Adani Gas
Ltd of US $810 million. Reliance industries invested in India's biggest deal to
Saudi Aramco will take a 20 percent stake at the US $75 billion in 2019. And
21 | P a g eFacebook announced a 9.99 percent stake in Reliance JIO platforms at the US
$5.7 billion in 2020.
S. Financial Year FDI Equity Inflow Total FDI Inflow
No.
1 2014-2015 29.74 45.15
2 2015-2016 40 55.56
3 2016-2017 43.48 60.22
4 2017-2018 (P) 44.86 60.97
5 2018-2019 (P) 44.37 62
(P) data is provisional (Amount in the US $ billion)
Table 2: Total FDI inflow of India by financial year.
Source: Reserve Bank of India (RBI).
The Cumulative FDI equity inflows are 456.79 billion from 2000 to 2019. As per
investment share in FDI equity inflows, 6% UK, 7 % Japan, 31 % Mauritius, 21
% Singapore, 7 % Netherlands, 6 % USA, 3 % Germany, 2 % Cyprus and France
and UAE. FDI, India had more than 100 IPO from 2018 to 2019.
1.2.1 Top Developing sectors of the Indian Economy.
• Agriculture sector
Agriculture is the rudimentary sector in India. It contributes 14.6 percent of the
gross domestic product and offers 43 percent employment. In products, there are
mainly products of wheat, rice, corn, tea, potatoes, sugar cane, cotton, and millet.
Gross value added is 8.8 percent of agriculture, forestry, and fishing with the US
$266 billion in 2019. The sector is 6th largest in the Indian food and grocery
market, 5th largest in food production in the world.
22 | P a g eIn the growth of agriculture, the sector has been increasing from -0.2 to 6.3
percent from 2014 to 2016 then it dropped to 2.8 percent in 2019. GVA
contribution had decreased from 17.7 percent to 15.2 percent from 2013 to 2017.
With doubling, farmers’ income would challenge some issues like credit,
investment, and insurance coverage.
• The industry sectors
Industry sector growth is estimated to be 2.5 percent in 2019-2020 but 6.9 percent
growth and share of GVA 29.6 percent in 2018-2019. It accounts for 26 percent
of GDP. The main energy source is coal, which is the third-largest producer in
the world. The chemical industry is the second number in the world. The industry
sector is estimated to grow 0.6 percent as an index of industrial production (IIP)
in 2019-2020, a 5 percent growth in 2018-2019. The main steel sector was 5.2
percent in 2019-2020, 3.6 percent growth in 2018-2019. India registered a total
of 1.1943 billion telephone connections in 2019.
• Manufacturing sector
The manufacturing sector has evolved with high growth compared to the past
years. Indian prime minister Narendra Modi had launched the “Make in India”
program to evolve manufacturing hubs in India. In 2020, It is expected to reach
its goal as the 5th largest manufacturing country in the world. It has a goal to
create 100 million jobs with 25 percent GDP share by 2022. In 2018, the sector
employed 24 percent of the manpower.
With the Make in India program, India will have that opportunity to boost the
economy because it has many companies under the process set up of hi-tech
manufacturing such as GE, HTC, Siemens, Toshiba, and Boeing. By these setups,
it will increase consumers' purchasing power. The manufacturing sector is
predicted to develop at 2 percent during 2019-2020
In 2020, Italy-headquartered tecnocap has announced a 75% share recently to
enter India with JV Tecnocap oriental. Oriental company is based on packaging
producers with a joint venture to set up a plant in Mumbai.
23 | P a g eFigure 8: India’s Manufacturing as a share of GDP from 2011-12 to 2017-18.
Source: Data from the Ministry of statistics and program implementation.
Indian railways are also more focused on the Make in India program. It has a high
speed own manufactured locomotive high-speed engine. The stronger Indian
manufacturing sector is more linked to global business, especially to foreign
intermediate goods for exporting to the world. The manufacturing sector creates
more Indian jobs. India has an opportunity to build hubs as foreign companies.
• The service sectors
The service sector is the most important part of the Indian economy because it
contributes 49 percent GDP and offers 32 percent employment. The software
sector is boosting export and import services with major exporter IT modernizing
India.
It is significant in the Indian economy to augment with 55 percent total size of
the economy and GVA growth, ⅔ of FDI inflows, and 38 percent of total exports.
According to the ministry of statistics and planning implementation, the sector
remained to moderate 6.9 to 7.7 percent GVA from 2018 to 2020.
The service sector is predicted to grow 6.9 percent in 2019-2020, 7.5 percent in
2018-2019. The sector contributes 55.3 percent in Indian GVA in 2019-2020. The
24 | P a g emain sub-sectors are trade, hotels, transport, financial and real estate services, and
communication & service. The share of this sector is increasing with 3.5 percent
in 2018.
1.2.2 Strength, Recent Development, and Future Aims.
The Strength of India
● Unity is the main strength of India. It's difficult to manage with different
languages and cultures with 28 states and 8 union territories. It is an
evolving superpower of the world because the birth rate is higher, so the
young generation is raising with a wide education system.
● With a vast reservoir of high manpower, it helps to augment investment
and saving to grow the future. It is an attractive country with ample
resources so it has a lower cost of living than developed countries like the
United States so Indians can easily survive with low income.
● Indian demographic is the advantage of market reforms to improve skills
and education to more participating women. It produces a 7 percent output
of the world’s GDP.
● It's a better place for outsourcing. India has an official language of English
the majority of people speak English because the British ruled India for
200 years. The global language of English is more useful for a business-
like call center.
● The main strength is that diverse geographical areas with several efficient,
educated, young high skilled people. The film industry of India is called
Bollywood and it contributes 4.5 billion US$ in GDP.
● Technology is the main advantage. Indian Automotive market has the
largest car producer with the largest motorbike market in the world.
Technology is increasingly having a lot of opportunities in this scenario.
India has the largest number of science and commerce graduates.
● Indian food production is ample for producing food, the second number in
the world. It can produce more food. India is a hub for the global software
business and developed highly advanced technology with the IT sector.
25 | P a g eRecent development
In the development of reforms, it is needed to enhance the economy to require
good governance. In recent years, the Prime Minister of India Mr. Narendra Modi
initiated some new changes in the economy such as Goods and Services Tax
(GST), Startup India, Digital India, and Make in India.
In this economic scenario, there have been many investments in many sectors of
the economy. Mergers and acquisitions increased 53.3 percent with the US $77.6
billion in 2017.
• Goods and Services Tax (GST):
In 2016, The main evolution of GST rates was structured into direct and indirect
tax in 5 slabs such as 0 percent, 5 percent, 12 percent, 18 percent, 28 percent tax
rates. Direct taxes include income tax, registration, stamp duty. Indirect taxes
include Central GST, customs duty, central excise, and VAT. The rates are
applied on slab wise with one nation one tax.
● 0 percent tax rate includes food and certain essential items.
● 5 percent tax rate includes products such as mass production tea, spices,
mustard oil, etc.
● 12 percent tax rate includes food processed items
● 18 percent tax rate includes such items as oil, toothpaste, soaps,
smartphones, etc.
● 28 percent tax rate includes automobile, tobacco products, auto parts,
cement, air conditioners, large tv, etc.
The implementation will make India a common market to grow GDP US $2.5
trillion with a 1.32 billion population to be a big draw for investors.
• Demonetization notes:
In 2016, the government of India announced the demonetization of Indian rupees
500 and 1000 currency notes and applied issuance to give new notes from bank
exchange as per income tax. Then the main purpose is to eradicate counterfeit
notes and stop black money and reduce human trafficking and terrorism funding.
After that, the government estimated 3 lakh crore Indian rupees, which is 20
percent black money to remove from circulation.
26 | P a g e• Digital India:
Digital India is a campaign launched by the government of India in 2015 to
transform rural areas to connect digitally empowered humankind and knowledge
of the future economy. It has nine pillars such as broadband highways, universal
access to phones, public internet access program, E-governance, e-Kranti, IT for
jobs, and an Early harvest program. It includes a digital locker, e-education, e-
sign, and a national scholarship program. In 2018, it had recorded 1.3 billion
population, 1.23 Aadhaar cards (digital biometric identity cards, 1.21 billion
mobile phone users, 446 million smartphones, and 51 percent growth in online
business.
• Startup India:
In 2016, the government announced a startup India program to help in three action
plans such as handholding, funding support, and industry partnerships. It is
playing a rudimentary role in evolving electric mobility, charging infrastructure,
and mobility services to grow opportunities in new business models. The plan is
the 3rd largest ecosystem of startups to evolve 50,000 startups with 12 to 15
percent growth in 2018. It will evolve economic growth and generate high scale
employment.
• Make in India:
The Indian Prime minister gave a clarion call in 2014 to make in India, zero
defect, zero effect policy. The main ultimate objective is to make a renowned
manufacturing hub for the sector. Global companies would be invited to invest
and expand industry in India so Indian people would get talented and skilled
manpower to make zero defect products to boost economic growth. India is
rapidly moving toward electrifying mobility to demand in the global market.
Make in India program is more focused on automotive industries and
components. It is required to increase the purchasing power of an Indian
consumer to boost demand and development. The main goal is that 17 percent
from 25 percent of GDP will contribute to the economy.
27 | P a g eFuture governmental aims
The Indian government of planning and implementing department have
documented the future implement as “Strategy for New India @75”
The main aims are doubling farmers’ incomes, a startup with new talent, boost
make in India product, the goal to get 22 percent tax to GDP ratio and 36 percent
investment rate by 2023
The goal is to make a US $5 trillion economies by 2030 and to reach an 8 percent
growth rate. The prime minister declared that he wanted to make the US $5
trillion economies by 2024. Recently, India is a US $2.8 trillion economy, but it
is more challenging than achievable. Agriculture individual income will double
in the next 5 years because they made a strategy to use maximum technology with
good resources. The government of India wanted to improve agricultural
productivity.
Make in India program is working on the global manufacturing industry to
establish a big export hub. It will create more jobs to boost economic growth and
urge more investment in India. Top sectors with this campaign: Automobile,
general manufacturing, electronics, pharmaceuticals and biotech, heavy
engineering, information technology, metals and metallurgical products, services
sector. The automobile industry is expected from the US $74 billion to reach the
US $300 billion by 2026.
In the union budget 2020, the finance minister announced the basic customs duty
of completely built units (CBU) on electric vehicles will be raised to 40 percent
to exit 25 percent from 2021. The import of electric vehicles will double as per
the ecosystem to protect globally. The country is expected to attract investment
of US $100 billion in oil and gas infrastructure for the next five years and that
agriculture export will reach the US $60 billion by 2022, government approved
US $29.59 million in 2019 to aim for doubling farmers income. Indian want to
spend on the public health care sector at 2.5 percent of GDP by 2025.
The strategy for new India @75, the government wants to implement in many
sectors. Especially in female labor focus participation is 23.7 percent, which will
increase to 30 percent by 2022-23.
28 | P a g eBy 2022-23, India's rail network should be efficient, reliable, and safe, cost-
effective with goods and people to increase capacity and speed in new
infrastructure. It will enhance service delivery to reach on-time arrivals at 95
percent. The young generation level is higher in India because 65 % of the
population is young. So, there are more opportunities to evolve and increase the
working-age population. It could be helpful to enhance the level of demand for
skilled labor. India is focusing more on energy from renewable sources to reach
40 percent energy from non-fossil resources by 2030.
1.2.3 Opportunities and Challenges.
Opportunities:
India has economic opportunities to support education, training, and jobs for
millions of young people. In the last two decades, the working-age population is
increasing to 200 million over 1 billion.
The recent budget of India 2020-2021, is looking at controlling red tape, creating
the best use of technology, making social infrastructure, digital India, pollution-
free India, makes in India, job creation in every sector. The strategy of Make in
India program into the industrial base and manufacturing export to play a key role
to enhance theory position in the global market.
After the global world trade war with China, the Indian economy has a chance to
work as a second option after competition from China, especially in the
manufacturing sector and India has the capabilities and resources in IT and digital
requirements. Indian economic growth and development of the government need
to enhance infrastructure in transport and power networks.
India has an opportunity to obtain a huge market in agricultural products because
it has top producers in many agricultural products to increase export by reducing
tariffs, improving warehousing, and cold storage.
E-commerce and digital payment sectors are growing rapidly in India, to attract
investors from the global market. So online business will be beneficial to Indian
companies to create more jobs in e-commerce.
29 | P a g eAs per the economic survey, the Indian Airline industry will grow airport
capacities and aircraft. Airports are to be made more than 100 operational and
520 new aircraft by 2023-24. So advance airports proffer more employment
opportunities.
Challenges:
Economic performance is strong, but challenges continue the same. There are
many challenges to tackle future opportunities.
● Population, Poverty level, and Health system.
The population is facing poverty due to more competition between reach and poor
people. Twenty-two percent population is under the poverty level. The birth rate
is increasing rapidly due to a lack of control over delivery and no awareness in
backward people. Poverty is the main challenge in India because the population
is surviving under $2 per day with 69 percent of the population. It impacts a
different way to people as child labor, malfunction, lack of education, some
harmful diseases.
Health care is needed to improve for massive scale training and high quality of
treatment. For example, due to coronavirus, more critical care is needed for
requirements such as insufficient ventilators, sanitizers, masks, and scrub suits.
● Development of skill and creation of jobs for future manpower.
The unemployment rate is increasing day by day in India. According to the world
economic forum’s report ‘The future of jobs 2018’, the demand for skilled
workers is more required in the next years so reskilling is required to meet that
talent of demands.
Skill development is the main challenge because of low productivity and weak
human capital of a high percentage of workers are low skilled.
India faces new challenges in health and sustainable life, so it is alarming rates of
harmful pollution to connect global warming in India. It would be free pollution,
healthy quality of life, and high healthcare support.
30 | P a g e● Corruption and women protection
In 2019, the corruption perceptions index (CPI) is ranked 41 scores more corrupt.
India is facing high corruption levels, which should be handled quickly and
wisely in both the private and public sectors. The economy has the most serious
challenge inequality and pending justice, so it reduces women’s participation rate
and crime has increased in the last five years.
● Global warming impacts due to pollution
Climate change impacts on the standard of living of humankind, more than 600
million people face water shortages, 40 percent of the population will have no
availability of drinking water by 2030. Pollution and environmental issues are
more challenging in India because of the degradation of land, loss of biodiversity,
depleting natural resources, traffic, and heavy construction.
1.2.4 Impact on the current economic situation due to Coronavirus
The financial year 2020, from 25 March, the government enforced a total 66 days
lockdown in India till 31 May 2020, due to COVID-19. It is the worst economic
scenario to impact the economy. Every country is facing the same problem.
Recently, due to coronavirus, prime minister Mr. Narendra Modi announced an
economic package of US $283.73 billion, which is almost 10 percent of India’s
GDP.
According to the Asian Development Bank forecasts a 4 percent growth rate with
1.5 billion financings from ADB to India. Economic activities are stopped so
unemployment will increase in large amounts due to higher migration labor. The
government announced a US $6.5 billion emergency fund to the informal sector.
The Indian economy is suffering an economic crisis from coronavirus due to
health emergencies. So, the IMF and the world bank expected India’s growth rate
between 1.5 to 3 percent with a 1.9 percent expansion in 2020.
The governmental forex reserves are emptying because most exports are denied
to all countries due to risk so there is an uncertain future for Indian industries. It
has been applied to reduce operations and shut down, to decrease employment
numbers
31 | P a g e1.2.5 Forecasting of future growth scenario.
Figure 9: India’s Current Account Balance per percent of GDP by year wise.
Source: Asian Development Outlook 2020, ADB
The above graph represents India’s Current balance. In 2014 Nation’s economy
was decreased by 1.3 percent, however, the economy increased by 0.5 percent till
the year 2016, then in 2017 GDP was decreased by 1.9 percent which shows a
huge loss for the nation. Over three years till 2020 GDP was decreased by 1.0
percent each year.
32 | P a g eFigure 10: Forecasting India’s GDP growth rate per percent at year wise.
Source: Asian Development Outlook 2020, ADB
The above graph replicates the GDP Growth rate percent for five years until 2021.
Here, in 2017 the GDP Growth Rate was 7 percent, however, then the growth rate
was decreased by 1 percent each year till 2020. Lastly from 2020, the GDP
Growth was suddenly increased from 4.0 to 6.2 percent which is a sign of positive
growth for the nation’s GDP.
Figure 11: Forecasting India’s inflation rate at year wise.
Source: Asian Development Outlook 2020, ADB
The above graph shows Inflation which shows the purchasing value of money
flow. However, from the above graph in 2017, inflation was 3.6 percent which
was decreased by 2 percent in the next year. Consequently, in 2019 the inflation
was suddenly increased from 3.4 to 4.7 percent and then was a sudden fall in
money development by 1.7 percent in 2020. However, in 2021 India’s economy
showed development and the economy increased from 3.0 to 3.8 percent.
33 | P a g eChapter 2. Evolving Car industry
2.1 Automotive Car Industry: An Overview
2.1.1 A short timeline of the Global Automotive Car Industry in the world.
An automotive car is the biggest creation in the past for allowing fasting mobility
in the world. In the past, before the car invention, it had transportation as carts
and horse carriages for people and goods. but engineers worked on that same
design horse carriage then improved the frame of the vehicle.
In 1672, it was the first model created as a form of toy. It was a steam engine with
a 65 cm long scale model by the Chinese emperor. cars were into the global
market to use in the 20th century because developed countries depended on that
market. In 1806, it was the first car with an internal combustion engine as fuel. In
1886, modern cars came into the market by German inventor Karl Benz as per
Benz’s patent of Motorwagen, so Germany is the birth destination of cars and he
gave a four-stroke cycle petrol engine to the world. In 1888, Karl Benz and his
wife took their first road trip by car and proved the first invention for cars.
A four-stroke diesel engine was invented by Rudolf Diesel. In that era, battery-
electric cars were begun by Hungarian AnyosJedick, who invented electric
motors and Gaston Plante invented the lead-acid battery in 1859. In Rochester,
New York, the first car design was made by George Selden in 1877 as an
American car of internal combustion engines.
From 1899 to 1911, FIAT (the Fabbrica Italiana Automobili Torino) was
established by Giovanni Agnelli and many investors. the company opened a
factory with 150 workers at Turin, Italy. They produced 24 cars and after some
years, the company has had many brands such as Maserati, Ferrari, Fiat, Alfa
Romeo, the Chrysler Group, and many more. During that 19th century, Benz was
the largest company in the world to produce 572 units in 1900 than at the end of
this century, many companies started to come to America and Europe. But at that
34 | P a g etime cars were expensive to have a few rich people. At that time, middle-class
people could not buy their cars. So, after that manufacturing units were increased
in Europe and America to reduce costs in the production line. Ransom Olds
founded affordable automobiles an Oldsmobile factory in 1902. In 1903, Henry
Ford established the Ford motor company and sold 1700 cars in the first year. In
1939, Mercedes Benz introduced the first diesel car, which was 260-D. In 1963,
Lamborghini was established by Ferrico lamb, which was popular in high-end
sports cars.
In 1920, General Motors became the world's first largest automotive
manufacturer and. After that three giant companies that had 90 percent in the US
market, they were General Motors, Daimler Chrysler, Ford. In that year, The USA
manufactured 2.3 million cars. In 1929, the USA produced 90 percent of the
world's cars. The first Volkswagen model was launched by the German labor
front in 1937. General Motors sold 44 percent of total car sales in the USA in
1941.
the eponymous company was established by Enzo Ferrari to manufacture racing
cars in 1946. Then after 2 years, the first ignition key was invented by Chrysler,
which was a new starter button to start the car and, they evolved a new four-wheel
disc brake system and power steering system from 1949 and 1951. German and
American engineers invented airbags in cars for safety purposes in 1951.
In 1966, Toyota sold 40 million cars of corolla models, which was the best-selling
car in the world, and they started to collaborate with Yamaha for the 2000GT
supercar. In 1970, World car production was 28 percent USA, 18 percent Japan,
15 percent Germany, and 9.3 percent France. In 1980, Volkswagen launched
Audi Quattro with a turbocharged engine and four-wheel drive. world’s first
navigation system launched by Honda, alpine electronics, and Stanley electric
company then Mazda launched a GPS navigation system in the first production
of the car in 1990.
from 1997 to 2000, the first mass-produced hybrid car launched by Toyota with
a fuel-efficient car then smaller cars had more revenue in that era. From 2001 to
2003, three technologies added in-car features like the first hands-free Bluetooth
kit, reversing camera, and automatic car parking.
35 | P a g eYou can also read


