Prediction of left ventricular ejection fraction changes in heart failure patients using machine learning and electronic health records: a ...
←
→
Page content transcription
If your browser does not render page correctly, please read the page content below
www.nature.com/scientificreports

                OPEN             Prediction of left ventricular
                                 ejection fraction changes in heart
                                 failure patients using machine
                                 learning and electronic health
                                 records: a multi‑site study
                                 Prakash Adekkanattu 1*, Luke V. Rasmussen 2, Jennifer A. Pacheco 2, Joseph Kabariti 1,
                                 Daniel J. Stone 3, Yue Yu 3, Guoqian Jiang 3, Yuan Luo 2, Pascal S. Brandt 4, Zhenxing Xu 1,
                                 Veer Vekaria 1, Jie Xu 1,5, Fei Wang 1, Natalie C. Benda 1, Yifan Peng 1, Parag Goyal 1,
                                 Faraz S. Ahmad 2 & Jyotishman Pathak 1

                                 Left ventricular ejection fraction (EF) is a key measure in the diagnosis and treatment of heart failure
                                 (HF) and many patients experience changes in EF overtime. Large-scale analysis of longitudinal
                                 changes in EF using electronic health records (EHRs) is limited. In a multi-site retrospective study
                                 using EHR data from three academic medical centers, we investigated longitudinal changes in
                                 EF measurements in patients diagnosed with HF. We observed significant variations in baseline
                                 characteristics and longitudinal EF change behavior of the HF cohorts from a previous study that is
                                 based on HF registry data. Data gathered from this longitudinal study were used to develop multiple
                                 machine learning models to predict changes in ejection fraction measurements in HF patients. Across
                                 all three sites, we observed higher performance in predicting EF increase over a 1-year duration,
                                 with similarly higher performance predicting an EF increase of 30% from baseline compared to lower
                                 percentage increases. In predicting EF decrease we found moderate to high performance with low
                                 confidence for various models. Among various machine learning models, XGBoost was the best
                                 performing model for predicting EF changes. Across the three sites, the XGBoost model had an
                                 F1-score of 87.2, 89.9, and 88.6 and AUC of 0.83, 0.87, and 0.90 in predicting a 30% increase in EF,
                                 and had an F1-score of 95.0, 90.6, 90.1 and AUC of 0.54, 0.56, 0.68 in predicting a 30% decrease in EF.
                                 Among features that contribute to predicting EF changes, baseline ejection fraction measurement,
                                 age, gender, and heart diseases were found to be statistically significant.

                                 Abbreviations
                                 EHR	Electronic health records
                                 HF	Heart failure
                                 EF	Left ventricular ejection fraction
                                 HFpEF	Heart failure with preserved ejection fraction
                                 HFrEF	Heart failure with reduced ejection fraction
                                 HFmrEF	Heart failure with mid-range ejection fraction

                                 Left ventricular ejection fraction (EF) is a critical measurement used in the diagnosis, prognosis, and treatment
                                 of patients with heart failure (HF). It compares the ratio of amount of blood pumped out to the total blood in
                                 the left ventricle of the heart. Historically, patients with HF have been categorized into two phenotypes based
                                 on their EF measurements: heart failure with reduced ejection fraction (HFrEF) with an EF value less than
                                 50%, and heart failure with preserved ejection fraction (HFpEF) with an EF value equal to or greater than 50%.
                                 However, in recent years researchers have been exploring the characteristics and outcomes of a third borderline

                                 1
                                  Weill Cornell Medicine, New York City, NY, USA. 2Northwestern University, Chicago, IL, USA. 3The Mayo Clinic,
                                 Rochester, MN, USA. 4University of Washington, Seattle, WA, USA. 5University of Florida, Gainesville, FL,
                                 USA. *email: pra2008@med.cornell.edu

Scientific Reports |   (2023) 13:294                | https://doi.org/10.1038/s41598-023-27493-8                                                1

                                                                                                                                           Vol.:(0123456789)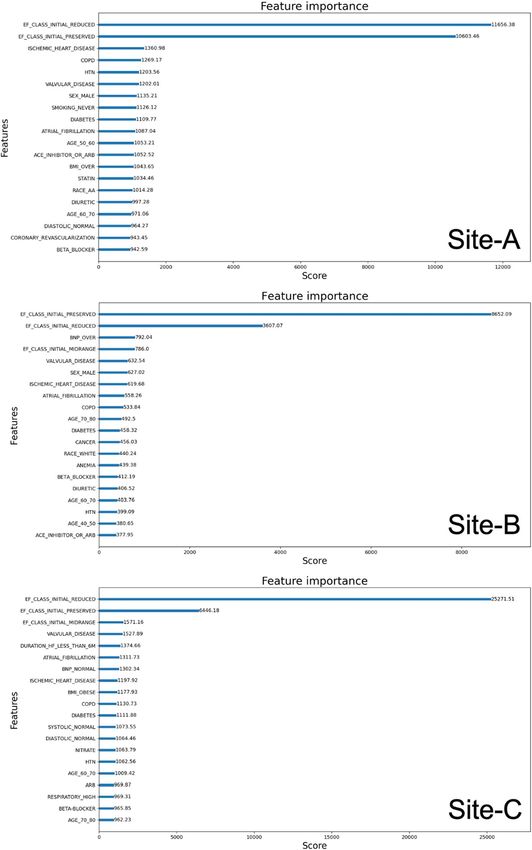
www.nature.com/scientificreports/
category called heart failure with mid-range ejection fraction (HFmrEF) with EF between 40 and 49% per the
United States guidelines and between 41 and 49% per European g uidelines1,2. Recent studies on HFmrEF patients
showed some important distinctions from those patients with HFrEF and HFpEF3. All three phenotypes have
been characterized by different pathologies4–6. Clinical practice guidelines recommend repeated EF measure-
ments when there is a clinical change or a need to assess response to t herapy7. US guidelines now recommend a
fourth subphenotype of HFimpEF for those patients with a previous EF ≤ 40% and a follow-up measurement of
EF > 40%1. Observation of longitudinal EF change has been reported to be an important factor in the prognosis
and treatment options of HF8,9. An increase in EF correlates with improved long-term prognosis in patients with
dilated cardiomyopathy10. Conversely, EF reduction is an important indicator of poor outcomes in those with
drug-induced congestive H F11. Understanding the clinical implications of serial changes in EF may help guide
the frequency of measurement, anticipate individual patient responses to evidence-based therapy, and augment
existing risk model calculators.
Several studies have reported on the etiology, pathophysiology, and clinical characteristics of patients in HF
subphenotypes based on their EF assessment at diagnosis12. A few studies have reported on EF changes that
occur over time in patients diagnosed with HF13,14. By studying patients with two or more EF measurements
in a HF registry, Savarese et al. recently analyzed the prevalence, prognostic implications, and predictors of
all-cause mortality and/or HF hospitalizations in relation to EF changes14. Clinical trials have demonstrated
an improvement in EF in some patients with HFrEF in response to the use of medications such as β blockers15.
However, follow-up in these patients is often limited, and data is limited in studying changes in EF over time in
patients with HFpEF13. While these studies support the hypothesis that serial EF measurements have predictive
prognostic value, none of them have (1) been performed in a large patient cohort with an extensive number
of clinical events, (2) featured a systematic approach to timing of EF measurements, (3) employed a consistent
method of EF assessment, or (4) investigated changes in EF by race or s ex16.
The widespread adoption of electronic health records (EHR) has raised the possibility of using such data in
clinical research. Unlike data acquired in clinical trials, which is robustly collected but often limited in scope
and specific to certain research objectives, EHR data represents a patient’s complete health trajectory, including
demographics, vitals, diagnosis, labs, procedures, and medications and their response. This has resulted in a
dramatic increase in clinical research using EHR data, especially for phenotyping and cohort identification17.
There have been some efforts in recent years on HF phenotyping using EHR data18–24. These studies were mainly
focused on identifying a cohort of patients satisfying one or more inclusion/exclusion criteria for HF. The above
studies, however, did not explore HF subphenotypes (HFpEF, HFmrEF, and HFrEF) based on patients’ EF meas-
urements. Similarly, those previous studies investigating EF changes in HF patients were conducted through HF
registry data or site-specific clinical trials involving limited patient c ohorts13,14. Despite the fact that EHR can
support large-scale cohort analysis of HF patients, previously no study has been reported investigating changes
in EF using clinical data from EHR. Machine learning (ML) techniques such as regression, clustering, decision
trees, and support vector machines (SVM) can potentially identify patients at high risk for health conditions,
such as heart disease, from EHR d ata25.
In this study, we used EHR data across three academic medical centers in the United States to investigate
longitudinal changes of EF measurements in HF patients. We identified HF phenotypes following a previously
validated algorithm24. We further identified subphenotypes of these HF patients based on EF measurements, and
analyzed various characteristics including demographics, vitals, labs, procedures, and medications to determine
if there are significant differences among these subphenotypes. We developed several machine learning models
to predict EF changes in HF patients over a 1-year follow-up period following an initial EF measurement and
identified major features that contribute to the performance of the prediction models. To the best of our knowl-
edge, this is the first report on using machine learning to predict EF changes across a large cohort of HF patients
from different health systems. We believe these models can form the foundation for any future clinical utility in
accurately predicting changes in EF measurements for HF patients.
Materials and methods
This multi-site study was conducted across three academic medical centers: Weill Cornell Medicine (New York,
NY), Mayo Clinic (Rochester, MN), and Northwestern Medicine (Chicago, IL). We denote these sites as Site-A,
Site-B, and Site-C in randomized order for anonymizing results from individual sites. The study was approved
and the need for individual informed consent was waved by The Weill Cornell Medicine Institutional Review
Board, The Northwestern University Institutional Review Board, and The Mayo Clinic Institutional Review
Board. All methods were carried out in accordance with IRB and Health Insurance Portability and Accountability
Act (HIPAA) guidelines. Weill Cornell Medicine (WCM) and its affiliate hospital NewYork-Presbyterian (NYP)
now use the Epic EHR system in both inpatient and outpatient settings. Previously this was Epic Ambulatory
instance for outpatient care and Allscripts in the inpatient setting from which the data for the current study was
obtained. Information Technologies & Services manages several Microsoft SQL Server databases with regular
data feeds from both outpatient and inpatient EHR systems. The Mayo Clinic uses a Unified Data Platform
(UDP) to provide practical EHR data solutions and create a combined view of multiple heterogeneous data
sources through effective data orchestration. Northwestern Medicine (NM) uses the Epic EHR system in both
inpatient and outpatient settings and has an integrated enterprise data warehouse (EDW) to centralize access
to clinical and ancillary data sources. We coded the target phenotype algorithm and covariates as SQL queries
and retrieved data out of these EHR systems. Echocardiograms from site EHR systems were the main source for
patients’ EF measurements which were available either natively as a structured data element or extracted from
echo reports through natural language processing (NLP). At Cornell, EF measurements were extracted from vari-
ous reports and procedures available in the EHR through NLP. These reports include Echocardiogram (LOINC
Scientific Reports | (2023) 13:294 | https://doi.org/10.1038/s41598-023-27493-8 2
Vol:.(1234567890)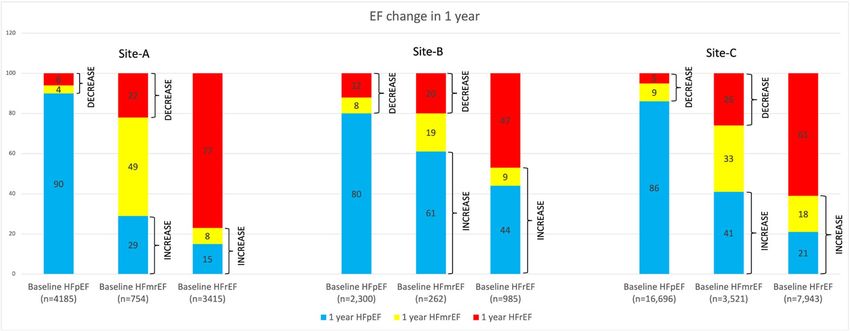
www.nature.com/scientificreports/
codes: 42148-7, 59281-6, 85475-2, 59282-4), MRI abdomen (LOINC: 24557-1, 30668-8), MRI Abdomen-Pelvis
[LOINC: 72246-2], and Myocardial perfusion study (LOINC: 9872-3). Details of the NLP extraction technique
are described elsewhere26,27. The specific method for assessing LVEF varies in these procedures. Over 90% of
EF measurements come from echocardiograms measured using varied methods (e.g. biplane, 3D, visual). Echo
reports often contain both machine readout as well as the physician’s qualitative assessments on EF, and our
NLP system captures both. Also at Northwestern Medicine, EF measurement was done using varied methods
selected by the reader as the most accurate (e.g., biplane, visual, 3D), and was recorded either in clinical notes
or discretely within Syngo. EF measurements not in a structured format were extracted using NLP, and all EF
measurements were normalized to a single database table. At Mayo Clinic, Echocardiogram was the source of
EF measurement. The UDP captures EF measurements as structured and recorded in several tables. In collect-
ing EF measurements at the three sites, we made no distinction between EF measurements recorded during an
outpatient visit and inpatient visit, and treated them as same.
Following a previously validated HF a lgorithm24, our inclusion criteria consisted of: (1) All patients 18 years or
older from 2000 to 2019 (2) Current Procedural Terminology (CPT) code for echocardiogram (93303 to 93355)
(3) International Classification of Disease-Ninth Revision (ICD-9) code diagnosis of HF (any 428.xx) or ICD-10
code diagnosis of HF (any I50*), (4) Either B-type natriuretic peptide (BNP) or pro-BNP (NT-proBNP) values
recorded and (5) Prescriptions for HF within 6 months of diagnosis, as illustrated in Fig. 1. Subphenotypes of HF
were identified by the EF value assessed within 14 days before the first diagnosis of HF by ICD codes (index date).
As shown in Fig. 2, from the base HF population defined above, we further identified patients with at least 2
consecutive EF measurements over a 1-year duration. When the same patient had more than 2 EF measurements
annually, the first and last assessments were considered in order to calculate the change in EF. The index EF was
defined as the first available EF within 14-days before a diagnosis of HF. We took the last EF after 6 months but
less than 12 months from the index EF date as the follow-up EF measurement, allowing a minimum of 6 months
and maximum 12 months interval between the first and last EF measurements. As defined in Table 1 transitions
from HFpEF to HFmrEF and HFpEF to HFrEF, and HFmrEF to HFrEF were pooled and defined as EF-Decrease.
Transitions from HFrEF to HFmrEF, HFrEF to HFpEF, and HFmrEF to HFpEF were pooled and defined as
EF-Increase. Those patients with no change among EF measurements were pooled and defined as EF-Stable.
All baseline demographic and clinical data for HF patients including laboratory data, medications, devices,
and comorbidities were collected from the corresponding EHRs. Clinicians’ ICD-9 and ICD-10-coded diagno-
ses were used to define related comorbidities. While querying the data, wildcard searches were used to capture
broader categories of each disease (full list available in Supplemental Table S1). Smoking status was classified as
‘former’, ‘current’, ‘never’, or ‘unknown’. Arterial diastolic blood pressure (BP), arterial systolic BP, body mass index
(BMI), B-type natriuretic peptide (BNP), diastolic BP, systolic BP, estimated glomerular filtration rate (EGFR),
heart rate, hemoglobin, and respiratory rate were the closest measurements recorded before first HF diagnosis.
We used RxNorm codes or pharmaceutical classes, and subclasses defined within the EHR (Epic) for identifying
medications for ACE inhibitors or ARB, digoxin, platelet inhibitor, nitrate, statin, SGLT2 inhibitor, and string
matching in names for diuretic, beta-blocker, and oral anticoagulant. Baseline characteristics of patients accord-
ing to increasing, decreasing, or stable EF were compared using a Student’s t-test for continuous variables and
chi-square test for categorical variables. All statistical analysis was performed using R version 3.6.128.
The baseline characteristics of patients were then used to develop various machine learning models. Even
though clinicians generally are interested in looking at characteristics of subgroups of patients whose EF
improved (HFrEF to HFmrEF/HFpEF) or declined (HFpEF to HFmrEF/HFrEF and HFmrEF to HFrEF) from
baseline values, we used the entire HF cohort for building the models. The expectation was to develop a general
purpose model to predict EF changes in HF patients regardless of their initial EF, which could then be trained
Figure 1. Heart failure subphenotypes at the three sites. For Site-A there were 1085 (7.7%) patients with no EF
values available.
Scientific Reports | (2023) 13:294 | https://doi.org/10.1038/s41598-023-27493-8 3
Vol.:(0123456789)www.nature.com/scientificreports/
Figure 2. HF patients identified as EF-Stable, EF-Decrease and EF-Increase.
Category Transitions
HFpEF to HFmrEF
EF-Decrease HFpEF to HFrEF
HFmrEF to HFrEF
HFrEF to HFmrEF
EF-Increase HFrEF to HFpEF
HFmrEF to HFpEF
HFpEF to HFpEF
EF-Stable HFrEF to HFrEF
HFmrEF to HFmrEF
Table 1. HF patients defined based on categories of decreasing, increasing and stable EF measurements when
studying longitudinal changes.
Figure 3. Prediction settings for the ML models.
Scientific Reports | (2023) 13:294 | https://doi.org/10.1038/s41598-023-27493-8 4
Vol:.(1234567890)www.nature.com/scientificreports/
and tested for any given subset of patients. As shown in Fig. 3, if t is the time of EF measurement before the first
HF diagnosis, either during an outpatient or inpatient encounter, we used all the data prior to time t in terms
of patient demographics, labs, vitals, comorbidities, and medications for training multiple machine learning
models to predict EF change after 1 year. A patient may have multiple EF measurements before and after a HF
diagnosis. We used the first EF measurement within 14 days before the HF diagnosis as the baseline EF. The
14-day short period between EF measurement and HF diagnosis was chosen to ensure that the diagnosis was
indeed made based on this recent assessment of EF. Some patients may have been missed from inclusion in our
analysis by this strict criterion of 14 days. A 1-month look back window was used for lab measurements, vitals,
comorbidities, and medications. The ML models included Logistic Regression (LR)29, Random Forest (RF)30,
Support Vector Machines (SVM)31, XGBoost32, K-Nearest Neighbor (Knn)33, and Decision Tree (DT)34. All
models were trained to predict EF changes in 10, 15, 20, and 30 percentages of increase and decrease between
the baseline and follow-up values. An EF increase or decrease of up to 30 percent was chosen based on manual
review of select patients. For a HFpEF patient with a baseline EF of 50, a 10 and 30 percent increase in EF would
result in a 1-year follow-up EF of 55 and 65, respectively. For a HFrEF patient with a baseline EF of 30, a 10 and
30 percent increase in EF would result in a 1-year follow up EF of 33 and 39, respectively. Similarly, for a HFrEF
patient with a baseline EF of 30 a 10 and 30 percent reduction in EF would result in a 1-year follow-up EF of 27
and 21, respectively. Such changes are frequently observed in our patient cohorts.
Figure 4 shows the overall strategy we used to develop prediction models. We used a Monte Carlo cross-
validation technique to optimize the performance. The HF cohort across all sites was randomly divided into a
training (80%) and testing (20%) dataset for each run. An initial investigation of the dataset revealed that the
sample is unbalanced between the two classes; patients whose EF values changed by a certain percentage versus
patients whose values remained the same. This observation is also supported by the fact that a significantly
high percentage of patients remained in their baseline category as compared to patients whose values decreased
or increased to other categories as given in Fig. 2. In order to address the imbalance between the classes, the
training dataset was further oversampled with randomly selected copies of minority class members. We used
the sklearn resample method to bring both classes equal. Ten iterations were performed for each outcome to
account for variability among patients in the training and testing datasets. During each run, the training dataset
was once again randomly shuffled and trained through 10 cycles, so that during each cycle the model gets to see
a different order of training samples. The scikit-learn and XGBoost packages were used to implement various
machine learning models. For most cases, we used the pre-built default parameters in scikit-learn and XGBoost.
Various parameters from the corresponding packages used in training the models are provided in Supplemental
Table S2. For all models we used a classification cutoff of 0.5; a score 0.5 and above is a positive prediction and
below is a negative prediction. All models were evaluated in terms of precision, recall and F1-score measures
macro averaged over the positive label (i.e., patients whose EF changed in one direction vs. patients whose EF
values remained stable or changed in the opposite direction). The sklearn function macro computes f1 for each
label and returns the average without considering the proportion for each label in the dataset. An area under
the receiver operating characteristic curve (AUC) was also computed to evaluate model confidence. Features
from the model that performed the best, were ranked ordered based on their variable importance measure.
Data missingness is a challenge for EHR-based analyses. We addressed missing data in the following manner:
Figure 4. ML models’ setup.
Scientific Reports | (2023) 13:294 | https://doi.org/10.1038/s41598-023-27493-8 5
Vol.:(0123456789)www.nature.com/scientificreports/
during the preprocessing step, all continuous variables (such as age, diastolic and systolic blood pressure, BMI,
EGFR, heart rate, hemoglobin, and respiratory rate) were first converted into categorical variables. Then, for
each categorical variable, we created multiple categories in which a patient’s value could fall. For example, in the
case of BMI, we created 5 categories named “BMI_UNDER” for values below 18.5, “BMI_NORMAL” for values
between 18.5 and 24.9, “BMI_OVER” for values between 24.9 and 29.9, “BMI_OBESE” for values over 29.9,
and “BMI_UNKNOWN” for values missing or NULL. This way patients whose values were missing for a given
variable were tagged under the “_unknown” category, and we excluded these “_unknown” categories in building
the model. The expectation was to build a model that can work across EHR systems with available data. Each
category except the “_unknown” becomes a feature with a value 0 or 1 for the vector representation for a given
patient. For age variable the following categories were defined: AGE_BELOW_30, AGE_30_40, AGE_40_50,
AGE_50_60, AGE_60_70, AGE_70_80, AGE_80_90, AGE_90_100, and AGE_OVER_100. For continuous clini-
cal variable we categorized them into categorical variables based on standard clinical practices in the United
States. For example, in the case of EGFR with a measurement unit of “mL/min/1.73 m2”, we defined six categories
EGFR_NORMAL (≥ 90), EGFR_STAGE2 (≥ 60 and < 90), EGFR_STAGE3 (≥ 30 and < 60), EGFR_STAGE4 (≥ 15
and < 30), EGFR_STAGE5 (< 15), and EGFR_UNKNOWN. A total of 62 variables were included in the model
development (see Supplemental Table S3).
In order to gain further insights into the prediction performance of EF changes, feature analysis was per-
formed to determine which features are significant contributors to predicting EF changes in patients. We used
the built-in feature importance function of XGBoost for this. In XGBoost, the feature relative importance can
be measured by several metrics, such as split weight and average gain. We used the feature rankings of weight-
based importance after XGBoost fitting.
Results
As shown in Fig. 1, for Site-A, there were 8,535,377 patients aged 18 years or older in the EHR between the years
2000 and 2019. There were 441,741 patients who had an echocardiogram. There were 50,312 patients with any
HF diagnosis. Refining the criteria for elevation of BNP markers within 6 months of HF diagnosis resulted in
25,347 patients. 27,240 patients were prescribed medication from one of the pharma classes of antihypertensive,
diuretics, cardiovascular, or one of the pharma subclasses of beta blockers or beta blocker combinations. A union
between the above two sets resulted in 14,070 patients that we identified for the HF base cohort, of which only
12,985 patients had EF measurements available. There were 6173 patients with preserved ejection fraction, 1426
patients with mid-range ejection fraction and 5386 patients with reduced ejection fraction at the index date.
For Site-B, there were 2,762,493 patients aged 18 years or older in the EHR between the years 2000 and 2019.
There were 220,493 patients who had an echocardiogram. There were 19,821 patients with any HF diagnosis.
Criteria for elevation of BNP markers within 6 months of HF diagnosis resulted in 12,829 patients. 10,229 patients
were identified as prescribed a medication from one of the drug classes. A union between the above two sets
resulted in 9270 patients that we identified for the HF base cohort. There were 6338 patients with preserved
ejection fraction, 741 patients with mid-range ejection fraction and 2191 patients with reduced ejection fraction
at the index date.
For Site-C, there were 4,767,368 patients aged 18 years or older in the EHR between the years 2000 and 2019.
There were 646,057 patients who had an echocardiogram. There were 144,114 patients with any HF diagnosis.
Criteria for elevation of BNP markers within 6 months of HF diagnosis resulted in 87,328 patients. 98,856
patients were identified as prescribed a medication from one of the drug classes. A union between the above
two sets resulted in 64,475 patients that we identified for the HF base cohort. There were 43,803 patients with
preserved ejection fraction, 7357 patients with mid-range ejection fraction and 13,315 patients with reduced
ejection fraction at the index date.
We performed further analysis on HF patients whose EF values changed within one year. As shown in Fig. 2,
for Site-A, we identified 8354 patients with two or more EF measurements in 1-year. 6186 patients were labeled
as EF-Stable, 845 were labeled as EF-Decrease, and 1323 patients were labeled as EF-Increase. Mean age of this
cohort was 65.6 years and comprised 46% females. For Site-B, we identified 3547 patients with two or more EF
measurements within 1-year. 2356 patients were labeled as EF-Stable, 508 patients were labeled as EF-Decrease,
and 683 patients were labeled as EF-increase. Mean age of this cohort was 65.8 years and comprised 45% females.
For Site-C, there were 28,160 patients with two separate EF measurements within1-year. 20,413 patients were
labeled as EF-Stable, 3209 patients were labeled as EF-Decrease, and 4538 patients were labeled as EF-increase.
Mean age of this cohort was 67.5 years and comprised 35% females.
Figure 5 shows 1-year longitudinal changes in EF values from the corresponding baseline values for HF
patients, across the three sites.
• In Site-A, out of 4185 baseline HFpEF patients, 184 (4%) transitioned to HFmrEF and 246 (6%) transitioned
to HFrEF. Of 754 baseline HFmrEF patients, 217 (29%) transitioned to HFpEF and 169 (22%) transitioned
to HFrEF. And finally, of 3415 baseline HFrEF patients, 281 (8%) transitioned to HFmrEF and 502 (15%)
transitioned to HFpEF.
• In Site-B, out of 2300 baseline HFpEF patients, 178 (8%) patients transitioned to HFmrEF, and 277 (12%)
patients transitioned to HFrEF. Of 262 baseline HFmrEF patients, 53 (20%) patients transitioned to HFrEF,
and 160 (61%) patients transitioned to HFpEF. And finally, of 985 baseline HFrEF patients, 94(9%) patients
transitioned to HFmrEF, and 429 (44%) patients transitioned to HFpEF.
• In Site-C, of 16,696 baseline HFpEF patients, 1497 (9%) patients transitioned to HFmrEF, and 806 (5%)
patients transitioned to HFrEF. Of 3521 baseline HFmrEF patients, 906 (26%) patients transitioned to HFrEF,
Scientific Reports | (2023) 13:294 | https://doi.org/10.1038/s41598-023-27493-8 6
Vol:.(1234567890)www.nature.com/scientificreports/
Figure 5. EF changes in 1 year among HF subphenotypes. Each bar segment shows the proportion (%) of
patients with changes with stable EFs in each category as references.
and 1459 (41%) patients transitioned to HFpEF. And finally, of 7943 baseline HFrEF patients, 1452 (18%)
patients transitioned to HFmrEF, and 1627 (21%) patients transitioned to HFpEF.
Baseline characteristics by EF pattern of change. Table 2 and Supplemental Tables S4, S5, and S6
lists patient characteristics according to an increased, decreased, or stable EF for each of the three sites. Since
EHR systems vary in their reporting and documentation practices, we were not able to report all variables in
a common format. For example, EGFR is documented as a continuous value in Site-B, whereas this is given as
categorical values of Stage 1–4. Same was the case with BNP measurements. While Site-B reported this as an
absolute value, Site-A and Site-C reported this under “Normal”, “Over” and “Unknown” categories. Also for one
of the sites we were able to analyze only a subset of patients (n = 9999) from the initial base HF cohort due to
IRB regulations.
In Site-A, HF patients with increased EF were younger (mean 60.48, sd:15.01) than those patients whose
EF decreased or remained unchanged. HF patients with increased EF also had an average higher heart rate and
diastolic blood pressure compared to the other two categories. BNP and hemoglobin measurements were missing
for the majority of patients. Patients with decreasing EF had a higher prevalence of stroke and atrial fibrillation
(AF) than those with stable or increasing EF.
In Site-B, HF patients with increasing EF were among the youngest. In the overall HF population, the mean
age was 68.4 (sd:14.9) years of age, 45% were female, 65% had HFpEF, 7% had HFmrEF, and 28% had HFrEF.
Lab measurements such as EGFR and hemoglobin levels were missing in the majority of patients. Also, BNP
measurements were missing in 51% of the patient cohort. Among those patients with BNP measurements avail-
able, patients with increasing EF were found to have a higher BNP value compared with patients with decreas-
ing or stable EF. Patients with decreasing EF had higher comorbidities (e.g., hypertension, diabetes, ischemic
heart disease, peripheral artery disease, anemia) than those with stable or increasing EF. Use of ACE inhibitors,
platelet inhibitors, nitrate, statin, and beta blocker were highest among patients whose EF decreased. The use
of diuretics was found more in patients with stable EF than patients with decreasing or increasing EF. The use
of cardiac resynchronization therapy and implantable cardioverter defibrillator was highest in those with stable
EF. The use of beta-blocker is lowest in Site-B. However, given the fact that the p-value (0.1) not statistically
significant and the large proportion of patients without beta-blockers, any possible effect of beta-blockers on
EF change is unclear.
In Site-C, similar to Site-A and Site-B, HF patients with increased EF were younger (mean 64.28, sd:14.51)
than those patients whose EF decreased or remained stable. EF-increase patients had an average higher heart
rate and diastolic blood pressure compared to the other two categories. BNP and EGFR measurements were
missing for the majority of patients. Use of ACE inhibitors, platelet inhibitors, nitrate, statin, and beta blocker
were highest among patients whose EF increased or stable than with patients whose EF decreased. The use of
diuretics was found more in EF-increase and EF-stable patients than EF-decrease patients.
EF change prediction. Table 3 shows the prediction performances of ML models in terms of precision,
recall, F1-score, and AUC in classifying patients with 10, 15, 20 and 30 percent increase in EF versus patients
with stable or decrease in EF from the baseline values. For all models, performance was generally consistent
across all sites. The prediction in terms of precision, recall and F1-score, increases when testing for EF increases
from 10 to 30%. The highest performance was observed at 30% EF increase for all models. Generally high preci-
sions and slightly lower recalls were observed resulting in moderate to high F1 scores. The recall observed at
Site-A is generally lower than that observed at the other two sites. The AUC values were also found to be improv-
ing when predicting EF increases from 10 to 30%, implying all models have higher confidence in predicting
Scientific Reports | (2023) 13:294 | https://doi.org/10.1038/s41598-023-27493-8 7
Vol.:(0123456789)www.nature.com/scientificreports/
Characteristics EF-Decrease EF-Increase EF-Stable
Site-A
n 845 1323 6186
Age (mean (SD)) 65.16 (14.83) 60.48 (15.01) 64.26 (15.20)
Sex (%)
Female 354 (41.9) 497 (37.6) 2844 (46.0)
Male 491 (58.1) 826 (62.4) 3342 (54.0)
Race (%)
Native American/Alaska Native 2 (0.2) 1 (0.1) 19 (0.3)
Asian 27 (3.2) 44 (3.3) 186 (3.0)
Black/African American 186 (22.0) 293 (22.1) 1511 (24.4)
Hawaiian/Pacific Islander 0 (0.0) 2 (0.2) 6 (0.1)
White 539 (63.8) 844 (63.8) 3772 (61.0)
Declined 33 (3.9) 54 (4.1) 250 (4.0)
Other combination 48 (5.7) 72 (5.4) 363 (5.9)
Unknown 10 (1.2) 13 (1.0) 79 (1.3)
Smoking (%)
Current 48 (5.7) 87 (6.6) 405 (6.5)
Former 255 (30.2) 380 (28.7) 1674 (27.1)
Never 273 (32.3) 443 (33.5) 2118 (34.2)
Unknown 269 (31.8) 413 (31.2) 1989 (32.2)
BMI (mean (SD)) 29.82 (10.52) 30.39 (12.86) 40.94 (455.05)
Site-B
n 507 684 2356
Age (mean (SD)) 67.57(15.07) 65.78 (14.84) 69.74(14.51)
Sex (%)
Female 187 (36.9) 270 (39.5) 1147 (48.7)
Male 320 (63.1) 414 (60.5) 1208 (51.3)
Unknown 0 (0.0) 0 (0.0) 1 (0.0)
Race (%)
Native American/Alaska Native 3 (0.6) 3 (0.4) 9 (0.4)
Asian 16 (3.2) 11 (1.6) 64 (2.7)
Black/African American 37 (7.3) 78 (11.4) 220 (9.3)
Hawaiian/Pacific Islander 0 (0.0) 0 (0.0) 4 (0.2)
White 125 (24.7) 156 (22.8) 592 (25.1)
Declined 27 (5.3) 46 (6.7) 148 (6.3)
Other combination 94 (18.5) 102 (14.9) 380 (16.1)
Unknown 205 (40.4) 288 (42.1) 939 (39.9)
Smoking (%)
Current 3 (0.6) 1 (0.1) 20 (0.8)
Former 52 (10.3) 60 (8.8) 280 (11.9)
Unknown 452 (89.2) 623 (91.1) 2,056 (87.3)
BMI (mean (SD)) 28.35 (6.24) 28.07 (6.22) 28.83 (7.10)
Site-C
n 3109 3335 3555
Age (mean (SD)) 67.42 (13.36) 64.28 (14.51) 66.54 (13.77)
Sex (%)
Female 1082 (34.8) 1189 (35.7) 1342 (37.7)
Male 2027 (65.2) 2145 (64.3) 2213 (62.3)
Unknown 0 (0.0) 1 (0.0) 0 (0.0)
Race (%)
Native American/Alaska Native 12 (0.4) 15 (0.4) 19 (0.5)
Asian 28 (0.9) 41 (1.2) 48 (1.4)
Black/African American 113 (3.6) 149 (4.5) 135 (3.8)
Hawaiian/Pacific Islander 5 (0.2) 5 (0.1) 7 (0.2)
White 2875 (92.5) 3027 (90.8) 3243 (91.2)
Declined 16 (0.5) 17 (0.5) 12 (0.3)
Continued
Scientific Reports | (2023) 13:294 | https://doi.org/10.1038/s41598-023-27493-8 8
Vol:.(1234567890)www.nature.com/scientificreports/
Characteristics EF-Decrease EF-Increase EF-Stable
Other combination 44 (1.4) 59 (1.8) 65 (1.8)
Unknown 16 (0.5) 22 (0.7) 26 (0.7)
Smoking (%)
Current 81 (2.6) 134 (4.0) 137 (3.9)
Former 157 (5.0) 214 (6.4) 342 (9.6)
Never 359 (11.5) 359 (10.8) 516 (14.5)
Unknown 2,512 (80.8) 2,628 (78.8) 2,560 (72.0)
BMI (mean (SD)) 30.42 (10.52) 32.08 (32.61) 31.86 (12.19)
Table 2. Patient demographic characteristics at the three sites according to an increased, decreased, or stable
EF.
Site-A
Precision Recall F1-Score AUC
10% 15% 20% 30% 10% 15% 20% 30% 10% 15% 20% 30% 10% 15% 20% 30%
LR 84.7 89.1 93.2 96.5 67.3 67.5 68.1 69.6 75.0 76.8 78.7 80.8 0.75 0.77 0.81 0.85
SVM 86.3 89.7 92.8 96.6 63.3 65.1 69.0 69.9 73.0 75.4 79.0 81.1 0.74 0.77 0.80 0.83
RF 84.1 88.7 93.2 97.1 68.7 68.8 68.3 68.0 75.7 77.4 78.8 80.0 0.74 0.77 0.80 0.83
XGBoost 75.9 79.9 84.1 87.8 81.7 83.6 84.9 86.9 78.5 81.5 84.4 87.2 0.72 0.75 0.79 0.83
Knn 76.8 81.9 86.6 90.9 64.0 65.4 67.8 69.9 69.8 72.8 76.0 79.0 0.66 0.69 0.72 0.76
DT 86.3 89.7 92.9 96.6 63.3 65.2 69.0 69.9 73.0 75.4 79.0 81.1 0.73 0.75 0.79 0.82
Site-B
Precision Recall F1-Score AUC
10% 15% 20% 30% 10% 15% 20% 30% 10% 15% 20% 30% 10% 15% 20% 30%
LR 87.3 91.0 94.6 96.9 82.5 81.1 79.8 82.2 84.9 85.7 86.6 88.9 0.80 0.82 0.85 0.89
SVM 87.4 91.2 94.9 97.0 82.7 80.8 79.3 81.5 85.0 85.6 86.4 88.5 0.79 0.81 0.84 0.89
RF 87.4 91.2 94.8 96.8 82.7 80.8 79.4 83.2 85.0 85.7 86.5 89.6 0.79 0.80 0.84 0.88
XGBoost 83.3 86.4 90.0 92.8 83.5 84.6 85.9 87.5 83.4 85.6 87.9 89.9 0.77 0.80 0.83 0.87
Knn 83.2 87.5 91.3 94.8 73.6 74.7 76.6 78.7 78.0 80.9 83.1 86.0 0.74 0.77 0.80 0.83
DT 87.3 91.2 94.9 97.0 82.8 80.8 79.3 81.1 85.0 85.6 86.4 88.3 0.79 0.82 0.84 0.88
Site-C
Precision Recall F1-Score AUC
10% 15% 20% 30% 10% 15% 20% 30% 10% 15% 20% 30% 10% 15% 20% 30%
LR 87.2 90.6 92.2 95.5 78.2 79.1 79.8 81.9 82.5 84.5 85.5 88.2 0.87 0.89 0.90 0.91
SVM 91.7 88.2 88.9 94.7 67.3 81.0 86.2 83.6 77.6 83.9 87.5 88.8 0.87 0.89 0.89 0.91
RF 82.7 86.8 89.9 95.0 85.0 85.0 84.3 83.0 83.8 85.9 87.0 88.5 0.86 0.88 0.88 0.90
XGBoost 81.4 84.8 87.0 90.2 84.3 85.0 85.6 87.0 82.9 85.0 86.4 88.6 0.85 0.88 0.89 0.90
Knn 82.3 86.7 88.9 92.6 74.2 74.7 75.0 75.7 78.0 80.2 81.3 83.3 0.81 0.83 0.84 0.85
DT 91.7 88.3 88.9 94.7 67.3 80.9 86.2 83.6 77.6 83.8 87.5 88.8 0.85 0.87 0.88 0.90
Table 3. Performance of various ML models in classifying patients with increased EF values from those
patients with either decreased or stable EF over the same period.
instances of a large increase in EF values. Across all sites, XGBoost showed the highest performance in terms of
F1-score and AUC. It should be noted that, while other models performed comparably to XGBoost in Site-B and
Site-C, the performance of these models was lower in Site-A.
Similarly, Table 4 shows prediction performance of various models in classifying patients with a decrease in
EF in 10, 15, 20, and 30 percentages from the baseline values versus those patients with either increased or stable
EF from their baseline values. Across all sites, except for XGBoost, all other models showed high precision, but
low recall resulting in a moderate F1-score. The XGBoost model, on the other hand, showed high precision and
recall resulting in a high F1-score across all sites. As in the case of EF increase, prediction performance in terms
of recall and precision increases when testing for EF decreases from 10 to 30%. The highest performance observed
for 30% EF decrease for all models. However, unlike the EF increase case, the AUC values were generally low
with no significant change for the various cases of EF decrease, implying low confidence in models prediction
ability. The low AUC is further evidenced from the feature importance analysis shown below. For all EF decrease
cases, Site-C showed higher AUC values than the corresponding values in Site-A and Site-B.
Scientific Reports | (2023) 13:294 | https://doi.org/10.1038/s41598-023-27493-8 9
Vol.:(0123456789)www.nature.com/scientificreports/
Site-A
Precision Recall F1-Score AUC
10% 15% 20% 30% 10% 15% 20% 30% 10% 15% 20% 30% 10% 15% 20% 30%
LR 78.9 83.7 88.0 93.0 55.0 56.4 57.7 60.2 64.8 67.3 69.7 73.1 0.56 0.55 0.56 0.57
SVM 79.9 83.8 88.2 93.1 50.5 55.1 59.1 64.8 61.8 66.4 70.8 76.4 0.57 0.56 0.56 0.57
RF 79.9 84.0 88.3 92.9 52.1 53.0 59.0 62.9 63.1 64.8 70.9 74.9 0.57 0.56 0.56 0.57
XGBoost 76.8 82.1 86.8 91.8 89.8 93.6 96.4 98.5 82.7 87.6 91.3 95.0 0.54 0.55 0.55 0.54
Knn 76.7 82.5 87.4 92.0 56.9 59.5 61.5 70.4 65.6 69.3 72.1 79.9 0.50 0.52 0.53 0.52
DT 79.5 83.4 87.7 92.5 53.0 54.8 63.9 76.7 62.6 64.5 73.1 83.4 0.56 0.54 0.54 0.55
Site-B
Precision Recall F1-Score AUC
10% 15% 20% 30% 10% 15% 20% 30% 10% 15% 20% 30% 10% 15% 20% 30%
LR 77.2 83.0 86.3 91.9 54.2 56.4 58.6 61.4 63.7 67.2 69.8 73.6 0.60 0.62 0.61 0.61
SVM 81.3 84.8 87.0 92.3 41.2 46.3 53.1 61.3 54.6 59.8 65.9 73.7 0.60 0.61 0.61 0.62
RF 81.2 85.0 88.2 92.7 41.9 43.8 49.2 57.4 55.3 57.5 62.7 71.1 0.60 0.61 0.61 0.63
XGBoost 72.2 78.7 83.2 89.9 78.3 83.2 86.1 91.2 74.9 80.8 84.8 90.6 0.56 0.58 0.57 0.56
Knn 73.1 79.7 84.5 90.9 55.7 57.1 59.0 63.8 63.4 65.9 69.1 74.9 0.54 0.55 0.55 0.55
DT 80.5 84.1 86.2 92.2 39.4 43.4 53.7 66.5 52.4 56.5 65.7 77.3 0.59 0.58 0.59 0.61
Site-C
Precision Recall F1-Score AUC
10% 15% 20% 30% 10% 15% 20% 30% 10% 15% 20% 30% 10% 15% 20% 30%
LR 85.7 88.1 89.8 93.9 61.6 59.5 59.0 57.1 71.7 71.0 71.2 71.0 0.77 0.75 0.74 0.72
SVM 90.0 91.4 91.2 94.3 50.7 48.3 52.9 53.7 64.8 63.2 66.8 68.3 0.77 0.75 0.74 0.72
RF 85.1 87.7 90.1 94.3 60.2 59.6 58.2 55.1 70.2 71.0 70.6 69.5 0.76 0.74 0.73 0.70
XGBoost 74.0 77.7 81.3 87.7 78.4 81.4 84.9 92.7 76.3 79.4 83.0 90.1 0.74 0.73 0.71 0.68
Knn 76.7 80.7 84.2 90.0 64.3 63.3 62.1 65.6 70.1 71.0 71.6 75.9 0.69 0.68 0.66 0.63
DT 90.7 91.4 89.1 93.1 48.6 47.0 57.4 58.2 63.3 61.7 69.1 71.3 0.74 0.72 0.70 0.68
Table 4. Prediction performance of various ML models in classifying patients with a decrease in EF values
from their baseline versus patients whose EF values increased or no changes.
We also investigated important features that contribute towards models’ prediction performances. Figure 6
shows the top 20 features and corresponding weights in terms of importance as determined by the XGBoost
model for a typical case of 30% EF increase. Similar features were observed in more or less the same order for
other cases of EF increase. In general, features such as initial EF, gender, race, heart disease, valvular disease,
COPD, BNP, and age between 60 and 70 have significantly higher weights than the remaining feature set. Features
that are not listed here have considerably less weight, indicating that they are less relevant and useful in models’
learning improvement. This is also reflected by the high AUC scores measured for these cases at the three sites.
Note that in all sites, the top ranked feature initial EF has a significantly higher weight from other features and
we found the corresponding AUC score was also higher.
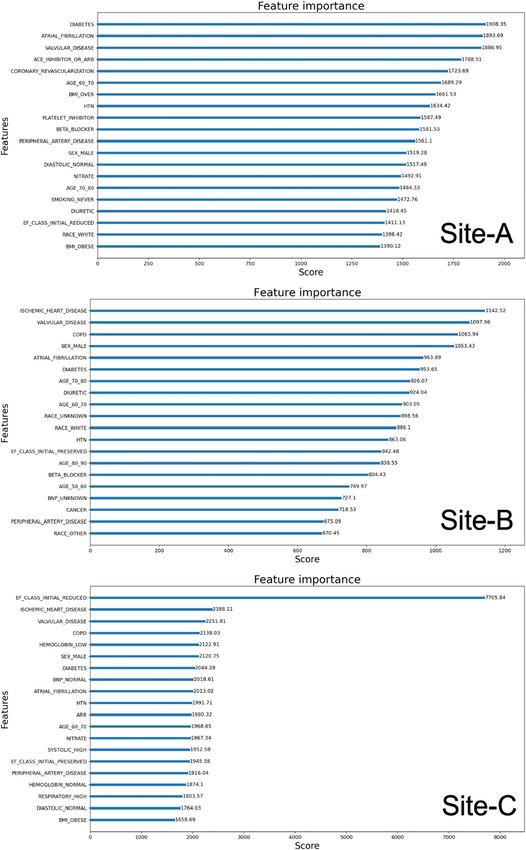
Figure 7 shows the top 20 features and the corresponding weights in terms of importance as determined
by the XGBoost model for a typical case of 30% EF decrease. Somewhat similar features were observed in the
same or slightly different order for other cases of EF decrease. Unlike the cases of EF increase, the top features
have weights that are comparable, and decrease more slowly in their ranks. While diabetes, atrial fibrillation,
valvular disease, ACE inhibitors, ischemic heart disease, COPD, sex, and initial EF were found to be important
features in all sites, we observed some variations in the order and rank of these features across sites. Also, features
not listed here also have some significant weights suggesting their relevance towards contributing to models’
learning. This is also reflected by the low AUC scores measured for these cases across all three sites. Note that in
Site-C, the initial EF has a significant weight from other top features and the corresponding AUC score is higher
compared to Site-A and Site-B.
Discussion
Clinical diagnosis of HF requires symptoms and signs as evidenced by laboratory data, radiographic images, and
documentation of EF. Thus, development of HF phenotypes in population-based studies is often more challenging
than EHR-based cohort identification. EHR data have been used previously to identify HF cohorts. For example,
Patel et al. developed and validated an algorithm to identify HFpEF in an EHR system24. In this algorithm, the
authors used the Veterans Affairs EHR system to identify a cohort of HFpEF using an inclusion criterion of any
ICD-9 code of HF (428.xx) and either BNP or aminoterminal pro-BNP (NT-proBNP) values recorded OR diu-
retic use within one month of diagnosis of HF. EF values were extracted from clinical documents using NLP and
used further to identify HFpEF subphenotype. The algorithm was validated through manual chart reviews and
had a sensitivity of 88%, specificity of 96%, a positive predictive value of 96%, and a negative predictive value of
87% to identify HFpEF cases. In another study, Tison, et al. developed multiple algorithms for HF cohorts from
Scientific Reports | (2023) 13:294 | https://doi.org/10.1038/s41598-023-27493-8 10
Vol:.(1234567890)www.nature.com/scientificreports/
Figure 6. Top features in importance identified for a 30% EF increase at three sites.
EHR data, manually reviewed to confirm HF according to Framingham criteria, and evaluated their sensitivity
and prediction p erformances19. They reported a sensitivity of 46.3%, specificity of 99.7%, a positive predictive
value of 82.5%, and a negative predictive value of 98.4% for an algorithm similar to the one used in the present
Scientific Reports | (2023) 13:294 | https://doi.org/10.1038/s41598-023-27493-8 11
Vol.:(0123456789)www.nature.com/scientificreports/
Figure 7. Top 20 features in importance rank identified for EF decrease.
study. In an extended analysis of a subpopulation of patients with NT-proBNP measured, they reported a sen-
sitivity of 76.3%, specificity of 88.6%, positive predictive value of 82.5% and negative predictive value of 84.1%.
The present algorithm differs from the reported one which used an elevated NT-proBNP > 450 pg/ml instead
Scientific Reports | (2023) 13:294 | https://doi.org/10.1038/s41598-023-27493-8 12
Vol:.(1234567890)www.nature.com/scientificreports/
of the BNP > 100 pg/ml in our study. As these above reports clearly demonstrated the validity of the present
approach of curating HF cohorts from EHR data, we made no attempt to further validate cohorts through any
manual chart review.
In order to compare directly with existing results, we focused our qualitative description of EF changes across
various subcategories rather than looking at EF changes in percentage. We found significant differences in the
baseline characteristics as well as the longitudinal EF change behavior of the HF cohort in this study with those
characteristics reported for the patient cohort in a heart failure registry (SwedeHF) s tudy14. The mean age of
65.6 years (Site-A), 65.8 years (Site-B), and 67.5 years (Site-C) in the current study is lower than the mean age of
72 years reported in the SwedeHF study. Also, the current study population has 46% (Site-A), 45% (Site-B) and
35% (Site-C) female patients which is higher than the 31% female patients in the SwedeHF study. In the SwedeHF
study of 4942 patients at baseline, 18% had HFpEF, 19% had HFmrEF, and 63% had HFrEF. During follow-up,
21% and 18% of HFpEF patients transitioned to HFmrEF and HFrEF, respectively; 37% and 25% of HFmrEF
patients transitioned to HFrEF and HFpEF, respectively; and 16% and 10% of HFrEF patients transitioned to
HFmrEF and HFpEF, respectively.
In the present study across all three sites only a small proportion of HFpEF patients observed a decrease in
their EF measurements within 1 year. For Site-A this is 10% (4% HFmrEF and 6% HFrEF), for Site-B this is
20% (8% HFmrEF and 12% HFrEF), and for Site-C, this is 14% (9% HFmrEF and 5% HFrEF). In the SwedeHF
study, on the other hand, 39% (21% HFmrEF and 18% HFrEF) of HFpEF patients changed to HFmrEF and
HFrEF. Across all three sites, a higher proportion of patients initially with mid-range ejection improved their
EF measurements as compared to the SwedeHF study. And more significantly, a higher percentage of patients
initially with reduced ejection fraction improved their EF values across all three sites compared to the SwedeHF
study. For Site-A this is 27% (17% HFpEF and 10% and HFmrEF), for Site-B this is 53% (44% HFpEF and 9%
HFmrEF), and for Site-C this is 39% (21% HFpEF and 18% HFmrEF). Whereas in the SwedeHF study, only 26%
of HFrEF patients transited to HFpEF and HFmrEF. Median follow-up time in the SwedeHF study was 1.4, which
is longer than the 1-year period we studied. Although age and gender were found to be the main contributing
factors for the observed differences in EF changes among sites, other factors such as race/ethnicity variations,
socio-economics disparity, and differences in treatment options at individual sites may also have contributed to
the observed differences.
Accurately predicting EF changes over a period of time in patients with cardiovascular conditions is funda-
mental to patient-centered care, both in selecting treatment strategies and informing patients as a foundation
for shared decision making. Using data from EHR on a cohort of HF patients belonging to the subphenotypes
of HFpEF, HFmrEF and HFpEF, this study investigated several machine learning methods to build prediction
models for EF assessment. Although most models performed well in predicting EF value changes, the XGBoost
model performed the best with good internal validation. Unlike other classifiers attempted in this study, XGBoost
is an ensemble method that uses a gradient boosting framework and generally works best in classification
problems with missing values. While these models were found to be efficient in predicting both EF increase
and decrease, the performance was found to be higher for EF increase. As evident from Fig. 5, across all sites
a higher proportion of patients increased their EF values in 1-year compared to patients whose EF decreased.
The ML models were able to learn EF increase with a higher confidence than EF decrease and probably helps
explain the differences in performance between these two cases. On analyzing the features that are significant in
prediction models, we found that initial EF, gender, heart diseases, COPD, valvular diseases, race, and diabetes
were factors that had the highest contribution in predicting an increase in EF measurements. Predictors such
as gender, ischemic heart disease, HTN, diabetes are in line with previous r eports14,35. In developing the various
ML models our objective was to investigate the viability of a general-purpose model for EF change prediction
regardless of patients baseline subphenotype EF category. It is well known that the pathophysiology and responses
of patients in subphenotypes are different, and predicting EF change behavior within any given subphenotypes
has great clinical significance. We plan to conduct a similar study of EF changes in patients who had baseline EF
in only one of the subphenotypes of EF.
Over the years several risk assessment tools were reported for clinical outcomes such as mortality and hospi-
talization for patients with H F25,36,37. Blood urea nitrogen level, BMI, and health status were predictive of death,
whereas hemoglobin level, blood urea nitrogen, time since previous HF hospitalization, and health status were
predictive of HF hospitalization. The present study, on the other hand, explores specifically EF value changes
in patients over a period of time. Previously reported risk assessment tools were developed using data acquired
over a relatively small patient population in controlled clinical trials or observational studies, which are often
very narrow in their inclusion/exclusion criteria and more generalization of these tools would be problematic.
Here we attempted to use longitudinal data on heart failure patients entered in electronic health records which
are more readily available to predict EF changes. Patient cohort belongs to a broad spectrum of patients in terms
of demographic and clinical attributes. The present study identifies important predictors of EF changes in heart
failure patients, which would allow care providers better treatment strategies.
The present study faces some of the same challenges of EHR based cohort analysis as compared to traditional
clinical trials or registry based studies17. Missing data elements as well as variability of available data elements
across systems are issues investigators need to address when using EHR data for clinical research. Traditional
clinical trial or registry based cohort studies obtain data designed to address a specific research question, whereas
EHR data was collected primarily for clinical care. While the present multi-site study was initiated with the inten-
tion of avoiding some of the challenges of a single-site study and to demonstrate the universal adaptability of the
present methods and analysis, it still has limitations. In EHR systems, the same information may not be univer-
sally available or collected in a standard way. It is widely acknowledged that data capturing and documentation
practices vary widely across EHR systems and may depend on factors such as local clinical practices and patient
demographics. Even if some of these variables are captured in EHR systems, the data may not have been captured
Scientific Reports | (2023) 13:294 | https://doi.org/10.1038/s41598-023-27493-8 13
Vol.:(0123456789)www.nature.com/scientificreports/
consistently. This is also reflected by the fact that several of our clinical variables are missing at varying propor-
tions at the three participating sites. The ML models trained and tested at the three sites were based on available
clinical variables at the corresponding site. Therefore, a model trained on data from one site may not have the
same predictive performance when testing on patient data from another site. In other words, the ML methods
developed in this study were not externally validated and are portable only in a broader sense but require local
training for optimum performance. It would be interesting to see the performance of ML models trained using
data from one site and tested on data originated at a different site, which we are planning as an extension of this
study. Furthermore, the present study was conducted using data from three large multi-specialty academic medi-
cal centers. The adaptability of these methods on other EHR systems with a varying focus on care and clinical
practices still needs to be evaluated. Also, if a patient’s EF was measured in an acute phase, the values would be
changed by medical treatment or adverse event in that short period. The present study used EF measurements
extracted mainly from Echocardiograms by natural language processing and did not capture any information
on patients HF treatment phase such as acute or non-acute. Features in ML algorithms can act as significant
contributors to a given outcome due to reasons other than biological association. For example, high prevalence
or low missingness, etc. of a given feature in the overall sample being analyzed may have an oversized influence in
the outcome when compared to features that are low prevalent or missing values and need not necessarily be due
to higher biological association. Not all features have the same statistical significance to a given target outcome.
Unless we train ML models in a “controlled” feature environment, finding meaningful biological association
between features and outcome variables is challenging. The high variability of EHR data across sites makes it
very challenging to conduct such training. Although we found certain features were significant contributors in
the ML prediction of EF changes, neither the extent to which these features influence a patient’s EF measurement
is clear, nor do we imply that these features are the ones causing such a change in patients’ EF measurements.
Conclusion
In this multi-site study, we demonstrated how data from EHRs could be effectively used to develop HF pheno-
types and investigate longitudinal changes in EF among HF subphenotypes. We observed significant differences
in patients longitudinal EF changes from a previous study using HF registry data. We attribute these differences
mainly to the age and gender differences of the study patient population. Data gathered from the longitudinal
study were then used to develop various machine learning models to predict EF changes in heart failure patients.
Across all three sites, high performances were observed in predicting changes in EF values over a 1-year duration
and found ML models were better in predicting EF increases versus EF decreases. As the percentage EF changes
increased from 10 to 30%, all model performances were also found to increase. Among various machine learn-
ing models, the XGBoost was found to be the best performing model for predicting EF change. The methods
developed in this study can be easily portable to other EHR systems, although local training and customization
would be needed to ensure optimum performance.
Data availability
The data of this study are not publicly available due to privacy and ethical restrictions. Data to support the
findings of this study are available upon reasonable request. Also code for data collection and machine learning
models are available on request. Contact the corresponding author for data request.
Received: 14 September 2022; Accepted: 3 January 2023
References
1. Heidenreich, P. A. et al. 2022 ACC/AHA/HFSA guideline for the management of heart failure. Clin. Pract. Guidel. 28(5), E1–E167.
https://doi.org/10.1016/j.cardfail.2022.02.010 (2022).
2. Lam, C. S. & Solomon, S. D. The middle child in heart failure: Heart failure with mid-range ejection fraction (40–50%). Eur. J.
Heart Fail. 16(10), 1049–1055. https://doi.org/10.1002/ejhf.159 (2014).
3. Rastogi, A., Novak, E., Platts, A. E. & Mann, D. L. Epidemiology, pathophysiology and clinical outcomes for heart failure patients
with a mid-range ejection fraction. Eur. J. Heart Fail. 19(12), 1597–1605. https://doi.org/10.1002/ejhf.879 (2017).
4. Cheng, R. K. et al. Outcomes in patients with heart failure with preserved, borderline, and reduced ejection fraction in the Medicare
population. Am. Heart J. 168(5), 721. https://doi.org/10.1016/j.ahj.2014.07.008 (2014).
5. Inamdar, A. A. & Inamdar, A. C. Heart failure: Diagnosis, management and utilization. J. Clin. Med. 5(7), 62. https://doi.org/10.
3390/jcm5070062 (2016).
6. Lee, D. S. et al. Relation of disease pathogenesis and risk factors to heart failure with preserved or reduced ejection fraction: Insights
from the framingham heart study of the national heart, lung, and blood institute. Circulation 119(24), 3070–3077. https://doi.org/
10.1161/CIRCULATIONAHA.108.815944 (2009).
7. Yancy, C. W. et al. 2013 ACCF/AHA guideline for the management of heart failure: A report of the American College of Cardiol-
ogy Foundation/American Heart Association Task Force on practice guidelines. Circulation 128, 16. https://doi.org/10.1161/CIR.
0b013e31829e8776 (2013).
8. Lopatin, Y. Heart failure with mid-range ejection fraction and how to treat it. Card. Fail. Rev. 4(1), 9–13. https://doi.org/10.15420/
cfr.2018:10:1 (2018).
9. Gu, J. et al. Characteristics and outcomes of transitions among heart failure categories: A prospective observational cohort study.
ESC Heart Fail. 7(2), 616–625. https://doi.org/10.1002/ehf2.12619 (2020).
10. Dec, G. W. The natural history of acute dilated cardiomyopathy. Trans. Am. Clin. Climatol. Assoc. 125, 76–87 (2014).
11. Ravid, S., Podrid, P. J., Lampert, S. & Lown, B. Congestive heart failure induced by six of the newer antiarrhythmic drugs. J. Am.
Coll. Cardiol. 14(5), 1326–1330 (1989).
12. Hajouli, S. & Ludhwani, D. Heart Failure and Ejection Fraction (StatPearls Publishing, 2020). https://www.n cbi.n
lm.n
ih.g ov/b
ooks/
NBK553115/.
Scientific Reports | (2023) 13:294 | https://doi.org/10.1038/s41598-023-27493-8 14
Vol:.(1234567890)You can also read