Prediction of photosynthesis in Scots pine ecosystems across Europe by a needle-level theory
←
→
Page content transcription
If your browser does not render page correctly, please read the page content below
Atmos. Chem. Phys., 18, 13321–13328, 2018
https://doi.org/10.5194/acp-18-13321-2018
© Author(s) 2018. This work is distributed under
the Creative Commons Attribution 4.0 License.

Prediction of photosynthesis in Scots pine ecosystems across
Europe by a needle-level theory
Pertti Hari1 , Steffen Noe2 , Sigrid Dengel3 , Jan Elbers4 , Bert Gielen5 , Veli-Matti Kerminen6 , Bart Kruijt4 ,
Liisa Kulmala1 , Anders Lindroth7 , Ivan Mammarella6 , Tuukka Petäjä6 , Guy Schurgers8 , Anni Vanhatalo1 ,
Markku Kulmala6 , and Jaana Bäck1
1 Institute for Atmospheric and Earth System Research INAR, Department of Forest Sciences,
Faculty of Agriculture and Forestry, P.O. Box 27, 00014, University of Helsinki, Finland
2 Department of Plant Physiology, Institute of Agricultural and Environmental Sciences,

Estonian University of Life Sciences, Kreutzwaldi 1, 51014 Tartu, Estonia
3 Lawrence Berkeley National Laboratory, Climate and Ecosystem Sciences Division,

1 Cyclotron Road 84-155, Mail Stop 074-0316, Berkeley, CA 94720-8118, USA
4 Wageningen University and Research, Water Systems and Global Change Group, P.O. Box 47,

6700AA Wageningen, the Netherlands
5 Department of Biology, University of Antwerp, 2610 Wilrijk, Belgium
6 Institute for Atmospheric and Earth System Research INAR, Faculty of Science, P.O. Box 68,

00014, University of Helsinki, Finland
7 Department of Physical Geography and Ecosystem Sciences, Lund University, 22362 Lund, Sweden
8 University of Copenhagen, Department of Geosciences and Natural Resource Management,

Øster Voldgade 10, 1350 Copenhagen, Denmark

Correspondence: Pertti Hari (pertti.hari@helsinki.fi)

Received: 12 June 2017 – Discussion started: 4 August 2017
Revised: 22 August 2018 – Accepted: 26 August 2018 – Published: 18 September 2018

Abstract. Photosynthesis provides carbon for the synthesis       1   Introduction
of macromolecules to construct cells during growth. This is
the basis for the key role of photosynthesis in the carbon dy-   A large number of eddy-covariance (EC) measuring stations
namics of ecosystems and in the biogenic CO2 assimilation.       have been constructed in forests, peatlands, grasslands and
The development of eddy-covariance (EC) measurements for         agricultural fields (e.g. Baldocchi et al., 2000). These sta-
ecosystem CO2 fluxes started a new era in the field studies of   tions have provided valuable insights into carbon and energy
photosynthesis. However, the interpretation of the very vari-    balances of various ecosystems, but the net fluxes measured
able CO2 fluxes in evergreen forests has been problematic        with EC do not yield detailed information about the actual
especially in transition times such as the spring and autumn.    processes determining these fluxes. Therefore, an important
We apply two theoretical needle-level equations that connect     step forward would be to connect the measured energy and
the variation in the light intensity, stomatal action and the    carbon fluxes with the processes taking place in the vegeta-
annual metabolic cycle of photosynthesis. We then use these      tion and soil. In this way, one would obtain improved under-
equations to predict the photosynthetic CO2 flux in five Scots   standing of the changes in the metabolism and structure of
pine stands located from the northern timberline to Central      ecosystems generated by the present global change.
Europe. Our result has strong implications for our concep-          The modelling of EC fluxes has received strong attention.
tual understanding of the effects of the global change on the    The statistical approaches connect measured fluxes with en-
processes in boreal forests, especially of the changes in the    vironmental factors typically using rather simple “big-leaf”
metabolic annual cycle of photosynthesis.                        models where parameters are determined from ecosystem-
                                                                 scale EC data (Landsberg and Waring, 1997; Peltoniemi

Published by Copernicus Publications on behalf of the European Geosciences Union.
13322 P. Hari et al.: Prediction of photosynthesis in Scots pine ecosystems
et al., 2015). More theory-driven modelling approaches are
based on knowledge of plant metabolism and account for
70 o
the structure of the considered ecosystem. For instance, the
widely used model by Farquhar et al. (1980) is based on SMEAR I
sound physiological knowledge of biochemical reactions,
and it has been coupled with description of stomatal conduc- SMEAR II
tance to account for the effects of partial closure of stomata 60 o Norunda
on leaf-scale photosynthesis and transpiration rate (Cowan
and Farquhar, 1977; Collatz et al., 1991; Leuning, 1995;
Mäkelä et al., 2004; Katul et al., 2010; Medlyn et al., 2011;
Dewar et al., 2018). These coupled photosynthesis–stomatal-
Loobos
conductance models are now widely adopted in vegetation Brasschaat
50 o
and climate modelling (Chen et al., 1999; Krinner et al.,
2005; Sitch et al., 2008; Lin et al., 2015) and also commonly
evaluated against measured EC fluxes (Wang et al., 2007).
The upscaling from leaf to ecosystem scale is done either us-
ing big-leaf approaches (dePury and Farquhar, 1997; Wang
and Leuning, 1998) or by incorporating the impacts of verti-
cal canopy structure on microclimatic drivers, solar radiation
in particular, via multilayer models of different complexity
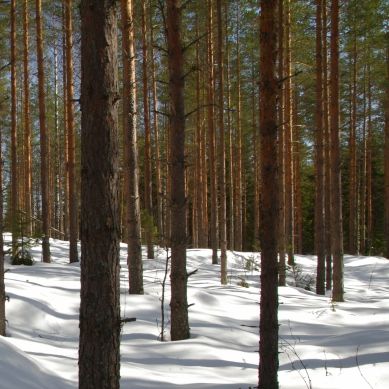
(Leuning, 1995; Baldocchi and Meyers, 1998). Figure 1. The location of the measuring stations in Europe and pho-
The seasonal onset and decline of photosynthesis is closely tos of the stands. The photo of SMEAR I was taken in December;
following the temperature history, although in the short SMEAR II in early spring; and Norunda, Loobos and Brasschaat in
term and during the growing season photosynthesis fol- summertime.
lows primarily light (e.g. Kolari et al., 2007). Duursma et
al. (2009) analysed the sensitivity in modelled stand photo-
synthesis (gross primary production, GPP) across six conif- part of photosynthesis involves the consumption of CO2 in
erous forests in Europe, using a photosynthesis model with mesophyll chloroplasts, which generates CO2 flow from the
submodels for light attenuation within the canopy and op- atmosphere into chloroplasts via stomata by diffusion (Far-
timal stomatal control. They concluded that stand GPP was quhar and von Caemmerer, 1982; Harley et al., 1992), and
related to several aggregated weather variables, especially to widens the scale of phenomena from the molecular to the
the change in the effective temperature sum or mean annual needle and shoot level. All C3 plants have a similar photosyn-
temperature at the sites. They also concluded that quantum thetic machinery that synthetises sugars using light energy
yield was the most influential parameter on annual GPP, fol- and atmospheric CO2 . This common functional basis gener-
lowed by a parameter controlling the seasonality of photo- ates common regularities in the behaviour of photosynthesis.
synthesis and photosynthetic capacity. This is in line with The aim of our paper is to study the role of these regularities
our approach to include the light and temperature changes in the behaviour of the photosynthetic CO2 flux, observed in
to the activity of the photosynthetic machinery in the model the measurements at one site, Värriö, and use the above con-
predicting stand-scale photosynthesis. cepts to analyse the EC flux data in several Scots pine stands
It has been well known for decades that photosynthesis across Europe (Fig. 1).
converts atmospheric CO2 to organic intermediates and fi-
nally to sucrose in green foliage, and this involves both
biochemical and physical processes. Biochemistry oper- 2 Methods
ates at subcellular scale by the actions of several essential
molecules: pigment–protein complexes that capture the en- Our purpose in this paper is to show that, in order to pre-
ergy from light and simultaneously split water molecules, dict the annual dynamics in photosynthesis of evergreen
thylakoid membrane pumps and electron carriers that pro- conifers, both stomatal conductance and the physiological
duce ATP (adenosine triphosphate) and NADPH (nicoti- processes related to the inherent carbon assimilation and light
namide adenine dinucleotide phosphate) with the captured absorbance and – essentially – their synchronised function-
energy, and finally enzymes in the Calvin cycle that produce ing in the system are needed. Therefore, we involved both
organic acids (phosphoglyceric acid) from atmospheric CO2 the biochemical and physical processes into the question of
utilising ATP and NADPH (Calvin et al., 1950; Arnon et al., seasonality in evergreen canopy photosynthesis. In order to
1954a,b; Mitchell, 1961; Farquhar et al., 1980). These pig- do this in a robust way, we followed Newton’s approach in
ments, membrane pumps and enzymes form the photosyn- discovering a way to construct equations to describe the diur-
thetic machinery required for the biochemistry. The physical nal behaviour of photosynthesis utilising knowledge of light
Atmos. Chem. Phys., 18, 13321–13328, 2018 www.atmos-chem-phys.net/18/13321/2018/
P. Hari et al.: Prediction of photosynthesis in Scots pine ecosystems                                                               13323

Table 1. Symbols and parameters in model equations.

          Name of parameter                                    Symbol          Unit                     Notes
          Rate of photosynthesis                               p               µmol CO2 m−2 s−1
          Rate of transpiration                                E               mmol H2 O m−2 s−1
          Photosynthetically active irradiation                I               µmol photons m−2 s−1
          Efficiency of photosynthesis                         b               µmol g m−2 s−1
          Stomatal conductance when stomata are fully open     gmax            mmol H2 O m−2 s−1
          Optimal degree of stomatal opening                   uopt            unitless
          CO2 concentration in ambient air                     Ca              g m−3
          Rate of respiration                                  r               µmol CO2 m−2 s−1
          Temperature                                          T               K
          State of the photosynthetic machinery                S               unitless
          Parameters describing the annual cycle               a1 . . .a4                               a1 = 10; a2 = 0.065
          of photosynthesis, estimated using                                                            a3 = 2; a4 = 1.15 × 10⁻⁷
          numeric methods (see Hari et al., 2017)

and carbon reactions in photosynthesis (Hari et al., 2014,                  thetises and decomposes pigments, membrane pumps and
2017). First, we defined concepts and introduced the funda-                 enzymes in the photosynthetic machinery. We introduced the
mental features of light and carbon reactions of photosyn-                  fundamental behaviour of synthesis and decomposition to
thesis, the action of stomata and diffusion of CO2 (axioms).                clarify the relationship between synthesis and temperature,
We finalised the theoretical analysis with the conservation of              and we linked the synthesis and decomposition with the state
mass and evolutionary argument that combine the dominat-                    of the photosynthetic machinery, S. Our mathematical anal-
ing features in the quantitative description of the system. In              ysis resulted in a simple differential equation (Hari et al.,
this way, we obtained an equation for the behaviour of photo-               2017) that describes the behaviour of the state of this pho-
synthesis of a leaf during a day (p(I, E)D ) that links the the-            tosynthetic machinery:
oretical knowledge and climatic drivers (light, temperature,                dS
and CO2 and water vapour concentration) to photosynthesis.                     =Max {0, a1 (T + Tf )} − a2 S − a3
                                                                            dt

               uopt gmax Ca + r bf (I )                                         Max {(Tf − T ) · I, 0} .                               (2)
p(I, E)D =                                                   (1)
                 uopt gmax + bf (I )                                        Here, Tf is the freezing temperature of needles, T is the tem-
                                                                            perature, S is the state of the photosynthetic machinery and
Here, p is the rate of photosynthesis, E is transpiration rate, I           a1 –a3 are parameters describing the annual cycle of photo-
is irradiation, b is a parameter called the efficiency of photo-            synthesis. We combined the state of the photosynthetic ma-
synthesis, gmax is a parameter introducing stomatal conduc-                 chinery with the equation describing the photosynthesis dur-
tance when stomata are fully open, r is the rate of respiration,            ing a day (Eq. 1) to obtain a description of the annual GPP
and uopt is the optimal degree of stomatal opening obtained                 dynamics p(I, E)A (Eq. 3). Our theoretical thinking deter-
from as solution of the optimisation problem of stomatal be-                mines the structure of these two equations.
haviour (Hari et al., 2014, 2017). The photosynthetic light re-
                                                                                           uopt gmax Ca + r a4 Sf (I )
sponse curve is given as f (I ) (see e.g. Mäkelä et al., 2004).             p(I, E)A =                                                  (3)
Parameter values and units are given in Table 1.                                             uopt gmax + a4 Sf (I )
   We then analysed the annual cycle of evergreen fo-                       Here, gmax is the stomatal conductance at times when stom-
liage photosynthesis, by using as an example the common                     ata are open, Ca is the CO2 concentration in atmosphere, uopt
Eurasian evergreen tree species, Scots pine (Pinus sylvestris               is the seasonal modulated degree of optimal stomatal control
L.). Importantly, there is a strong annual cycle in the concen-             and a4 is a parameter.
trations of active pigments, membrane pumps and enzymes,                       We estimated the values of the parameters in Eqs. (1) and
generating the distinctive seasonality in photosynthesis of ev-             (2) by analysing shoot-scale measurements of the CO2 ex-
ergreen foliage (Pelkonen and Hari, 1980; Öquist and Huner,                 change in evergreen Scots pine made during 4 years at our
2003; Ensminger et al., 2004). The changing state of the pho-               measuring station SMEAR I in Värriö, northeastern Finland.
tosynthetic machinery over the course of a year is a charac-                To gain robust results, we used 130 000 measurements of the
teristic feature determining the annual cycle of photosynthe-               photosynthetic CO2 flux made with chambers. We found that
sis in coniferous trees, especially in mid- and high latitudes              Eqs. (1) and (2) together predicted photosynthesis very suc-
experiencing seasonal temperature and irradiance changes.                   cessfully, explaining about 95 % of the variance in the mea-
These state changes involve a regulation system that syn-                   sured CO2 flux at the shoot level (Hari et al., 2017).

www.atmos-chem-phys.net/18/13321/2018/                                                    Atmos. Chem. Phys., 18, 13321–13328, 2018
13324                                                       P. Hari et al.: Prediction of photosynthesis in Scots pine ecosystems

Figure 2. The measured (black) and predicted (purple) photosynthetic CO2 flux (GPP) between the forest ecosystem and the atmosphere as
a function of time in five eddy-covariance-measuring sites in Europe during a week in early spring, summer and autumn.

                                                                      ability, and extinction of light in the canopy. These omitted
                                                                      phenomena generate noise in the prediction of photosynthe-
                                                                      sis at the ecosystem level and consequently reduce the good-
                                                                      ness of fit of the prediction of GPP. Therefore, the transi-
                                                                      tion from leaf to ecosystem level requires a rough descrip-
                                                                      tion of the differences between shoot and ecosystem, as well
                                                                      as between ecosystems. We describe these differences with
                                                                      an ecosystem-specific scaling coefficient. As the first step of
                                                                      the prediction, we determined the values of the scaling coef-
                                                                      ficients from measurements done at each site during the year
Figure 3. (a) The relationship between measured and predicted on-     preceding the one we were aiming to predict. Thereafter we
set dates of photosynthesis in the five studied ecosystems; (b) the   were able to predict the GPP in the five pine stands in Eu-
cessation dates of photosynthesis in the five ecosystems.             rope. We based our prediction utilising the two equations on
                                                                      the measured values of light, temperature, and CO2 and wa-
                                                                      ter vapour concentrations done in each site on the parameter
   The EC methodology provides the mean CO2 flux dur-                 value obtained by the shoot-scale measurements in Värriö
ing some time interval, usually 30 min. In the case of a for-         and on the site-specific scaling coefficients determined from
est stand, the measured flux combines the photosynthesis of           the eddy-covariance measurements done on the sites during
trees and of other vegetation growing on the site and, in ad-         the previous year. We developed a code in MATLAB to per-
dition, the respiration of plants and soil microbes. We ex-           form the predictions.
tracted the ecosystem CO2 flux generated by photosynthesis
by removing respiration from the measurements with stan-
dard methods (Reichstein et al., 2005). In this way, we obtain        3   Results
the ecosystem-scale GPP time series for all sites. We describe
the measuring sites in more detail in the Supplement.                 The predictions obtained for all measured Scots pine ecosys-
   We explored the role of regularities described with                tems were successful in describing the dynamic features of
Eqs. (1)–(3) in explaining variation of observed GPP in Eu-           GPP (Fig. 2). The daily patterns of modelled photosynthetic
ropean pine forests. Applying our equations dealing with the          CO2 fluxes are very similar to the measured ones in each
photosynthesis of one shoot to predict photosynthesis at the          studied ecosystem throughout the photosynthetically active
ecosystem level omits numerous additional phenomena ap-               period. The predictions capture adequately the daily patterns:
parent on that scale. These include for example site-specific         rapid increase of GPP after sunrise, its saturation in the mid-
differences in the structure of shoots and canopy, adaption           dle of the day and its decline when the light intensity is
and acclimation of structure and metabolism to water avail-           decreasing towards evening. Clear proofs of its predictive

Atmos. Chem. Phys., 18, 13321–13328, 2018                                             www.atmos-chem-phys.net/18/13321/2018/
P. Hari et al.: Prediction of photosynthesis in Scots pine ecosystems                                                                13325

Figure 4. The relationship between measured and predicted gross primary production (a). (b)–(e) present the residuals as a function of time,
air temperature, photosynthetically active radiation (PAR) and carbon dioxide concentration.

power on a daily scale are the occasions when clouds reduce             plained variance was 93 % in SMEAR II and the minimum
the light intensity to variable degrees, causing rapid varia-           was 75 % in Brasschaat. Due to the quite large measuring
tions in the CO2 flux (Fig. 2, Brasschaat day 186 and 187)              noise of eddy-covariance measurements, about 10 %–30 %
and strong reduction in the CO2 flux on days with heavy                 (Rannik et al., 2004; Richardson et al., 2006), the measur-
clouds (Fig. 2, day 184 in Värriö and day 213 in Norunda).              ing noise probably dominates the residuals, i.e. the difference
   The patterns found in the annual cycle of photosynthesis             between measured and predicted fluxes. We studied further
are very different at the different measurement sites in Eu-            the residuals as a function of light, temperature, and CO2
rope. We defined the onset of photosynthesis at each site as            and water vapour concentration (Fig. 4), but detected only
the moment when the running mean of 14 days of photosyn-                minor systematic behaviour in the residuals, indicating that
thetic CO2 flux exceeds 20 % of the corresponding running               these factors were not determining the difference between
mean in midsummer and the moment of cessation of photo-                 the measured and predicted values. To analyse the robust-
synthesis as the moment when the running mean of GPP has                ness of the results when scaled from leaf to stand scale, we
declined to 20 % of its summertime value. Our prediction of             also tested the difference between sites in the modelled and
the timing of onset and cessation of photosynthesis in the dif-         measured GPP when the ecosystem-specific scaling coeffi-
ferent measuring sites was quite successful, and the observed           cient was based on the reported leaf area indexes (LAIs), and
and predicted dates were very close to each other at all mea-           these results (analysis not shown) indicate that the dynamics
surement sites (Fig. 3a and b). Surprisingly, the parameter             of ecosystem-level photosynthesis are rather independent of
values in the differential equation dealing with the annual             LAI values. This shows that the functional regularities deter-
dynamics, i.e. the synthesis and decomposition of the pho-              mined in the model structure are able to capture the essential
tosynthetic machinery, obtained from shoot-scale measure-               processes in the evergreen foliage photosynthesis.
ments in Värriö, seemed to produce quite adequate predic-
tions at the ecosystem level in the other studied Scots pine
stands although they are growing in very different climates.            4   Discussion and conclusions
   The prediction power of GPP by our equations in five
Scots pine ecosystems in Scandinavia and in Central Europe              Although the annual behaviour of carbon exchange in
was higher than what we expected. The equations predicted               ecosystems is rather well documented as a phenomenon, we
successfully the rapid variations in all studied ecosystems,            have found no theory or model that links the variations in
even though the residual variation was evidently a bit larger           environmental factors and the photosynthetic CO2 flux of
in the southern than in the northern ecosystems (Fig. 4).               Scots pine ecosystems during a yearly cycle. Our results are
Our predictions using the parameters from Värriö explained              in line with Duursma et al. (2009), who tested the relative
about 80 % of the variance of photosynthetic CO2 flux in                importance of climate, canopy structure and leaf physiology
the measured ecosystems. The maximum proportion of ex-                  across a gradient of forest stands in Europe and concluded

www.atmos-chem-phys.net/18/13321/2018/                                                  Atmos. Chem. Phys., 18, 13321–13328, 2018
13326                                                         P. Hari et al.: Prediction of photosynthesis in Scots pine ecosystems

that the annual dynamics of photosynthesis was closely con-             The Supplement related to this article is available
nected to seasonal temperature variations and the tempera-              online at https://doi.org/10.5194/acp-18-13321-2018-
ture sums. However, their model explained only 62 % of vari-            supplement.
ation in annual GPP across site years, due to their model
structure which was more sensitive to soil moisture or leaf
area changes.                                                           Author contributions. PH designed the study; SD, SN, MK, VMK,
   Our result that the behaviour of measured gross primary              TP, and JB contributed to developing it; PH made the original pro-
production in Scots pine stands follows the same equations              gramming. JE, BG, BK, LK, AL, IM, GS, and AV provided the data;
in a large area in Europe from the northern timber line to the          all authors contributed to writing the paper.
strongly polluted areas in Central Europe near the southern
edge of the Scots pine growing area opens new possibilities
                                                                        Competing interests. The authors declare that they have no conflict
for investigating carbon budgets of evergreen forest ecosys-
                                                                        of interest.
tems. The light and carbon reactions and the stomatal actions
determine the daily behaviour of CO2 flux between the Scots
pine ecosystem and the atmosphere. Temperature has a dom-
                                                                        Special issue statement. This article is part of the special issue
inating role in the dynamics of the annual cycle of photosyn-           “Pan-Eurasian Experiment (PEEX)”. It is not associated with a con-
thesis.                                                                 ference.
   The present global climate change stresses the impor-
tance of understanding the ecosystem responses to increas-
ing atmospheric CO2 concentration and temperature. Equa-                Acknowledgements. We acknowledge the funding and support
tions (1) and (2) resulted in an adequate prediction of the             from the Academy of Finland Centre of Excellence program (grants
GPP for all five studied Scots pine ecosystems. We can ex-              272041 and 307331), Integrated Carbon Observation System ICOS
pect that the differential equation provides also adequate pre-         (271878), ICOS Finland (281255), and the Estonian Ministry of
dictions of the photosynthetic response to a temperature in-            Sciences grant P170026 (Biosphere–atmosphere interaction and
crease in Lapland when the increase is smaller than the mean            climate research applying the SMEAR Estonia research infrastruc-
temperature difference between Värriö and Brasschaat, i.e.              ture). We thank Tiia Grönholm for her valuable contribution to the
                                                                        finalisation of the model programming, and we are grateful for the
about 10 ◦ C. Equations (1) and (2) provide also a predic-
                                                                        support we received from Jan Elbers (Wageningen Environmental
tion of the photosynthetic response of Scots pine ecosys-
                                                                        Research/ALTERRA).
tems to increasing atmospheric CO2 concentration, based on
changes in carbon reactions of photosynthesis. The physio-              Edited by: Dominick Spracklen
logical basis of the photosynthetic response in the model is            Reviewed by: two anonymous referees
sound and, in addition, the residuals of our prediction show
no clear trend as a function of atmospheric CO2 concentra-
tion (Fig. 4).
   The prediction of daily and annual behaviour of photosyn-
thesis based on the presented two equations was successful              References
in five Scots pine ecosystems, expanding from the north-
                                                                        Arnon, D. I., Allen, M. B., and Whatley, F. R.: Photosynthesis by
ern timberline to Central Europe. The regularities observed
                                                                          isolated chloroplasts, Nature, 174, 394–396, 1954a.
in the shoot-scale measurements in Värriö seem to play a
                                                                        Arnon, D. I., Whatley, F. R., and Allen, M. B.: Photosynthesis
very important role in the photosynthetic CO2 flux in ever-               by isolated chloroplasts, 2. Photosynthetic phosphorylation, the
green Scots pine ecosystems across a quite large geographi-               conversion of light into phosphate bond energy, J. Am. Chem.
cal range. Our result provides some justification to think that           Soc., 76, 6324–6329, 1954b.
there are also other common regularities in the behaviour of            Baldocchi, D. and Meyers, T.: On using eco-physiological, mi-
forests to be discovered.                                                 crometeorological and biogeochemical theory to evaluate carbon
                                                                          dioxide, water vapor and trace gas fluxes over vegetation: a per-
                                                                          spective, Agric. For. Meteorol., 90, 1–25, 1998.
Data availability. Data measured at the SMEAR I and II stations         Baldocchi, D. D., Law, B. E., and Anthoni, P. M.: On measuring and
are available on the following website: http://avaa.tdata.fi/web/         modeling energy fluxes above the floor of a homogeneous and
smart/ (last access: 1 June 2017). The data are licensed under a Cre-     heterogeneous conifer forest, Agric. For. Meteorol., 102, 187–
ative Commons 4.0 Attribution (CC BY) license. Data measured at           206, 2000.
Norunda, Brasschaat and Loobos are available via the ICOS Carbon        Calvin, M., Bassham, J. A., and Benson, A. A.: Chemical trans-
Portal. Model codes can be obtained from Pertti Hari upon request         formations of carbon in photosynthesis, Fed. Proc., 9, 524–534,
(pertti.hari@helsinki.fi).                                                1950.
                                                                        Chen, J. M., Liu, J., Cihlar, J., and Goulden, M. L.: Daily canopy
                                                                          photosynthesis model through temporal and spatial scaling for
                                                                          remote sensing applications, Ecol. Model., 124, 99–119, 1999.

Atmos. Chem. Phys., 18, 13321–13328, 2018                                                www.atmos-chem-phys.net/18/13321/2018/
P. Hari et al.: Prediction of photosynthesis in Scots pine ecosystems                                                                   13327

Collatz, G. J., Ball, J. T., Grivet, C., and Berry, J. A.: Physiologi-   Landsberg, J. J. and Waring, R. H.: A generalised model of for-
  cal and environmental regulation of stomatal conductance, pho-           est productivity using simplified concepts of radiation-use effi-
  tosynthesis and transpiration – a model that includes a laminar          ciency, carbon balance and partitioning, For. Ecol. Manage., 95,
  boundary layer, Agric. For. Meteorol., 54, 107–136, 1991.                209–228 1997.
Cowan, I. R. and Farquhar, G. D.: Stomatal function in relation to       Leuning, R.: A critical-appraisal of a combined stomatal-
  leaf metabolism and environment, Symp. Soc. Exp. Biol., 31,              photosynthesis model for C-3 plants, Plant Cell Environ., 18,
  471–505, 1977.                                                           339–355, 1995.
dePury, D. G. G. and Farquhar, G. D.: Simple scaling of photo-           Lin, Y.-S., Medlyn, B. E., Duursma, R. A., Prentice, I. C., Wang, H.,
  synthesis from leaves to canopies without the errors of big-leaf         Baig, S., Eamus, D., Resco de Dios, V., Mitchell, P., Ellsworth,
  models, Plant Cell Environ., 20, 537–557, 1997.                          D. S., Op de Beeck, M., Wallin, G., Uddling, J., Tarvainen, L.,
Dewar, R., Mauranen, A., Mäkelä, A., Hölttä, T, Medlyn, B., and            Linderson, M.-L., Cernusak, L. A., Nippert, J. B., Ocheltree, T.
  Vesala, T.: New insights into the covariation of stomatal, meso-         W., Tissue, D. T., Martin-StPaul, N. K., Rogers, A., Warren, J.
  phyll and hydraulic conductances from optimization models in-            M., De Angelis, P., Hikosaka, K., Han, Q., Onoda, Y., Gimeno,
  corporating nonstomatal limitations to photosynthesis, New Phy-          T. E., Barton, C. V. M., Bennie, J., Bonal, D., Bosc, A., Löw, M.,
  tol., 217, 571–585, https://doi.org/10.1111/nph.14848, 2018.             Macinins-Ng, C., Rey, A., Rowland, L., Setterfield, S. A., Tausz-
Duursma, R. J., Kolari, P., Perämäki, M., Pulkkinen, M., Mäkelä,           Posch, S., Zaragoza-Castells, J., Broadmeadow, M. S. J., Drake,
  A., Nikinmaa, E., Hari, P., Aurela, M., Berbigier, P., Bernhofer,        J. E., Freeman, M., Ghannoum, O., Hutley, L. B., Kelly, J. W.,
  Ch., Grunwald, T., Loustau, D., Mölder, M., Verbeeck, H., and            Kikuzawa, K., Kolari, P., Koyama, K., Limousin, J.-M., Meir, P.,
  Vesala, T.: Contributions of climate, leaf area index and leaf           Lola da Costa, A. C., Mikkelsen,T. N., Salinas, N., Sun, W., and
  physiology to variation in gross primary production of six conif-        Wingate, L.: Optimal stomatal behaviour around the world, Nat.
  erous forests across Europe: a model-based analysis, Tree Phys-          Clim. Change, 5, 459–464, 2015.
  iology, 29, 621–639, 2009.                                             Mäkelä, A., Hari, P., Berninger, F., Hänninen, H., and Nikinmaa,
Ensminger, I., Sveshinikov, D., Campbell, D. A., Funk, C., Jans-           E.: Acclimation of photosynthetic capacity in Scots pine to the
  son, S., Lloyd, J., Shibistova, O., and Öquist, G.: Intermittent low     annual cycle of temperature, Tree Physiol., 24, 369–376, 2004.
  temperatures constrain spring recovery of photosynthesis in bo-        Medlyn, B. E., Duursma, R. A., Eamus, D., Ellsworth, D. S., Pren-
  real Scots pine forests, Glob. Change Biol., 10, 995–1008, 2004.         tice, I. C., Barton, C. V. M., Crous, K. Y., De Angelis, P., Free-
Farquhar, G. D. and von Caemmerer, S.: Stomatal conductance                man, M., and Wingate, L.: Reconciling the optimal and empiri-
  and photosynthesis, in: Encyclopaedia of Plant Physiology 12B            cal approaches to modelling stomatal conductance, Glob. Change
  Physiological Plant Ecology, II, Water Relations and Carbon As-          Biol., 17, 2134–2144, 2011.
  similation, edited by: Lange, O. L., Nobel, P. S., Osmond, C. B.,      Mitchell, P.: Coupling of phosphorylation to electron and hydro-
  and Ziegler, H., Springer, Berlin, 159–174, 1982.                        gen transfer by a chemi-osmotic type of mechanism, Nature, 191,
Farquhar, G. D., Caemmerer, S. V., and Berry, J. A.: A biochemical-        144–148, 1961.
  model of photosynthetic CO2 assimilation in leaves of C-3              Öquist, G. and Huner, N. P. A.: Photosynthesis of overwintering
  species, Planta 149, 78–90, 1980.                                        evergreen plants, Annu. Rev. Plant. Biol., 54, 329–355, 2003.
Hari, P., Bäck, J., Heliövaara, K., Kerminen, V.-M., Kulmala, L.,        Pelkonen, P. and Hari, P.: The dependence of the springtime recov-
  Mäkelä, A., Nikinmaa, E., Petäjä, T., and Kulmala, M.: Towards           ery of CO2 uptake in Scots pine on temperature and internal fac-
  quantitative ecology: Newton’s principia revisited, Boreal Envi-         tors, Flora 169, 398–404, 1980.
  ron. Res., 19, 142–152, 2014.                                          Peltoniemi, M., Pulkkinen, M., Aurela, M., Pumpanen, J., Kolari, P.,
Hari, P., Kerminen, V.-M., Kulmala, L., Kulmala, M., Noe, S.,              and Mäkelä, A.: A semi-empirical model of boreal forest gross
  Petäjä, T., Vanhatalo, A., and Bäck, J.: Annual cycle of Scots           primary production, evapotranspiration, and soil water – calibra-
  pine photosynthesis, Atmos. Chem. Phys., 17, 15045–15053,                tion and sensitivity analysis, Boreal Environ. Res., 20, 151–171,
  https://doi.org/10.5194/acp-17-15045-2017, 2017.                         2015.
Harley, P. C., Loreto, F., Dimarco, G., and Sharkey, T. D.: Theoret-     Rannik, U., Keronen, P., Hari, P. and Vesala, T.: Estimation of
  ical considerations when estimating the mesophyll conductance            forest-atmosphere CO2 exchange by eddy covariance and profile
  to CO2 flux by analysis of the response of photosynthesis to CO2 ,       techniques, Agric. For. Meteorol., 126, 141–155, 2004.
  Plant Physiol., 98, 1429–1436, 1992.                                   Reichstein, M., Falge, E., Baldocchi, D., Papale, D., Aubinet,
Katul, G., Manzoni, S., Palmroth, S., and Oren, R.: A Stomatal op-         M., Berbigier, P., Bernhofer, C., Buchmann, N., Gilmanov, T.,
  timization theory to describe the effects of atmospheric CO2 on          Granier, A., Grünwald, T., Havránková, K., Ilvesniemi, H.,
  leaf photosynthesis and transpiration, Ann. Bot.-London, 105,            Janous, D., Knohl, A., Laurila, T., Lohila, A., Loustau, D., Mat-
  431–442, 2010.                                                           teucci, G., Meyers, T., Miglietta, F., Ourcival, J.-M., Pumpanen,
Kolari, P., Lappalainen, H. K., Hänninen, H., and Hari, P.: Relation-      J., Rambal, S., Rotenberg, E., Sanz, M., Tenhunen, J., Seufert, G.,
  ship between temperature and the seasonal course of photosyn-            Vaccari, F., Vesala, T., Yakir, D., and Valentini, R.: On the separa-
  thesis in Scots pine at northern timberline and in southern boreal       tion of net ecosystem exchange into assimilation and ecosystem
  zone, Tellus B, 59, 542–552, 2007.                                       respiration: review and improved algorithm, Glob. Change Biol.,
Krinner, G., Viovy, N., Noblet-Ducoudré, N., Ogée, J., Polcher,            11, 1424–1439, 2005.
  J., Friedlingstein, P., Ciais, P., Sitch, S., and Prentice, I. C.:     Richardson, A. D., Hollinger, D. Y., Burba, G. G., Davis, K. J.,
  A dynamic global vegetation model for studies of the cou-                Flanagan, L. B., Katul, G. G., Munger, J. W., Ricciuto, D. M.,
  pled atmosphere-biosphere system, Global Biogeochem. Cy., 19,            Stoy, P. C., Suyker, A. E., Verma, S. B., and Wofsy, S. C.: A
  GB1015, https://doi.org/10.1029/2003GB002199, 2005.                      multi-site analysis of random error in tower-based measurements

www.atmos-chem-phys.net/18/13321/2018/                                                   Atmos. Chem. Phys., 18, 13321–13328, 2018
13328                                                          P. Hari et al.: Prediction of photosynthesis in Scots pine ecosystems

   of carbon and energy fluxes, Agric. For. Meteorol., 136, 1–18,        Wang, Y. P. and Leuning, R.: A two-leaf model for canopy con-
   2006.                                                                   ductance, photosynthesis and partitioning of available energy I:
Sitch, S., Huntingford, C., Gedney, N., Levy, P. E., Lomas, M., Piao,      Model description and comparison with a multi-layered model,
   S. L., Betts, R., Ciais, P., Cox, P., Friedlingstein, P., Jones, C.     Agric. For. Meteorol., 91, 89–111, 1998.
   D., Prentice, I. C., and Woodward, F. I.: Evaluation of the ter-      Wang, Y. P., Baldocchi, D., Leuning, R., Falge, E., and Vesala, T.:
   restrial carbon cycle, future plant geography and climate-carbon        Estimating parameters in a land-surface model by applying non-
   cycle feedbacks using five Dynamic Global Vegetation Models             linear inversion to eddy covariance flux measurements from eight
   (DGVMs), Glob. Change Biol., 14, 2015–2039, 2008.                       FLUXNET sites, Glob. Change Biol., 13, 652–670, 2007.

Atmos. Chem. Phys., 18, 13321–13328, 2018                                                 www.atmos-chem-phys.net/18/13321/2018/
You can also read