Pricing Event of March 2019-System Impact Assessment - August 20, 2019
←
→
Page content transcription
If your browser does not render page correctly, please read the page content below
Pricing Event of March 2019—System Impact Assessment

                    August 20, 2019
Pricing Event of March 2019—System Impact Assessment

Executive Summary
From March 1 to March 4, 2019, the Pacific Northwest (PNW) and western Canada experienced
unusually high prices for natural gas and electric power. During that time, power was being traded at
prices nearing $1,000 per MWh. WECC assessed the event to determine the role of, and implications to,
system reliability. An advisory group made up of WECC staff and members of the WECC Operating
Committee (OC) and Market Interface Committee (MIC) came to the following conclusion:

         While the March 2019 pricing event did not erode electric system reliability, it is likely
         that changing system composition and circumstances will create the conditions for this
         type of event to happen again, perhaps with direct impacts to the reliability and security
         of the bulk power system (BPS). Similar events may happen more often as low capacity-
         factor variable generation resources replace high capacity-factor, base-load generation.

The team based its conclusion on the following observations:

     •    Efforts to maintain the reliability of the BPS did not contribute to the increased prices.
     •    The increase in natural gas prices affected the electric power prices; however, the price
          increase did not impact the reliability of the BPS.
     •    No Load-Serving Entities (LSE) or Balancing Authorities (BA) interrupted load due to a lack
          of electric power.
     •    During the event, there were enough operating reserves to keep the system stable, and Peak
          Reliability did not declare any Energy Emergency Alerts.
     •    Several factors—like reduced transmission availability, long-term cold temperatures, and low
          hydro generation availability—contributed to the increase in prices, though none of these
          factors alone could have caused the event.

Recommendations
Recommendation 1—As states continue to apply requirements for low- or zero-carbon power
generation, LSEs and BAs must plan for extreme weather scenarios to ensure enough
generation and transmission resources are available to serve demand under all conditions.

Recommendation 2—Transmission and generation owners and operators and BAs should reevaluate
their maintenance practices in coordination with Reliability Coordinators (RC) to make sure enough
resources are available to cover demand under all conditions.

Recommendation 3—Industry should standardize the way in which fuel-limited resources are
reported for contingency reserves to ensure BAs and RCs know to what degree and for how long the
reserves can cover demand.

Recommendation 4—WECC, LSEs, and BAs should analyze the capability of the Western
Interconnection to meet demand under extreme weather conditions. WECC, LSEs, and BAs must

                                                                                                        2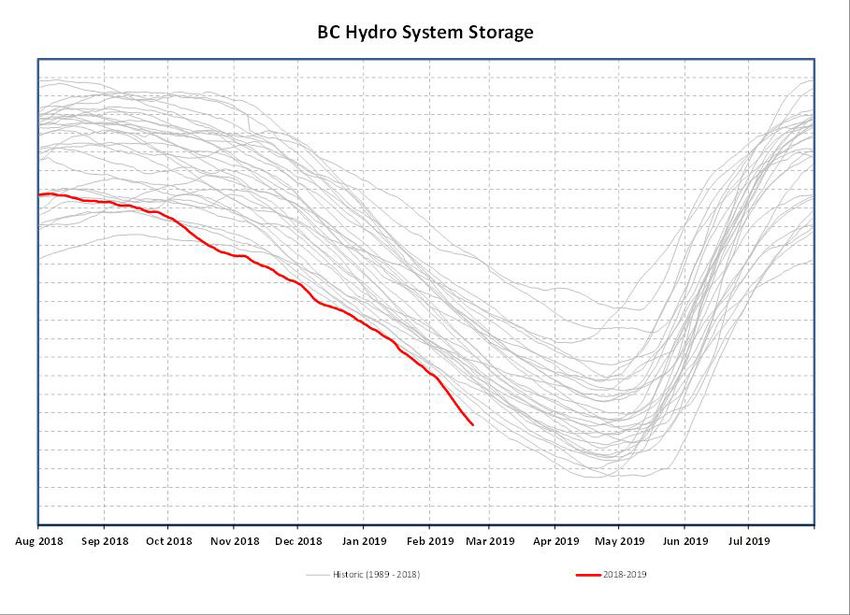
Pricing Event of March 2019—System Impact Assessment

perform various studies, including Power Flow, Generation Resource Adequacy, and Transmission
Resource Adequacy. These studies should focus on the anticipated increase in low capacity-factor wind
and solar resources that are expected to replace high capacity-factor coal and natural gas-fired
generation.

                                                                                                   3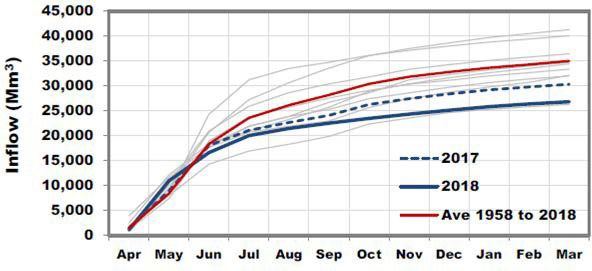
Pricing Event of March 2019—System Impact Assessment

Executive Summary ................................................................................................................................................2

    Recommendations ...............................................................................................................................................2
Introduction .............................................................................................................................................................5

Conditions Before and During the Pricing Event ............................................................................................5
    1. Weather Conditions ........................................................................................................................................6
    2. Generation Availability ..................................................................................................................................7

    3. Transmission Availability ............................................................................................................................10

Observations..........................................................................................................................................................12
    Natural Gas Pricing System .............................................................................................................................12

    Generation Mix Diversity.................................................................................................................................12
    Contingency Reserves ......................................................................................................................................13
    Pricing Event Timing ........................................................................................................................................13
Conclusions ...........................................................................................................................................................13

Recommendations ................................................................................................................................................14
Appendix 1: Planned Major Generation Retirements ...................................................................................16
Appendix 2: BC Hydro Winter 2019 Preliminary Report ..............................................................................18

Appendix 3: Volunteers for Pricing Event Advisory Group ........................................................................22

                                                                                                                                                                        4
Pricing Event of March 2019—System Impact Assessment
Introduction
The PNW and western Canada experienced high
prices for natural gas and electric power from March
1 to 4, 2019, during which power was being traded at
nearly $1,000 per MWh. While this was a pricing
event, the extreme energy prices prompted WECC to
assess whether 1) system reliability was a factor in
driving up the prices of electric power and natural
gas, and 2) whether the event jeopardized the
reliability of the BPS.
An advisory group made up of WECC staff and
members of WECC’s Operating Committee and
Market Interface Committee assessed the event. The
group issued a data request to the industry to collect
data elements, including actual transfers on major
transmission paths into the PNW and Canada, BA
Contingency Reserves, and BA loads and available
generation. Members of the advisory group also met
with several representatives of natural gas pipelines
to gather information on pipeline conditions during the pricing event.
This document gives a high-level summary of the event and the advisory group’s observations,
conclusions, and recommendations.
Conditions Before and During the Pricing Event
Before and during the pricing event, several elements on both the natural gas and electric power
systems were operating at lower-than-optimal, but not unreliable, levels. This, combined with weather
conditions, created a situation in which natural gas and electricity prices spiked above normal levels in
the PNW. Individually, the following factors, which are discussed in detail in this section, may have
had a limited impact on pricing. Together, these conditions greatly affected both natural gas and
electric prices in the PNW.
1. Weather Conditions: Extended below-average temperatures in western Canada and areas of the
PNW created prolonged high heating demand on both the gas system and BPS.
2. Generation Availability: Generation, while adequate, was scarce because—
a. PNW BA resources were serving native loads, limiting available surplus energy;
b. Low hydro levels in British Columbia (BC) affected both BC and the PNW;
5Pricing Event of March 2019—System Impact Assessment
c. Extended cold temperatures led to extremely low energy produced by wind resources in
the PNW;
d. Gas line capacity was reduced in the Westcoast Pipeline, which was running at 80
percent capacity;
e. Gas storage was low due to extended withdrawals; and
f. Forced outage of the Centralia generating unit (600 MW) further reduced the amount of
available generation capacity.
3. Transmission Availability: Transmission limitations reduced the ability to import power from
elsewhere in the Interconnection. Transfer capability was “zero” south to north on the Pacific
DC Intertie (PDCI) due to planned and approved work in Los Angeles Department of Water
and Power’s (LADWP) system.
1. Weather Conditions
Beginning in late February and continuing into the first four days of March, the PNW and western
Canada experienced extended low temperatures. The high temperatures in Vancouver, British
Columbia, averaged 4 degrees Fahrenheit below average for the entire month of February, and the
average high for Calgary, Alberta, averaged 25 degrees below average during the same period. (Figure
1).
Figure 1
2019 Temperature Departure from Normal
Calgary Vancouver
30
20
°F Above/Below Average
10
0
-10
-20
-30
-40
-50
-60
2/1/2019 2/15/2019 3/1/2019 3/15/2019 3/29/2019
The constant low temperatures stressed natural gas supply, which was already running low after the
rupture of the Westcoast Pipeline near Prince George, BC, in October 2018. The rupture reduced the
capacity of the Westcoast system by about 20 percent, often more during maintenance work. In
6Pricing Event of March 2019—System Impact Assessment
addition, the main natural gas storage facility for the PNW—Jackson Prairie—was operating at low
pressures 1 due to extensive withdrawals over the winter season. The high demand placed on natural
gas by residential heating needs further strained both the gas supply system and gas-fired electric
generation.
2. Generation Availability
Hydro Conditions
Although the 2018 winter season was a record-setting water year for many areas in the West, the PNW
experienced less-than-normal precipitation, which reduced the availability of fuel for electricity
generation. Bonneville Power Administration (BPA) reported that, because of the dry conditions across
the Basin, Grand Coulee Dam operated through February at minimum discharge rates (except for
passing non-treaty, Short-Term Libby Agreement water released from the Canadian projects) to
support the fish operations below Bonneville Dam. Despite operating at minimum discharge levels,
Grand Coulee ended below the minimum elevation requirement for the February Variable Draft Limit
(VDL) and was forecast to come in below both the anticipated March VDL and the April 10 elevation.
This caused Grand Coulee to continue operating to minimum discharges to support fish spawning and
incubation below Bonneville Dam. Headwater storage projects were all below current flood control
guidance and, therefore, also running to minimum discharge levels.
Hydro supply in BC was also reduced during this period. The combined storage of the Williston and
Kinbasket reservoirs, which serve as BC Hydro’s primary hydro system storage facilities, reached a
record seasonal low. BC Hydro saw a need to ensure another reliable supply of energy to meet
domestic load over the winter and spring. In late 2018, BC Hydro arranged with Powerex to import
energy through the winter at specific levels set by BC Hydro. The Powerex imports were expected to
rely primarily on deliveries of Canadian Entitlement energy under the Columbia River Treaty, but also
on bilateral procurement from wholesale markets in the U.S. A report on BC Hydro’s efforts is attached
as Appendix 2.
1Pressure in the storage fields facilitates natural gas withdrawals. More gas in storage helps to keep the pressure
higher, which allows for more and faster withdrawals for the storage fields.
7Pricing Event of March 2019—System Impact Assessment
Figure 2
As the power supply became tighter, BPA asked BC Hydro to release more water to increase
generation downstream. BC Hydro responded to the request, even though it was experiencing some of
the lowest hydro conditions in 15 years.
Wind Conditions
During the price increase, power from wind generation was very low, with an average capacity factor
of 11 percent for all wind resources in the Northwest Power Pool. During the same weeks in 2018 and
2017, the average capacity factors were 25 percent and 41 percent, respectively.
8Pricing Event of March 2019—System Impact Assessment
Figure 3
Northwest Wind
9000.0
8000.0
7000.0
6000.0
5000.0
4000.0
3000.0
2000.0
1000.0
0.0
1 4 7 10 13 16 19 22 25 28 31 34 37 40 43 46 49 52 55 58 61 64 67 70 73 76 79 82 85 88 91 94
Period 1 - Wind Historical Max Historical Mean Historical Min
Natural Gas Conditions
Members of the advisory group met with Kern River Pipeline and Northwest Pipeline to discuss
several gas topics, including the pricing event. Kern River reported it saw few issues during the period,
though that pipe is not directly affected by PNW conditions. Northwest Pipeline did see system
limitations and constraints that impacted deliverability (e.g., low inventory at Jackson Prairie, a
pipeline operating at reduced pressure), but stated it did not see this as a reliability event. Northwest
Pipeline indicated it saw high prices during that period and used strict balancing rules and made
phone calls to customers to ensure gas continued to flow and that customers were not leaning on the
system.
The WECC data request asked the BAs in the PNW if gas-fired generation was impacted during the
event. The responses showed that the location of gas generation was critical to possible disruptions to
the natural gas supply. Generation on the west side of the Cascade Mountains was affected, while
generation on the east side was not.
9Pricing Event of March 2019—System Impact Assessment
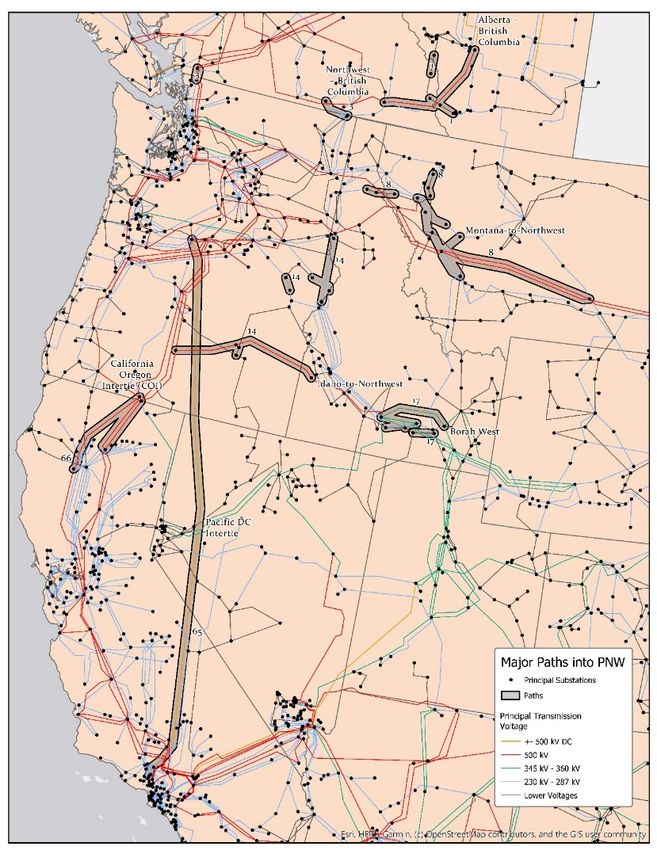
3. Transmission Availability
Beginning on February 23, the PDCI
was de-rated to zero transfer
capability south to north due to
scheduled and approved transformer
maintenance by the LADWP.
Historically, power has flowed from
the PNW to southern California in the
spring, so LADWP scheduled
maintenance during the shoulder
month. Before the transformer work,
the PDCI was rated at 975 MW south
to north and would have relieved
some of the pricing pressure during
this period. As shown in the plots
below, transfers were flowing east to
west into the PNW on key transfer
paths for the early part of the four-
day period and then began to back
off. This indicates that exports were
reduced, and resources were being
used to serve native load. Path 3, the
path from the PNW to Canada,
changed directions during this event,
with energy flowing into BC Hydro
from the PNW.
10Pricing Event of March 2019—System Impact Assessment
Figure 4
Transfer Paths Actual
Path 01 Path 03 Path 08 Path 14 Path 17 Path 65 Path 66
150%
100%
50%
0%
-50%
-100%
2
Contingency Reserves
Based on review of the information collected, there was no indication that, during the event, the PNW
BAs and the Northwest Reserve Sharing Group had less than the required reserves. Because there were
enough reserves available during the pricing event, there were no Energy Emergency Alerts (EEA) and
there was no need to shed load to keep the system balanced and stable.
2 Path 1—AB to BC;
Path 3—PNW to BC;
Path 8—MT to PNW;
Path 14—ID to PNW;
Path 17—Borah West;
Path 65—Pacific DC Intertie (PDCI);
Path 66—COI
11Pricing Event of March 2019—System Impact Assessment
Observations
Natural Gas Pricing System
During this event, the natural gas pricing system worked as designed—i.e., the pricing increase was
not a pricing system malfunction. When residential heating demand increases, it requires more natural
gas. When demand for gas increases to the point at which supply cannot cover the demands of
residential heating and power generation, gas prices increase. This should encourage a reduction in
power generation, allowing gas to supply residential demand. This is what happened during the
pricing event.
Generation Mix Diversity
In instances when natural gas prices increase to encourage reduction in natural gas-fueled power
generation, power producers should use other resources to cover the difference. When the generation
mix is diverse, there is some variety in the type and availability of alternate generation. This was not
the case during the pricing event. Hydro, wind, and natural gas resources were limited, forcing the
PNW to rely more heavily on coal and nuclear resources.
The ability to support generation during times of low diversity in the generation mix will be more
difficult as thermal resources are retired. Several states within the Western Interconnection have
established carbon-free mandates (Table 1). In response, electric utilities are retiring most, if not all, of
their coal-fired resources and many natural gas-fired resources. (see Appendix 1 for a list of planned
major generation retirements from 2019 to 2028). With the retirement of these large, high capacity-
factor units, replacement energy will likely come from variable energy sources, mostly wind and solar
generation, which have significantly lower capacity factors.
Table 1—State Renewable and Clean Energy Standards
State Renewable or Clean Energy Standard Target Year
Arizona Renewable Portfolio Standard 15% 2025
California Renewable Portfolio Standard 60% 2030
Clean Energy Standard 100% 2045
Colorado Renewable Portfolio Standard 30% 2020
Clean Energy Goal 100% 2045
Idaho No state standard
Idaho Power Clean Energy Goal 100% 2045
12Pricing Event of March 2019—System Impact Assessment
Montana Renewable Portfolio Standard 15% 2015
Nevada Renewable Portfolio Standard 50% 2030
Clean Energy Goal 100% 2050
New Renewable Portfolio Standard 80% 2040
Mexico
Clean Energy Standard 100% 2045
Oregon Renewable Portfolio Standard 50% 2040
Utah Renewable Portfolio Goal 20% 2025
Washington Renewable Portfolio Standard 15% 2020
Clean Energy Goal 100% 2045
Wyoming None
Contingency Reserves
While the calculation and reporting of reserves by BAs to the RC was not a contributing factor in the
pricing event (no EEAs were issued), the assessment indicates that, under different circumstances, they
could be. Reserves are calculated based on unit capacity and do not necessarily consider fuel
availability. Limits on the hydro system and wind availability—which were both present during the
pricing event—could reduce actual reserve levels below the calculated and reported levels. Fuel-
limited resources may be overcounted toward reserves as the full capacity of the unit may be counted
without regard to the availability of fuel.
Pricing Event Timing
The timing of the price event may also have been a contributing factor. Natural gas is traded and
nominated on Friday for the upcoming Saturday, Sunday, and Monday; while electric power is traded
and scheduled on Friday for the upcoming Sunday and Monday. The weather forecast showed cold
temperatures over the weekend, which supported natural gas and electric power prices. However,
temperatures moderated over the weekend and, by Monday, spot prices for electric power were
trading at a range of $40–$200, approaching normal spring and early summer prices.
Conclusions
The pricing event was the result of a combination of many factors, which, taken individually, would
not have the same impact on pricing. The increase in natural gas prices during the event directly
affected the cost of electric power but did not adversely affect BPS reliability. LSEs and BAs reported
13Pricing Event of March 2019—System Impact Assessment
no load interruptions, and Peak Reliability declared no EEAs, indicating there were enough electric
operating reserves during the event.
Finally, and perhaps most importantly, the generation diversity played a critical role in maintaining
reliability during the pricing event. In this case, the resource diversity helped maintain reliability
because dispatchable thermal resources were available to make up for resources with fuel limitations.
As the generation resource mix continues to change in response to carbon reduction requirements, this
type of event may become more common, and may negatively affect reliability. System planning
practices need to account for the capacity contribution of the replacement resources during times when
the system is stressed, and weather dependent resources may be limited.
Recommendations
The assessment of the pricing event gave insights into both short-term natural gas pricing issues and
potential long-term reliability concerns. The advisory group makes the following observations and
recommendations to address the issues highlighted in the March 1–4 pricing event.
Observation—Extreme weather events, like the extended cold temperatures experienced in western
Canada, are happening more often and may be the “new normal.”
Recommendation 1—As states continue to apply requirements for low- or zero-carbon power
generation, LSEs and BAs need to plan for extreme and extended weather scenarios to ensure
generation and transmission resources are available to serve demand under all conditions.
Observation—The March pricing event also showed that, under the “new normal” weather future, the
scheduling of planned maintenance may need to be re-examined. Historically, extended generation and
transmission maintenance outages have been scheduled for the shoulder months—March through May
and September and October—to ensure these resources are available for peak summer and winter
demand.
Recommendation 2—Transmission and generation owners and operators and BAs should reevaluate
their maintenance practices in coordination with RCs to make sure enough resources are available to
cover demand under all conditions.
Observation—The examination highlighted the importance of understanding how BAs report
contingency reserves to the RCs.
Recommendation 3—Industry should standardize the way fuel-limited resources are reported for
contingency reserves to ensure BAs and RCs know to what degree and for how long the reserves can
cover demand.
Observation—The transaction from high capacity-factor thermal generations to low capacity-factor
variable generation resources is changing how entities plan and operate the BPS.
14Pricing Event of March 2019—System Impact Assessment
Recommendation 4—WECC, LSEs, and BAs must perform analyses to determine the capability of the
Western Interconnection to meet demand under extreme weather conditions. WECC, LSEs, and BAs
must perform various studies, including Power Flow, Generation Resource Adequacy, and
Transmission Resource Adequacy. These studies should focus on the anticipated increase in low
capacity-factor wind and solar resources that are expected to replace high capacity-factor generation
fired by coal and natural gas.
These studies must look at all resources in the Western Interconnection, as LSEs may be counting the
same resources and only an interconnection-wide look will show the generation and transmission
adequacy of the electric grid.
15Pricing Event of March 2019—System Impact Assessment
Appendix 1: Planned Major Generation Retirements
Name Fuel Size (MW) Location Retirement Date
Ocotillo NG 220 AZ 7/1/2019
H Wilson Sundt 1,2 NG 162 AZ 8/31/2019
Battle River 3 Coal 148 AB 12/1/2019
Navajo 1-3 Coal 2310 AZ 12/22/2019
Inland Empire NG 750 CA 12/31/2019
Colstrip 1,2 Coal 600 MT 12/31/2019
2019 Retirements 4190
Alamitos 1-6 NG 2010 CA 12/31/2020
Boardman Coal 550 OR 12/31/2020
Centralia 1 Coal 670 WA 12/31/2020
Huntington Beach 1,2 (Potential Delay) NG 450 CA 12/31/2020
Ormond Beach NG 1491 CA 12/31/2020
Nucla Coal 100 CO 12/31/2020
Redondo Beach (Potential Delay) NG 1310 CA 12/31/2020
2020 Retirements 6581
Fort Churchill 2 NG 113 NV 12/31/2021
North Valmy 1 Coal 254 NV 12/31/2021
2021 Retirements 367
Oakland NG 165 CA 10/1/2022
Comanche 1 Coal 330 CO 10/31/2022
San Juan 1,4 (Potential Retirement) Coal 847 NM 12/31/2022
Naughton 1,2 (Potential Retirement) Coal 357 WY 2022
Jim Bridger 1,2 (Potential Retirement) Coal 1063 WY 2022
2022 Retirements 2762
Diablo Canyon 1 Uranium 1080 CA 11/30/2024
Centralia 2 Coal 670 WA 12/31/2024
Cholla 4 Coal 387 AZ 12/31/2024
Newman 1-3 NG 247 TX 12/31/2024
Scattergood 1,2 NG 326 CA 12/31/2024
2024 Retirements 2710
16Pricing Event of March 2019—System Impact Assessment
Name Fuel Size (MW) Location Retirement Date
Comanche 2 Coal 330 CO 10/31/2025
Diablo Canyon 2 Uranium 1080 CA 11/30/2025
Battle River 4 Coal 148 AB 12/31/2025
Craig 1 Coal 427 CO 12/31/2025
Fort Churchill 1 NG 113 NV 12/31/2025
Harry Allen 1 NG 76 NV 12/31/2025
Intermountain GS 1,2 Coal 1800 UT 12/31/2025
North Valmy 2 Coal 268 NV 12/31/2025
2025 Retirements 4242
Battle River 5 Coal 148 AB 12/1/2027
Dave Johnston 1-4 Coal 762 WY 12/31/2027
2027 Retirements 910
Harmac Biomass BIO 55 BC 8/12/2028
Sheerness 1,2 Coal 816 AB 12/31/2028
2028 Retirements 871
Total Retirements 22633
17Pricing Event of March 2019—System Impact Assessment
Appendix 2: BC Hydro Winter 2019 Preliminary Report
Challenging system conditions in British Columbia have resulted in BC Hydro’s need to procure a
substantial volume of energy across the Winter 2019 Period to serve domestic load. This preliminary
report seeks to provide a high-level overview of those conditions and BC Hydro’s response to manage
its reservoir operations and ensure adequate supply over the winter season.
I. BC HYDRO SYSTEM CONDITIONS AND RESPONSE: EARLY WINTER 2019
At the start of the winter 2019 season, BC Hydro identified a potential substantial net short energy
position through April 2019, when spring freshet could be expected to yield substantial inflows. In
particular, BC Hydro’s October energy studies indicated a potential 1,700 GWh energy deficit for the
period ending March 31, 2019 and an additional potential 1,000 GWh energy deficit for April 2019.
These projected deficits were based on a number of factors, including low inflows into BC Hydro’s
primary storage reservoirs in September and October, a projected increase in demand for electricity as
a result of the Enbridge Pipeline Explosion, and an increase in BC Hydro’s winter load forecast.
A. Early Indicator: BC HYDRO SYSTEM STORAGE DEFICIT
In October 2018, the combined storage of the Williston and Kinbasket reservoirs, which serve as BC
Hydro’s primary hydro system storage facilities, reached a record seasonal low, as shown in the
graph below.
18Pricing Event of March 2019—System Impact Assessment
Dry conditions in the Williston basin alone resulted in four successive months of low inflows, with
September, October, and November inflows being the 3rd, 2nd, and 4th lowest inflows observed
since 1958. By October, storage levels at Williston were seven feet below the historic 10-year
average elevation. The chart below provides an illustration of historical cumulative inflows to the
Williston reservoir. The blue line is the Williston reservoir cumulative inflows to the end of
February 2019 and forecast to the end of March 2019.
B. Early Indicator: GAS SUPPLY DISRUPTION
In addition to the low inflows to BC Hydro’s reservoirs and restrictions on operations, the October
2018 Enbridge Pipeline Explosion substantially reduced natural gas supply to southern BC and the
Pacific Northwest (Vancouver, Seattle, Portland). Heading into the winter, BC Hydro expected that
the reduction of this regional natural gas capacity could create natural gas curtailments across the
winter, with capacity potentially 20% less than normal winter operating capacity along with
instances of more significant restrictions. In general, constraints arising from the Pipeline Explosion
resulted in an increased demand for electricity in the market to replace gas-generating units that
would have otherwise run. For example, such constraints caused BC Hydro to remove the gas-fired
Island Generation plant from the supply stack in October 2018, further reducing BC Hydro supply.
C. BC Hydro Early Winter Response
To address the forecast shortfall, BC Hydro anticipated a need to take steps to ensure an additional
reliable supply of energy to meet domestic load over the winter and spring period. In late 2018, BC
Hydro made arrangements with Powerex to import energy across the winter period at specified
target levels that would be set, and could be adjusted by, BC Hydro. Powerex imports were
expected to rely primarily on deliveries of Canadian Entitlement energy under the Columbia River
Treaty but also on bilateral procurement from wholesale markets in the US.
19Pricing Event of March 2019—System Impact Assessment
II. LATE WINTER – BC HYDRO SYSTEM CONDITIONS AND RESPONSE
In early winter, the volume of energy BC Hydro needed was large, yet uncertain. But moving deeper
into the winter season, the volume BC Hydro needed to close the gap grew, in great part as a result of
continued cold weather and high demand, particularly throughout February and into early March.
A. Late Winter System Conditions
Entering into February, system conditions in BC worsened beyond initial predictions. February
2019 was the only February on record with an average temperature below freezing; the chart below
shows February 2019 to be the coldest Lower Mainland temperatures observed since 1945.
With this updated information, BC Hydro’s February 2019 energy studies documented an increase
in expected load and a significant decrease in expected available energy over its January forecast,
driven primarily by the cold snap across February, as well as reductions in small hydro and IPP
output in the province, as expected to be associated with the severe cold snap. In particular, as the
chart below shows, BC Hydro’s February 2019 study reflected an expectation of a nearly 2,000
GWH increase in overall system shortfall, and cold conditions were forecast to persist into March.
By the end of February, BC Hydro had recorded its highest-ever monthly load, its highest daily
average energy consumption, and its highest recorded peak hourly demand for the month of
February.
20Pricing Event of March 2019—System Impact Assessment
B. BC Hydro Late Winter Response
1. Additional Procurement to Address Shortfall
In late February, BC Hydro requested Powerex to engage in additional targeted imports on
a sustained basis at a level approaching import limits across the BC-US border for the March
and April period, in order to ensure that BC’s reservoirs were maintained at or above
minimum operating levels. In response, Powerex took steps to satisfy BC Hydro targets
using Canadian Entitlement energy under the Columbia River Treaty, along with energy
procured from wholesale markets in the US and Alberta.
2. Coordination with Bonneville Power Administration
BC Hydro staff received a request from Bonneville Power Administration in late February /
early March period, which it agreed to, for the release of a specified volume of non-treaty
water from BC Hydro’s Arrow Lakes facility to enable additional generation of electricity on
Bonneville’s downstream facilities.
3. Public Communication
BC Hydro posted a press release on March 1, 2019, informing the public about challenging
system conditions in BC that required BC Hydro to secure a substantial volume of import
supply over the winter months, and urging BC Hydro customers to engage in demand
reduction measures wherever possible.
See: https://www.bchydro.com/news/press_centre/news_releases/2019/february-power-
load.html
21Pricing Event of March 2019—System Impact Assessment
Appendix 3: Volunteers for Pricing Event Advisory Group
Industry Volunteers
Robert Romine ....................................................................................................... LS Power Development, LLC
Andy Meyers .................................................................................................. Bonneville Power Administration
Kevin Cardoza .................................................................................................... Eugene Water & Electric Board
Greg Park ..................................................................................................... Northwest Power Pool Corporation
Sueyen McMahon ..................................................................... Los Angeles Department of Water and Power
Scott Winner ................................................................................................... Bonneville Power Administration
Bill Casey ..................................................................................................... Portland General Electric Company
JJ Jamieson ................................................................................................................................................. Perennial
Mike Evans ............................................................................................. Shell Energy North America (US), L.P.
Marilyn Franz......................................................................................................................................... NV Energy
Bud Freeman ............................................................................................................................... Seattle City Light
Aliza Seelig .................................................................................................................................. Seattle City Light
Eric Baran ............................................................................ Western Interconnection Regional Advisory Body
Raj Hundal .......................................................................................................................................... Powerex, Inc.
Chris Sanford ................................................................................................. Bonneville Power Administration
Wade Kiess ..................................................................................................................................... Peak Reliability
Greg Mendonca............................................................................... Pacific Northwest Generating Cooperative
Gary Farmer ................................................................................ Transmission Agency of Northern California
Paul Wetherbee ............................................................................................................. Puget Sound Energy, Inc.
MIC and OC Leadership
Brad Bouillon...................................................................................... California Independent System Operator
Robert Follini ............................................................................................................................Avista Corporation
Rich Hydzik ..............................................................................................................................Avista Corporation
Bert Peters ........................................................................................................ Arizona Public Service Company
22Pricing Event of March 2019—System Impact Assessment
WECC Staff
Steve Ashbaker ..............................................................................................................................................WECC
Layne Brown ..................................................................................................................................................WECC
WECC receives data used in its analyses from a wide variety of sources. WECC strives to source its data from reliable
entities and undertakes reasonable efforts to validate the accuracy of the data used. WECC believes the data contained herein
and used in its analyses is accurate and reliable. However, WECC disclaims any and all representations, guarantees,
warranties, and liability for the information contained herein and any use thereof. Persons who use and rely on the
information contained herein do so at their own risk.
23You can also read