Prolonged cetuximab treatment promotes p27Kip1 mediated G1 arrest and autophagy in head and neck squamous cell carcinoma
←
→
Page content transcription
If your browser does not render page correctly, please read the page content below
www.nature.com/scientificreports
OPEN Prolonged cetuximab treatment
promotes p 27Kip1‑mediated G1
arrest and autophagy in head
and neck squamous cell carcinoma
Kohei Okuyama1,2*, Keiji Suzuki2, Tomofumi Naruse3, Hiroki Tsuchihashi3,4,
Souichi Yanamoto3, Atsushi Kaida5,6, Masahiko Miura6, Masahiro Umeda3 &
Shunichi Yamashita2,7,8
Cetuximab, an anti-epidermal growth factor receptor (EGFR) monoclonal antibody, is an efficient anti-
tumor therapeutic agent that inhibits the activation of EGFR; however, data related to the cellular
effects of prolonged cetuximab treatment are limited. In this study, the long-term cellular outcome of
prolonged cetuximab treatment and the related molecular mechanism were explored in a head and
neck squamous cell carcinoma cell line constitutively expressing a fluorescent ubiquitination-based
cell cycle indicator. Fluorescent time-lapse imaging was used to assess clonal growth, cell motility, and
cell-cycle progression. Western blot analysis was performed to measure the level of phosphorylation
and protein-expression following cetuximab treatment. Over 5 days cetuximab treatment decreased
cell motility and enhanced G1 phase cell arrest in the central region of the colonies. Significantly
decreased phosphorylation of retinoblastoma, Skp2, and Akt-mTOR proteins, accumulation of p27Kip1,
and induction of type II LC3B were observed over 8 days cetuximab treatment. Results of the present
study elucidate the cetuximab-dependent inhibition of cell migration, resulting in high cell density-
related stress and persistent cell-cycle arrest at G1 phase culminating in autophagy. These findings
provide novel molecular insights related to the anti-tumor effects of prolonged cetuximab treatment
with the potential to improve future therapeutic strategy.
Squamous cell carcinoma (SCC) is the most common type malignant tumor which develops in head and neck
region. Despite advances in recent decades in diagnosis and improvement of imaging modalities, the survival
of head and neck SCC (HNSCC) patients has remained unchanged1–3. This is due to the high recurrence rate
and the high risk of cervical lymph node or distant m etastasis1–3. The current standard treatment for HNSCC
in most patients is surgery, and postoperative concurrent chemoradiotherapy using platinum-based agents is a
widely accepted standard of treatment for the patients with the high risk of recurrence as determined by surgical
pathological findings4–6. On the other hands, the therapeutic strategies for patients with locoregional recurrent
or distant metastatic HNSCC are limited, and such patients have a median survival of 6 months and an expected
1-year survival rate of only 20%7.
Cetuximab is a chimeric IgG1 monoclonal antibody that binds to the extracellular domain of the epidermal
growth factor receptor (EGFR) with high affinity8. Cetuximab blocks EGFR activation by preventing tyrosine
kinase-mediated EGFR phosphorylation8,9. EGFR overexpression has been frequently observed in HNSCC and
1
Department of Oral and Maxillofacial Surgery, Graduate School of Medical and Dental Sciences, Tokyo Medical
and Dental University, 1‑5‑45, Yushima, Bunkyo‑ku, Tokyo 113‑8510, Japan. 2Department of Radiation Medical
Sciences, Atomic Bomb Disease Institute, Nagasaki University, Nagasaki, Japan. 3Department of Clinical
Oral Oncology, Nagasaki University Graduate School of Biomedical Sciences, Nagasaki University, Nagasaki,
Japan. 4Department of Maxillofacial Diagnostic and Surgical Science, Field of Oral and Maxillofacial Rehabilitation,
Graduate School of Medical and Dental Sciences, Kagoshima University, Kagoshima, Japan. 5Department of
Cancer Biology, The University of Kansas Medical Center, Kansas City, KS, USA. 6Division of Oral Health Science,
Department of Oral Radiation Oncology, Graduate School of Medical and Dental Sciences, Tokyo Medical
and Dental University, Tokyo, Japan. 7Center for Global Exchange, Fukushima Medical University, Fukushima,
Japan. 8Center for Advanced Radiation Emergency Medicine, National Institutes for Quantum and Radiological
Science and Technology, Chiba, Japan. *email: okuyamak.0429@gmail.com
Scientific Reports | (2021) 11:5259 | https://doi.org/10.1038/s41598-021-84877-4 1
Vol.:(0123456789)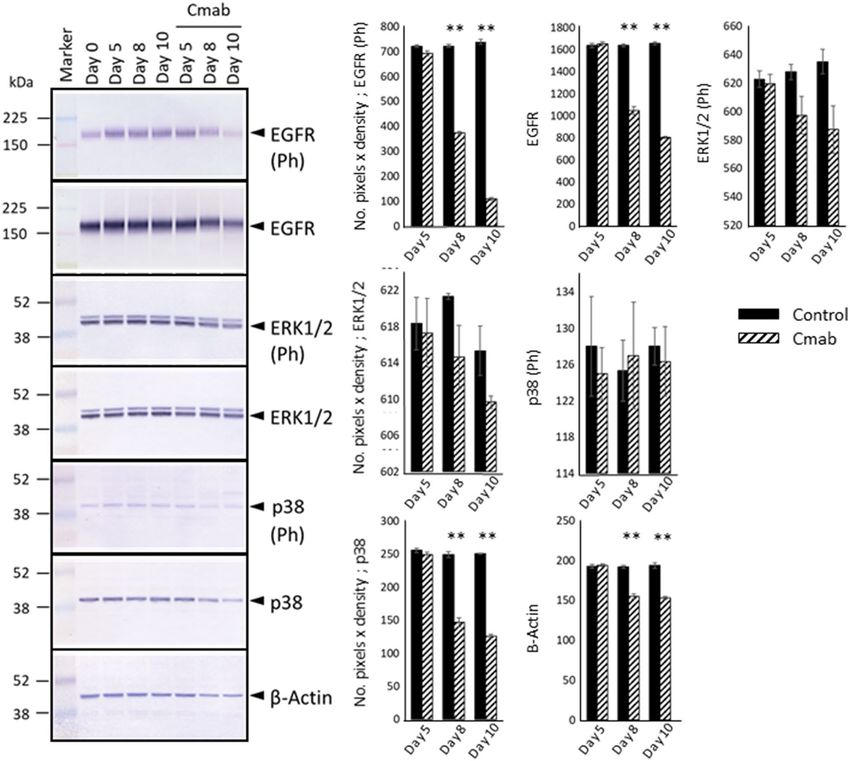
www.nature.com/scientificreports/
is thought to correlate with carcinogenesis, metastasis, the clinical stage, and a poor p rognosis10–12. Systemic
chemotherapy for HNSCC is associated with significant toxicity, which highlights the need for more targeted
therapeutics13. The clinical efficacy of cetuximab was demonstrated in the landmark EXTREME study, which
showed improved survival compared with a conventional standard chemotherapy regimen for recurrent or
metastatic HNSCC14. Furthermore, promising results were obtained by administering cetuximab in combination
with platinum-based agents in such cases, or as a radiosensitizer as a part of definitive radiotherapy for medically
unfit patients who were unable to receive platinum-based a gents14,15. The use of cetuximab has become a standard
therapeutic regimen in the treatment of HNSCC16–18. The National Comprehensive Cancer Network Clinical
Practice Guidelines in Oncology also recommended the inclusion of cetuximab in the systemic therapy regimen
for advanced cases of H NSCC19. Based on the above findings, systemic therapy with cetuximab was selected for
treating unresectable, recurrent, or metastatic HNSCC and had yielded favorable o utcomes20.
In addition to the inhibition of EGFR activation, the anti-tumor effect of cetuximab is mediated by antibody-
dependent cell-mediated cytotoxicity12,21,22, hypoxic tumor microenvironment induced drug resistance23, and
inhibition of epithelial–mesenchymal t ransition24. Ohnishi et al. reported that environmental stimuli alter the
activation of proteins associated with EGFR signal transduction, resulting in a change in cetuximab s ensitivity25.
Moreover, their results also indicated that cetuximab treatment markedly inhibited the migratory activity of
tongue cancer cells; however, the underlying mechanism was unclear25.
Because EGFR inhibition by cetuximab can inhibit intracellular-signaling pathways linked to dysregulated cell
growth, the anti-tumor effects of cetuximab are expected to involve cell cycle arrest. Indeed, cetuximab treatment
was reported to increase the expression of p 27Kip1, a cyclin-dependent protein kinase inhibitor (CKI), and arrest
26
cells in G1 phase . Previously, it was reported that S-phase kinase-associated protein 2 (Skp2), the ubiquitin
ligase subunit that specifically targets the negative cell-cycle regulator p 27Kip1 for degradation, is overexpressed
in various cancers, including human HNSCC; its expression levels are inversely correlated to those of p27Kip1
in these cells27. Skp2 has been associated with ubiquitination-mediated degradation of the cyclin-dependent
kinase (CDK) inhibitor p 27Kip1 both in vitro and in vivo, and it positively regulates the G1/S t ransition28. Skp2
activation is controlled by the Akt–mTOR pathway29. Previous data showed that Akt controls its own expression
level via Skp2 phosphorylation30,31. Suppression of mTOR was also observed during autophagy induction32. Since
the role of p27Kip1 in contact-dependent cell growth inhibition has been well described, we hypothesized that
the reduced cell motility that occurs after prolonged cetuximab treatment augments cell density and cell-to-cell
contact, which inhibits tumor cell growth. To test this hypothesis, we used SAS cells constitutively expressing
a fluorescent ubiquitination-based cell cycle indicator (Fucci). Following continuous cetuximab treatment, we
assessed clonal growth, cell motility, and cell-cycle progression using fluorescent time-lapse imaging over the
course of 10 days. The current findings might improve our understanding of tumor biology following cetuximab
treatment and might aid in the development of improved therapeutic strategy for HNSCC.
Results
Prolonged cetuximab treatment inhibits cell growth in SAS cells in vitro. Forty-eight hours after
SAS-Fucci cells were plated, cetuximab was added to the culture medium at one of several different concentra-
tions (2.5, 5, 10, or 20 µg/mL). The anti-tumor effects of cetuximab were determined by measuring cell-growth
inhibition. As shown in Fig. 1A, no growth inhibition was observed during the first 4 days of treatment, although
significant growth inhibition was found on day 8. Marked growth suppression was observed using cetuximab at
a concentration of 10 µg/mL, and therefore that concentration was used in subsequent experiments. Unexpect-
edly, the growth-suppressive effect did not depend on the serum concentration at 8 days of treatment (Fig. 1B).
Temporal cell-growth analysis confirmed that cell growth was not affected by cetuximab administration by
6 days. However, prolonged treatment (10 days) caused apparent growth suppression (Fig. 1C), which was exhib-
ited by limited clonal outgrowth by the treated cells (Fig. 1D).
Prolonged cetuximab treatment induces central cells in SAS colonies into G1 phase cell cycle
arrest. The cell-cycle dynamics were observed by performing time-lapse analysis of SAS-Fucci cells, based on
fluorescence imaging of live cells. Cells arrested in G1 phase were monitored for 5 days. While homogeneous cell
growth and cell-cycle progression were observed in the control cells (Fig. 2), cetuximab treatment caused limited
clonal outgrowth (Fig. 2A, 120 h), and more cells in G1 phase were evident in the central regions of the colonies.
Our results showed that many of the cells in the central regions of the colonies were persistently arrested in G1 phase
(Fig. 2B), whereas cells lining the colony rims showed stable growth, which was comparable to the control cells.
Prolonged cetuximab treatment decreases motility of SAS cells in vitro. Time-lapse imaging
analysis was also applied to quantify cell motility. The movements of SAS-Fucci cells growing in small clusters
were tracked for 10 h (Fig. 3A). The control cells clearly exhibited motility; however, the cetuximab-treated cells
showed very limited motility. Calculating the velocity of each cell demonstrated that cetuximab treatment sig-
nificantly diminished cell motility (p < 0.001) (Fig. 3B).
Prolonged cetuximab treatment enhances mKO2‑Cdt1 levels in growth‑arrested SAS
cells. Live-imaging analysis indicated that cetuximab-mediated G1 arrest was mainly detected in the cells
occupying the central regions of the colonies. Since high G1 red expression was directly derived from high
mKO2-Cdt1 expression, our results indicated that cetuximab treatment may have caused abnormal expression
of proteins involved in cell growth. Mann–Whitney U test revealed that the mKO2-expression levels were sig-
nificantly higher in each G1-arrested cell following cetuximab treatment than in each G1 control cell (Fig. 4).
Scientific Reports | (2021) 11:5259 | https://doi.org/10.1038/s41598-021-84877-4 2
Vol:.(1234567890)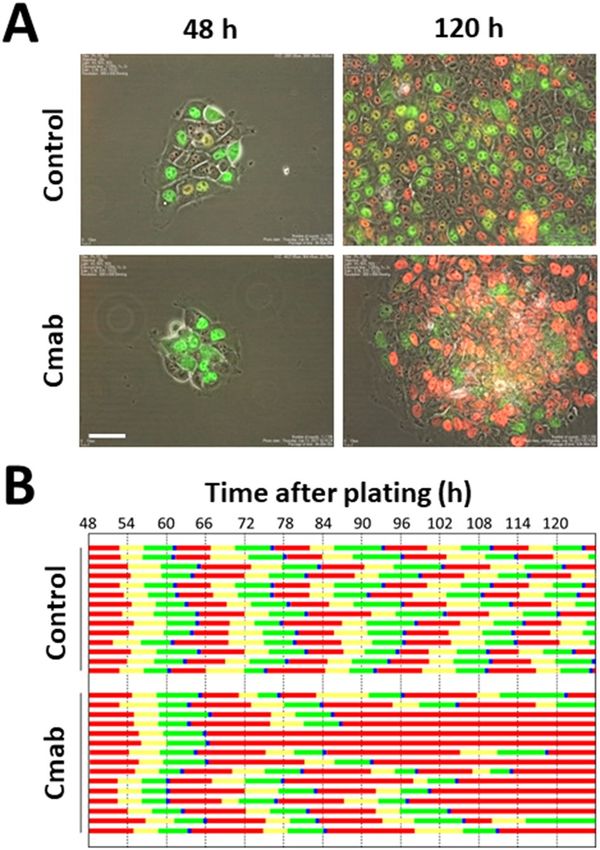
www.nature.com/scientificreports/
Figure 1. Delayed anti-tumor effect of cetuximab. (A) The anti-tumor effect of cetuximab (Cmab) was not
apparent during the first few days of treatment, but dose-dependent growth inhibition was observed by the
eighth day of treatment. *p < 0.001. (B) The serum concentration did not block the effect of the cetuximab
antibody (10 µg/mL) on day 8. *p < 0.001. FBS, fetal bovine serum. (C) Total cells were counted, and the number
of population doublings was calculated every 2 days. (D) The same numbers of cells were plated and cultured
for 10 days. The control cells kept growing until they became confluent. In contrast, cells treated with cetuximab
(10 µg/mL) showed delayed inhibition of cell growth, such that the arrested cells formed clonal colonies. Data
are represented as means ± SD of three independent experiment. Scale bar, 500 µm.
Prolonged cetuximab treatment decreases the expression of ERK1/2, p38, p21, RB, p‑RB, and
p‑Skp2, and enhances p27Kip1 levels. The effects of prolonged cetuximab treatment on cell growth-
associated signaling pathways were examined by WB analysis. The phosphorylation levels of ERK1/2 did not
change during the first 5 days of treatment and slightly decreased thereafter. Similar results were obtained in
terms of p38 (Fig. 5, Supplementary Information). In contrast, both the total-RB and phosphorylated-RB protein
levels decreased considerably after 8 or 10 days of cetuximab treatment. To study these expression differences
mechanistically, we further investigated differences in the expression levels of CKIs. We found that p21 protein
expression was not induced, but in fact decreased after 8 or 10 days of cetuximab treatment. The p16 protein was
not detected in the SAS cells. The expression of p27Kip1, another CKI involved in contact inhibition, was clearly
increased after 8 or 10 days of cetuximab treatment (Fig. 6, Supplementary Information). In addition, elevated
p27Kip1 levels were predominantly observed in the central regions of the colonies (p < 0.001) (Fig. 7). p27Kip1
expression is regulated by Skp2, whose activity is regulated by phosphorylation33. Importantly, Skp2 phospho-
rylation was markedly compromised by cetuximab treatment (Fig. 6).
Prolonged cetuximab treatment inhibits Skp2 and induces autophagy. Because the phospho-
rylation and activity of Skp2 is controlled by Akt and mTOR28–30, we next analyzed Akt phosphorylation at S473
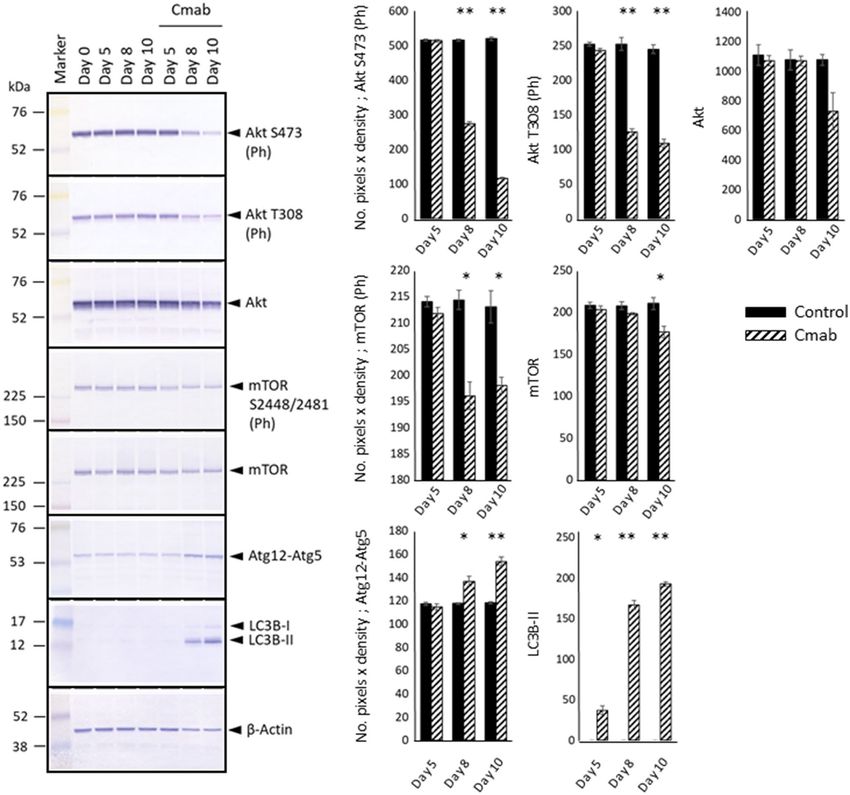
and T308, as well as mTOR phosphorylation at S2448 and S2481. We found that prolonged cetuximab treatment
suppressed the phosphorylation of both proteins (Fig. 8, Supplementary Information). The observation of down-
regulated mTOR phosphorylation was indicative of autophagy induction; therefore, we examined the expression
levels of Atg12–Atg5 and LC3Bs. As shown in Fig. 6, the levels of the Atg12–Atg5 complex and type-II LC3B
notably increased in cells treated with cetuximab for 8 or more days.
Discussion
Cetuximab has been described as a promising monoclonal antibody that can inhibit the growth of HNSCCs.
While p27Kip1-dependent cell-cycle arrest was involved in the anti-tumor effect, its induction mechanism remains
to be determined. In this study, we discovered that the growth-inhibitory effect of cetuximab became apparent
only after continuous treatment for more than 5 days, indicating that cell-cycle arrest was not induced by the
Scientific Reports | (2021) 11:5259 | https://doi.org/10.1038/s41598-021-84877-4 3
Vol.:(0123456789)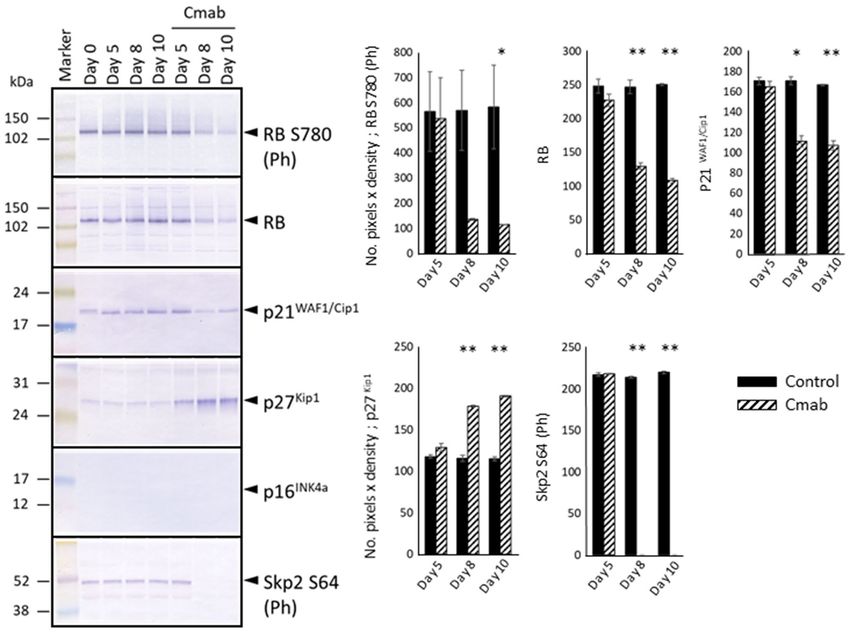
www.nature.com/scientificreports/

                                            Figure 2.  Time-lapse and pedigree analysis of control- and cetuximab-treated SAS-Fucci cells. (A) Cetuximab
                                            was administered to SAS-Fucci cells 48 h after they were plated in cell culture dishes. Time-lapse analysis using
                                            the Fucci system revealed that cells in G1 phase (red) gradually accumulated especially in the central regions
                                            of colonies after 120 h of treatment. In contrast, the control cells showed stable growth. (B) Pedigree assays
                                            revealed that, after treatment with cetuximab (10 µg/mL), the cells in the central regions of colonies gradually
                                            became arrested in G1 phase, whereas the control cells continued to divide once per ~ 20 h. Red, yellow, green,
                                            and blue bars represented G1, S, G2, and M phase, respectively. Scale bar, 50 µm.

                                            Figure 3.  Movement velocities of control- and cetuximab-treated SAS-Fucci cells. (A) The movements of
                                            individual SAS-Fucci cells in small clusters were monitored for 10 h. (B) The velocity of cell movement,
                                            calculated using the TrackMate application, decreased significantly by the fifth day treatment with cetuximab
                                            (10 µg/mL). Data are represented as box-whisker plots showing outliers, distribution intervals, 25–75%
                                            interquartile range (box), and median. *p < 0.001. Scale bar, 50 µm.

          Scientific Reports |   (2021) 11:5259 |                https://doi.org/10.1038/s41598-021-84877-4                                                     4

Vol:.(1234567890)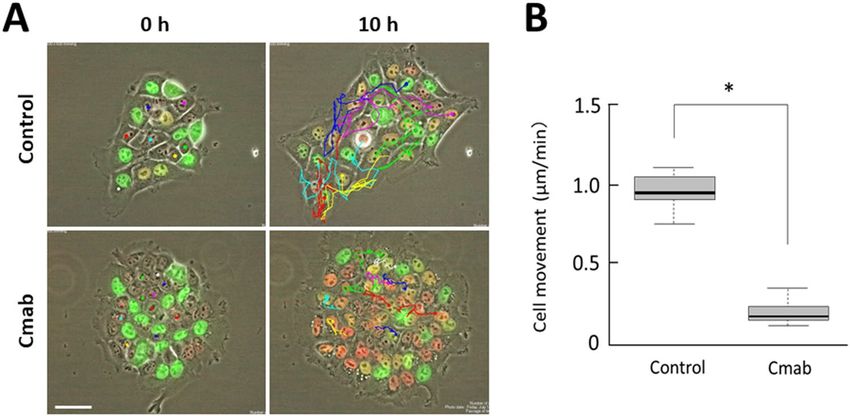
www.nature.com/scientificreports/
Figure 4. The mKO2-Cdt1 expression levels in fifth-day control- and cetuximab-treated SAS-Fucci cells. The
mKO2-Cdt1 expression levels in individual G1 phase-arrested cell were significantly higher after treatment
with cetuximab (10 µg/mL) when compared to control cells. Data are represented as box-whisker plots showing
outliers, distribution intervals, 25–75% interquartile range (box), and median. *p < 0.05.
immediate cellular responses initiated by EGFR inhibition. Therefore, the temporal cell-cycle dynamics were
examined using the Fucci system, which is a fluorescent ubiquitination-based cell-cycle indicator that causes cells
to emit red fluorescence in G1 phase and green fluorescence in S/G2/M phases34. Pedigree assays confirmed that
cell-cycle progression was similar between the control and cetuximab-treated cells by 3 days; however, treated
cells (particularly those in the central regions of forming colonies) eventually became arrested at G1 phase. We
also found that cell motility was significantly diminished by continuous cetuximab treatment, indicating that a
mutual relationship may exist between reduced cell motility and cell-growth suppression.
Protein analyses were performed to evaluate the inhibitory effects of cetuximab on EGFR-dependent signal-
ing pathways. Although several previous reports have demonstrated that cetuximab treatment can immediately
suppress EGFR phosphorylation and downstream signaling p athways8–12, few studies have been performed to
investigate the effects of prolonged treatment. Our results demonstrated that ERK1/2 phosphorylation, which
is predominantly regulated by EGFR signaling, was not affected by cetuximab treatment in SAS-Fucci cells.
Oncogenic mutation profiles of SAS cell line have been reported in several previous studies, demonstrating
mutations in the p53 and NOTCH1 genes but not in the H-ras, BRAF, MEK1/2 and ERK1/2 genes35–37. Muta-
tion in the HER4 and CNV gain of the K-ras gene were also reported38. These mutations could explain why the
minimal suppressive effect of cetuximab on EGFR phosphorylation was observed in the present examination.
It is well recognized that continuous treatment with a MAP kinase inhibitor causes a phenomenon known
as adaptation, wherein cells acquire resistance to the MAP kinase inhibitor due to the elimination of nega-
tive feedback39. EGFR inhibition has also been associated with acquired resistance40,41. Therefore, the delayed
inhibition of cell growth observed in this study must have been caused by another mechanism, which could
be cell-to-cell contact stress stemming from reduced cell motility. Indeed, our observations demonstrated that
reduced cell motility correlated with a higher cell density. For example, cells in the central regions of growing
colonies showed restricted movement and arrest in G1 phase. In agreement with a previous report26, we also
observed that p27Kip1 was elevated after prolonged treatment with cetuximab. Moreover, we demonstrated that
this phenomenon was closely related to a high cell density.
In this study, we utilized live-cell imaging and time-lapse analysis, which revealed that cetuximab treat-
ment significantly reduced cell motility. Previous investigators reached the same conclusion after performing
cell-migration assays25,42,43. Thus, we conclude that reduced cell motility was associated with a high cell density.
The mechanism that led to the reduction in cell motility remains unclear. Although the associated mechanism
was not identified in this study, several related observations have suggested that EGFR inhibition is interrelated
with reduced cell migration. For example, it was reported that cetuximab inhibited the epithelial–mesenchy-
mal transition of HNSCC, indicating that strengthening cell-to-cell contacts limited cell m otility24. Increased
actin filaments were also observed after cetuximab treatment42. Thus, future studies should be performed to
identify the underlying mechanism by which cetuximab treatment alters cell adhesion and the organization of
the cytoskeleton. The fate of those cells was also unclear; G1-arrested SAS-Fucci cells, then, was not apparently
observed apoptosis but irreversible senescence-like arrest was observed in most cells. Thus, we believe this
phenomenon induces senescence-like cell death. This senescence and mechanism to subsequent cell death also
should be investigated in the future.
Considering that decreased phosphorylation of A kt25 and m TOR44 was previously observed in high-density
cells, our current results suggest that reduced cell motility indeed played a critical role in inducing contact stress,
which was reported to suppress Akt and mTOR phosphorylation45. Because the Akt and mTOR kinases are
indispensable for Skp2 phosphorylation, we examined Skp2 phosphorylation during prolonged treatment with
cetuximab. Our results clearly indicated that Skp2 phosphorylation was significantly abrogated by continuous
cetuximab treatment; conversely, the expression of p 27Kip1 (which is degraded by Skp2) was increased. In addi-
tion, decreased mTOR phosphorylation led to mTOR down-regulation, which resulted in autophagy induction,
Scientific Reports | (2021) 11:5259 | https://doi.org/10.1038/s41598-021-84877-4 5
Vol.:(0123456789)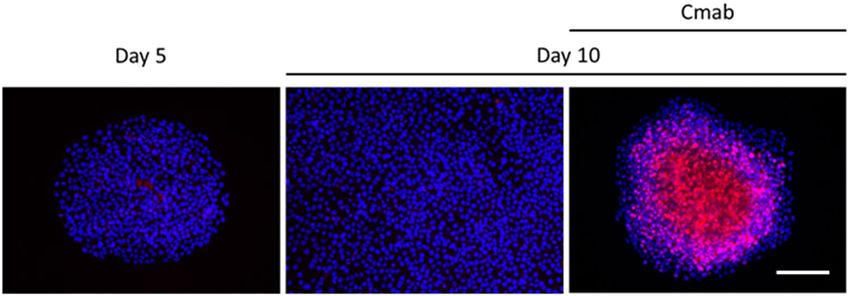
www.nature.com/scientificreports/
Figure 5. Western blotting (WB) analysis of control- and cetuximab-treated SAS cells. WB revealed the
phosphorylation levels of ERK1/2, which are regulated by the EGFR pathway, decreased slightly after 8 days of
cetuximab treatment. There was also no evidence of p38 activation, based on the levels of phosphorylated p38.
Those expression levels were evaluated with the number of pixels × density and analyzed with t test (control-
versus cetuximab-treated group). The experiment was repeated 3 times. *p < 0.05, **p < 0.001.
as demonstrated by changes in the expression of autophagy-related proteins. These findings raise the possibility
that treatment with an anti-EGFR antibody might be effective, even in cases where cancer cells have acquired
resistance to inhibition of the EGFR-signaling pathway (Fig. 9). Previously, K-Ras mutations in colon cancer
were clinically associated with a lower efficacy of cetuximab46,47. However, p27Kip1 accumulation and autophagy
induction may delay the anti-tumor effects of cetuximab independently of whether such mutation are present.
Furthermore, abnormal protein-expression levels of Skp2 and p 27Kip1 have been detected in many malignan-
cies; both proteins play important roles in the pathogenesis and development of malignant tumors, and their
expression levels also impact patient p rognosis28,48,49. In future studies, the effects of cetuximab should be com-
prehensively examined in tumors with different combination of oncogenic mutations, in light of the findings
presented above. In addition, combined treatment with cetuximab and targeted therapeutics against CDKs may
exhibit synergistic anti-tumor effects, and both in vivo and in vitro studies should be performed in the future.
Considering that radiation therapy can induce a utophagy50, cetuximab treatment by itself is expected to serve
as a radiosensitizer. On the other hand, as Wang et al. previously reported that cetuximab-mediated autophagy
conversely induced radioresistance on cancer cells; autophagy itself could also demonstrate r adioresistance51. The
clinical meaning of autophagy should be examined. Moreover, since cetuximab shows high antibody-dependent
cell-mediated cytotoxicity12,21,22 and radiotherapy can potentiate innate immunity by activating the cGAS-STING
Scientific Reports | (2021) 11:5259 | https://doi.org/10.1038/s41598-021-84877-4 6
Vol:.(1234567890)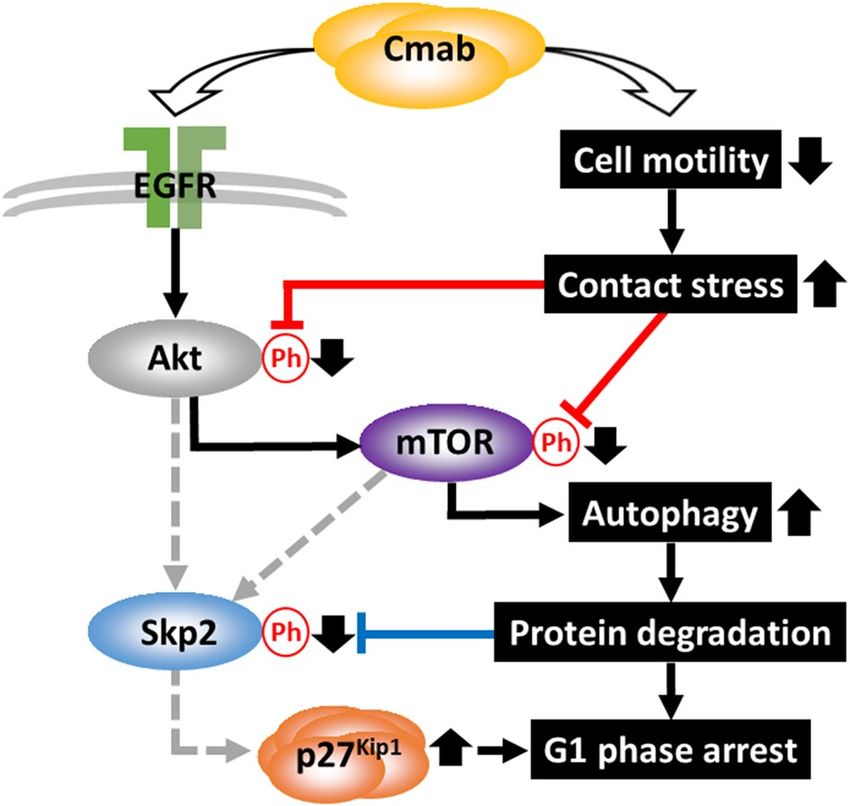
www.nature.com/scientificreports/
Figure 6. RB and phosphorylated-RB protein levels decreased considerably after 8 or 10 days of cetuximab
treatment. Thus, the expression levels of other CKIs were investigated. The p21 protein-expression level
decreased as well. The p16 protein was not detected in control- or cetuximab-treated SAS-Fucci cells. Instead,
strong p27Kip1 expression was detected in SAS-Fucci cells treated with cetuximab (10 µg/mL) for 5 days. This
examination revealed that prolonged cetuximab treatment inactivated the phosphorylation and function of
Skp2. Those expression levels were evaluated with the number of pixels × density and analyzed with t test
(control- versus cetuximab-treated group). The experiment was repeated 3 times. *p < 0.05, **p < 0.001.
Figure 7. Immunofluorescent staining also confirmed that p27Kip1 was highly expressed in the central regions
of colonies that formed after treatment with cetuximab (10 µg/mL) for 10 days, which was not observed in
control cells following a 10-day treatment. This expression was not also detected in the same sized colonies
which were established with 5-day incubation. Scale bar: 500 µm.
Scientific Reports | (2021) 11:5259 | https://doi.org/10.1038/s41598-021-84877-4 7
Vol.:(0123456789)www.nature.com/scientificreports/
Figure 8. Examination of the Akt–mTOR pathway, which controls Skp2 activation. WB analysis revealed that
cetuximab treatment (10 µg/mL) potently inhibited Akt phosphorylation at S473 and T308, which are related to
Akt activation. In addition, cetuximab treatment suppressed mTOR phosphorylation at S2448 and S2481, which
are related to mTOR activation. The expression levels of Atg12–Atg5 and LC3Bs, which are associated with
autophagy, were also analyzed, which revealed markedly increased expression of the Atg12–Atg5 complex and
type-II LC3B in cells treated with cetuximab for 8 or 10 days. Those expression levels were evaluated with the
number of pixels × density and analyzed with t test (control- versus cetuximab-treated group). The experiment
was repeated 3 times. *p < 0.05, **p < 0.001.
pathway52, the immunobiological effects of cetuximab and combined therapy with radiotherapy should be also
examined carefully.
In conclusion, cetuximab treatment in SAS cells did not demonstrate early inhibition of the EGFR pathway;
however, prolonged treatment resulted in p 27Kip1 accumulation and autophagy induction via down-regulation
of Akt and mTOR phosphorylation, which was caused by cell-contact stress and decreased cell motility.
Methods
Cell lines and culture conditions. A human tongue SCC cell line, SAS, which was transfected Fucci sys-
tem (SAS-Fucci cell) as described previously was used in this study53. SAS-Fucci cells were maintained in DMEM
(Sigma-Aldrich, St. Louis, MO, USA) containing a high concentration of glucose (4500 mg/L) with 100 units/mL
penicillin and 100 µg/mL streptomycin, which was supplemented with 10% fetal bovine serum (FBS), at 37 °C
in a humidified 5% C O2 atmosphere. We also performed experiments with several concentrations of FBS (1, 3,
Scientific Reports | (2021) 11:5259 | https://doi.org/10.1038/s41598-021-84877-4 8
Vol:.(1234567890)www.nature.com/scientificreports/
Figure 9. Mechanism of p27Kip1 accumulation and autophagy induction following cetuximab treatment.
Continuous inhibition of cell migration induced by prolonged cetuximab treatment resulted in decreased
Akt and mTOR phosphorylation (red lines), which subsequently decreased Skp2 phosphorylation (blue line)
27Kip1 accumulation, due to the suppressed degradation of p27Kip1. The down-regulation of mTOR
and led to p
phosphorylation was also associated with autophagy induction.
and 10%) to confirm that EGF (a component of FBS) would not affect EGFR activity and cell proliferation. Cells
were plated at a sparse density (103 cells/dish) in 35-mm culture dishes, so that individual colonies could form.
Drug preparation and proliferation assay. Cetuximab (C225, Erbitux™) was obtained from Merck
(Darmstadt, Germany). Working solutions were freshly prepared from a stock solution (5 mg/ml) by dilution
in DMEM (Sigma-Aldrich, St. Louis, MO, USA) containing a high concentration of glucose (4500 mg/L) with
100 units/mL penicillin and 100 µg/mL streptomycin, which was supplemented with 10% FBS, on the day of
the experiment. The working solution was replaced every 2 days during incubation. SAS-Fucci cells were plated
in 35-mm culture dishes at a density of 5 × 10³ cells/dish and expanded for 48 h, after which they were treated
with cetuximab. Subsequently, the cells were collected at different time points using trypsin and counted with an
automated cell counter (TC20, Bio-Rad laboratories, Tokyo). Population doubling was calculated based on the
number of cells at the end point.
Live‑cell imaging. Time-lapse phase-contrast and fluorescent images of cells were obtained using a BioSta-
tion ID microscope (GE Healthcare Bioscience, Tokyo). Cells were plated onto a glass-bottomed 35-mm dish
at a density of 5 × 10⁴ cells/dish and incubated for 24 h before the cetuximab treatment. Working solution with
cetuximab was replaced at first 48 h from the beginning of observation. Fifth days cetuximab- and control-
treated SAS cells were imaged. During imaging, the cells were maintained at 37 °C in a humidified atmosphere
containing 95% air and 5% CO2. For quantitative analysis, fluorescent intensities were measured using multiple
randomly selected areas to generate the optical-density plots using the Histogram tool in the Image menu of
Adobe Photoshop (Adobe Systems, Inc., San Jose, CA, USA) in cell clusters after fifth days cetuximab treatment.
The average fluorescent intensities within the randomly selected images were calculated.
Cell‑motility assay. Cell motility was analyzed using image-based software obtained from the Fiji-ImageJ
plugin "TrackMate" (Tinevez)54. Briefly, live-cell images of fifth days cetuximab- and control-treated SAS cells
were acquired every 10 min using a BioStation ID microscope (GE Healthcare Bioscience, Tokyo) as described
above, and the movements of the assigned cells were tracked for over 10 h. Then, the total movements were aver-
aged, and the average velocities of cell movement were calculated according to the TrackMate protocols.
Western blot (WB) analysis. The working solution was replaced every 2 days during incubation. Follow-
ing 5, 8, or 10 days of continuous cetuximab treatment, the treated and control samples were collected on same
day, and proteins were extracted for WB analysis. Total cell extracts were prepared using Qproteome mammalian
protein prep kit (Qiagen Japan, Tokyo). The cell lysate was cleared by centrifuging it at 15,000 rpm for 10 min at
4 °C. Then, the supernatant was collected and used as the total cellular protein fraction. Protein concentration
was determined using the bicinchoninic acid protein assay (Pierce, Rockford, Ill.). Total proteins (8 µg) were
electrophoresed through sodium dodecyl sulfate polyacrylamide gel and transferred electrophoretically to a poly-
vinyl difluoride membrane in transfer buffer (100 mM Tris and 192 mM glycine). After 30 min’ incubation with
blocking solution (10% skimmed milk in TBS-T buffer, 20 mM Tris–HCl, pH 7.6, 137 mM NaCl, 0.1% Tween 20),
Scientific Reports | (2021) 11:5259 | https://doi.org/10.1038/s41598-021-84877-4 9
Vol.:(0123456789)www.nature.com/scientificreports/
the membrane was incubated with the primary antibodies, biotinylated anti-mouse or rabbit immunoglobulin G
antibodies, and streptavidin–alkaline phosphatase. To visualize the resultant bands, the membrane was incubated
in a detection solution containing nitroblue tetrazolium/5-bromo-4-chloro-3-indolyl phosphate (Merck Japan,
Tokyo) as a substrate. Each blot was scanned by a high-resolution scanner, and the relative density of each band
was quantified using ImageJ software. Then, the expression level of each protein was normalized to the expression
level of β-actin, and the relative expression levels of each protein compared with those seen on day 0 were cal-
culated. Antibodies against the following proteins were obtained from Cell Signaling Technology Japan (Tokyo)
for use as primary antibodies: EGFR (#4267), EGFR phosphorylated at Y1068 (#2234), ERK1/2 (#4695), phos-
phorylated ERK1/2 (#4370), p38 (#9212), phosphorylated p38 (#4511), RB phosphorylated at S780 (#8180), RB
(#9313), Skp2 phosphorylated at S64 (#14,865), Akt (#4691), Akt phosphorylated at S473 and T308 (#2965 and
#4060, respectively), mTOR phosphorylated at S2448 and S2481 (#2974 and #5536, respectively), mTOR (#2983),
Atg12-Atg5 (#2010), and LC3B (#12,741). Primary antibodies against p 21WAF1/Cip1 (ab107099), p
27Kip1 (ab32034),
INK4a
and p16 (ab117443) were obtained from Abcam, PLC (Cambridge, UK). A primary antibody against β-Actin
(2F1-1) was obtained from BioLegend (San Diego, USA). The biotinylated anti-mouse or rabbit IgG antibodies
and streptavidin–alkaline phosphatase were obtained from Amersham (Amersham Japan, Tokyo).
Immunofluorescence. Cells were seeded on glass coverslips (22 × 22 mm, Matsunami, Tokyo, Japan)
placed in 35-mm dishes. After 24 h incubation, cetuximab (10 µg/ml) treatment was performed for 10 days. All
samples were fixed in 4% formaldehyde for 10 min, permeabilized with 0.1% Triton X-100 in PBS for 5 min, and
washed extensively with PBS. The cells were incubated at 37 ºC for 2 h with the following primary antibodies:
rabbit anti-p27Kip1 (ab32034, Abcam PLC) to evaluate accumulation of the p27 protein. In addition, DAPI (1 µg/
ml, Sigma-Aldrich, St. Louis, MO, USA) was used for nuclear staining. Slides were then incubated for 1 h with
an Alexa Fluor 555-conjugated anti-rabbit IgG secondary antibody (A32732, Life Technologies, CA, USA). The
slides were mounted using PBS containing 10% glycerol and sealed with glass coverslips.
Images were captured with a DFC-350 FX digital camera (Leica, Germany) attached to the fluorescent micro-
scope, and randomly selected areas were analyzed to generate optical-density plots using the Histogram tool
in the Image menu of Adobe Photoshop (Adobe Systems, Inc.). The average fluorescent intensities within the
selected areas were recorded as arbitrary units, and the relative fluorescent intensities protein (monomeric
Kusabira-Orange 2 (mKO2)) were calculated to evaluate the frequency of G1-arrest in fifth-day cetuximab
treatment cells.
Statistical analysis. Experiments were repeated at least three times. All statistical analyses were conducted
using SPSS software for Windows Version 25.0 (Armonk, NY: IBM Corp). Cell-growth rates were assessed by
one-way ANOVA. Cell motilities and mKO2-expression levels were analyzed using the Mann–Whitney U test.
The protein expression levels, which were calculated by the number of pixels × density on WB analysis, were
expressed as mean ± standard error; differences between the control- and the cetuximab-treated group were
tested by t test. Two-sided P-values of < 0.05 were considered to reflect statistically significant differences.
Ethical approve. This research need not to obtain the approval of IRB in the institute, because this basic
research was performed using only cell line and did not have any patient’s information.
Received: 13 August 2020; Accepted: 22 February 2021
References
1. Lin, N. N. et al. Significance of oral cancer-associated fibroblasts in angiogenesis, lymphangiogenesis, and tumor invasion in oral
squamous cell carcinoma. J. Oral. Pathol. Med. 46, 21–30 (2017).
2. Haddad, R. I. & Shin, D. M. Recent advances in head and neck cancer. N. Engl. J. Med. 359, 1143–1154 (2008).
3. Döbrossy, L. Epidemiology of head and neck cancer: Magnitude of the problem. Cancer. Metastasis. Rev. 24, 9–17 (2005).
4. Bernier, J. et al. Postoperative irradiation with or without concomitant chemotherapy for locally advanced head and neck cancer.
N. Engl. J. Med. 350, 1945–1952 (2004).
5. Cooper, J. S. et al. Postoperative concurrent radiotherapy and chemotherapy for high-risk squamous-cell carcinoma of the head
and neck. N. Engl. J. Med. 350, 1937–1944 (2004).
6. Bernier, J. B. et al. Defining risk level in locally advanced head and neck cancers: A comparative analysis of concurrent postopera-
tive radiation plus chemotherapy trials of the EORTC (#22931) and RTOG (#9501). Head. Neck. 27, 843–850 (2005).
7. Specenier, P. M. & Vermorken, J. B. Recurrent head and neck cancer: Current treatment and future prospects. Expert. Rev. Anti-
cancer. Ther. 8, 375–391 (2008).
8. Ciardiello, F. & Tortora, G. A novel approach in the treatment of cancer: Targeting the epidermal growth factor receptor. Clin.
Cancer. Res. 7, 2958–2970 (2001).
9. Noonberg, S. B. & Benz, C. C. Genomic and proteomics approaches to the study of cancer-stroma interactions. BMC. Med. Genom-
ics. 3, 14 (2010).
10. Eisbruch, A., Blick, M., Lee, J. S., Sacks, P. G. & Gutterman, J. Analysis of the epidermal growth factor receptor gene in fresh human
head and neck tumors. Cancer. Res. 47, 3603–3605 (1987).
11. Santini, J. et al. Characterization, quantification, and potential clinical value of the epidermal growth factor receptor in head and
neck squamous cell carcinomas. Head Neck 13, 132–139 (1991).
12. Agarwal, V., Subash, A., Nayar, R. C. & Rao, V. Is EGFR really a therapeutic target in head and neck cancers?. J. Surg. Oncol. 119,
685–686 (2019).
13. Goerner, M., Seiwert, T. Y. & Sudhoff, H. Molecular targeted therapies in head and neck cancer–An update of recent developments.
Head Neck Oncol. 2, 8 (2010).
Scientific Reports | (2021) 11:5259 | https://doi.org/10.1038/s41598-021-84877-4 10
Vol:.(1234567890)www.nature.com/scientificreports/
14. Vermorken, J. B. et al. Platinum-based chemotherapy plus cetuximab in head and neck cancer. N. Engl. J. Med. 359, 1116–1127
(2008).
15. Bonner, J. A. et al. Radiotherapy plus cetuximab for locoregionally advanced head and neck cancer: 5-year survival data from a
phase 3 randomised trial, and relation between cetuximab-induced rash and survival. Lancet. Oncol. 11, 21–28 (2010).
16. Mehra, R. et al. Protein-intrinsic and signaling network-based sources of resistance to EGFR and ErbB family-targeted therapies
in head and neck cancer. Drug. Resist. Update. 14, 260–279 (2011).
17. Pickhard, A. C. et al. Inhibition of radiation induced migration of human head and neck squamous cell carcinoma cells by blocking
of EGF receptor pathways. BMC Cancer 11, 388 (2011).
18. Psyrri A, Seiwert TY, Jimeno A. Molecular pathways in head and neck cancer. Am. Soc. Clin. Oncol. Educ. Book. 246–255 (2013).
19. National Comprehensive Cancer Network Clinical Practice Guidelines in Oncology. Head and Neck Cancers. Version 2. http://
www.nccn.org. Accessed 16 Apr 2020 (2019).
20. Yanamoto, S. et al. Multicenter retrospective study of cetuximab plus platinum-based chemotherapy for recurrent or metastatic
oral squamous cell carcinoma. Cancer. Chemother. Pharmacol. 81, 549–554 (2018).
21. Correale, P. et al. Cytotoxic drugs up-regulate epidermal growth factor receptor (EGFR) expression in colon cancer cells and
enhance their susceptibility to EGFR-targeted antibody-dependent cell-mediated-cytotoxicity (ADCC). Eur. J. Cancer. 46, 1703–
1711 (2010).
22. Lattanzio, L. et al. Elevated basal antibody-dependent cell-mediated cytotoxicity (ADCC) and high epidermal growth factor recep-
tor (EGFR) expression predict favourable outcome in patients with locally advanced head and neck cancer treated with cetuximab
and radiotherapy. Cancer. Immunol. Immunother. 66, 573–579 (2017).
23. Boeckx, C. The hypoxic tumor microenvironment and drug resistance against EGFR inhibitors: Preclinical study in cetuximab-
sensitive head and neck squamous cell carcinoma cell lines. BMC. Res. Notes. 8, 203 (2015).
24. Cheng, H. et al. Decreased SMAD4 expression is associated with induction of epithelial-to-mesenchymal transition and cetuximab
resistance in head and neck squamous cell carcinoma. Cancer. Biol. Ther. 16, 1252–1258 (2015).
25. Ohnishi, Y., Yasui, H., Kakudo, K. & Nozaki, M. Cetuximab-resistant oral squamous cell carcinoma cells become sensitive in
anchorage-independent culture conditions through the activation of the EGFR/AKT pathway. Int. J. Oncol. 47, 2165–2172 (2015).
26. Kiyota, A. et al. Anti-epidermal growth factor receptor monoclonal antibody 225 upregulates p27(KIP1) and p15(INK4B) and
induces G1 arrest in oral squamous carcinoma cell lines. Oncology 63, 92–98 (2002).
27. Fang, L., Hu, Q., Hua, Z., Li, S. & Dong, W. Growth inhibition of a tongue squamous cell carcinoma cell line (Tca8113) in vitro
and in vivo via siRNA-mediated downregulation of skp2. Int. J. Oral. Maxillofac. Surg. 37, 847–852 (2008).
28. Carrano, A. C., Eytan, E., Hershko, A. & Pagano, M. Skp2 is required for ubiquitination-mediated degradation of the CDK inhibitor
p27. Nat. Cell. Biol. 1, 193–199 (1999).
29. Shapira, M., Kakiashvili, E., Rosenberg, T. & Hershko, D. D. The mTOR inhibitor rapamycin down-regulates the expression of the
ubiquitin ligase subunit Skp2 in breast cancer cell lines. Breast. Cancer. Res. 8, R46 (2008).
30. Gao, D. et al. Phosphorylation by Akt1 promotes cytoplasmic localization of Skp2 and impairs APCCdh1-mediated Skp2 destruc-
tion. Nat. Cell. Biol. 11, 397–408 (2009).
31. Lin, H. K. et al. Phosphorylation-dependent regulation of cytosolic localization and oncogenic function of Skp2 by Akt/PKB. Nat.
Cell. Biol. 11, 420–432 (2009).
32. Li, X., Lu, Y., Pan, T. & Fan, Z. Roles of autophagy in cetuximab-mediated cancer therapy against EGFR. Autophagy 6, 1066–1077
(2010).
33. Koo, K. H. et al. Salinomycin induces cell death via inactivation of Stat3 and downregulation of Skp2. Cell. Death. Dis. 4, e693
(2013).
34. Sakaue-Sawano, A. et al. Visualizing spatiotemporal dynamics of multicellular cell-cycle progression. Cell 132, 487–498 (2008).
35. Klapproth, E. et al. Whole exome sequencing identifies mTOR and KEAP1 as potential targets for radiosensitization of HNSCC
cells refractory to EGFR and β1 integrin inhibition. Oncotarget. 9, 18099–18114 (2018).
36. Nichols, A. C. et al. Exploiting high-throughput cell line drug screening studies to identify candidate therapeutic agents in head
and neck cancer. BMC. Pharmacol. Toxicol. 15, 66 (2014).
37. Nakagaki, T. et al. Targeted next-generation sequencing of 50 cancer-related genes in Japanese patients with oral squamous cell
carcinoma. Tumour. Biol. 40, 1010428318800180 (2018).
38. Nakamura, Y. et al. Afatinib against esophageal or head-and-neck squamous cell carcinoma: Significance of activating oncogenic
HER4 mutations in HNSCC. Mol. Cancer Ther. 15, 1988–1997 (2016).
39. Swat, A., Dolado, I., Rojas, J. M. & Nebreda, A. R. Cell density-dependent inhibition of epidermal growth factor receptor signaling
by p38 alpha mitogen-activated protein kinase via sprouty2 downregulation. Mol. Cell. Biol. 29, 3332–3343 (2009).
40. Ma, P. et al. Adaptive and acquired resistance to EGFR inhibitors converge on the MAPK pathway. Theranostics. 6, 1232–1243
(2016).
41. Stuart, D. D. & Sellers, W. R. Targeting RAF-MEK-ERK kinase-scaffold interactions in cancer. Nat. Med. 19, 538–540 (2013).
42. Ohnishi, Y., Yasui, H., Kakudo, K. & Nozaki, M. Regulation of cell migration via the EGFR signaling pathway in oral squamous
cell carcinoma cells. Oncol. Lett. 13, 930–936 (2017).
43. Ohnishi, Y., Yasui, H., Nozaki, M. & Nakajima, M. Molecularly-targeted therapy for the oral cancer stem cells. Jpn. Dent. Sci. Rev.
54, 88–103 (2018).
44. Leontieva, O. V., Demidenko, Z. N. & Blagosklonny, M. V. Contact inhibition and high cell density deactivate the mammalian
target of rapamycin pathway, thus suppressing the senescence program. Proc. Natl. Acad. Sci. USA. 111, 8832–8837 (2014).
45. Broek, V., Mohan, S., Eytan, D. F., Chen, Z. & Waes, C. V. The PI3K/Akt/mTOR axis in head and neck cancer: functions, aberra-
tions, cross-talk, and therapies. Oral. Dis. 21, 815–825 (2015).
46. Liévre, A. et al. KRAS mutations as independent prognostic factor in patients with advanced colorectal cancer treated with cetuxi-
mab. J. Clin. Oncol. 26, 374–379 (2008).
47. Karapetis, C. S. et al. K-ras mutations and benefit from cetuximab in advanced colorectal cancer. N. Engl. J. Med. 359, 1757–1765
(2008).
48. Shapira, M. et al. The prognostic impact of the ubiquitin ligase subunits Skps and Cks1 in colorectal carcinoma. Cancer 103,
1336–1346 (2005).
49. Kudo, Y. et al. High expression of S-phase kinase-interacting protein 2, human F-box protein, correlates with poor prognosis in
oral squamous cell carcinomas. Cancer Res. 61, 7044–7047 (2001).
50. Nam, H. Y. et al. Radioresistant cancer cells can be conditioned to enter senescence by mTOR inhibition. Cancer Res. 73, 4267–4277
(2013).
51. Wang, M. et al. EGFR-mediated chromatin condensation protects KRAS-mutant cancer cells against ionizing radiation. Cancer
Res. 74, 2825–2834 (2014).
52. Lee, A. K. et al. Endogenous retrovirus activation as a key mechanism of anti-tumor immune response in radiotherapy. Radiat.
Res. 193, 305–317 (2020).
53. Onozato, Y., Kaida, A., Harada, H. & Miura, M. Radiosensitivity of quiescent and proliferating cells grown as multicellular tumor
spheroids. Cancer Sci. 108, 704–712 (2017).
54. Tinevez, J. Y. et al. TrackMate: An open and extensible platform for single-particle tracking. Methods 115, 80–90 (2017).
Scientific Reports | (2021) 11:5259 | https://doi.org/10.1038/s41598-021-84877-4 11
Vol.:(0123456789)www.nature.com/scientificreports/
Author contributions
K.O., K.S., and S.Ya. designed study, concept, experiment, acquisition of data, and analysis of data. K.O. also
contributed drafting, revising, submission of manuscript. S.Ya., T.N., H.T., and M.U. made effort to obtain cetuxi-
mab from Merck. A.K. and M.M. established and offered SAS-Fucci cells. All authors-final approval of the draft.
Competing interests
The authors declare no competing interests.
Additional information
Supplementary Information The online version contains supplementary material available at https://doi.
org/10.1038/s41598-021-84877-4.
Correspondence and requests for materials should be addressed to K.O.
Reprints and permissions information is available at www.nature.com/reprints.
Publisher’s note Springer Nature remains neutral with regard to jurisdictional claims in published maps and
institutional affiliations.
Open Access This article is licensed under a Creative Commons Attribution 4.0 International
License, which permits use, sharing, adaptation, distribution and reproduction in any medium or
format, as long as you give appropriate credit to the original author(s) and the source, provide a link to the
Creative Commons licence, and indicate if changes were made. The images or other third party material in this
article are included in the article’s Creative Commons licence, unless indicated otherwise in a credit line to the
material. If material is not included in the article’s Creative Commons licence and your intended use is not
permitted by statutory regulation or exceeds the permitted use, you will need to obtain permission directly from
the copyright holder. To view a copy of this licence, visit http://creativecommons.org/licenses/by/4.0/.
© The Author(s) 2021
Scientific Reports | (2021) 11:5259 | https://doi.org/10.1038/s41598-021-84877-4 12
Vol:.(1234567890)You can also read


