Property Council of Australia's Residential Outlook 2021 - Nathan Dal Bon Chief Executive Officer

Page created by Jeffery Reeves
 
CONTINUE READING
Property Council of Australia's Residential Outlook 2021 - Nathan Dal Bon Chief Executive Officer
Property Council of
Australia's Residential
Outlook 2021

Nathan Dal Bon
Chief Executive Officer
National Housing Finance and
Investment Corporation
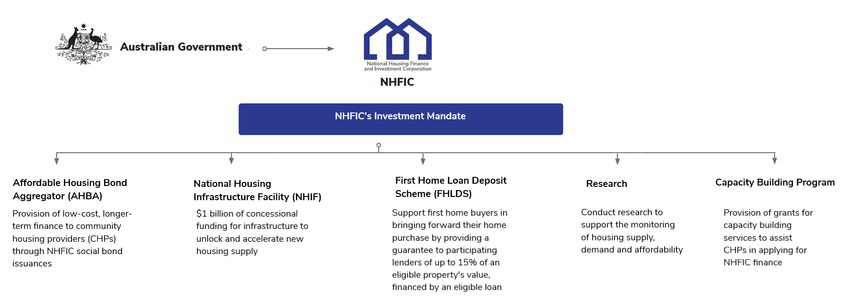
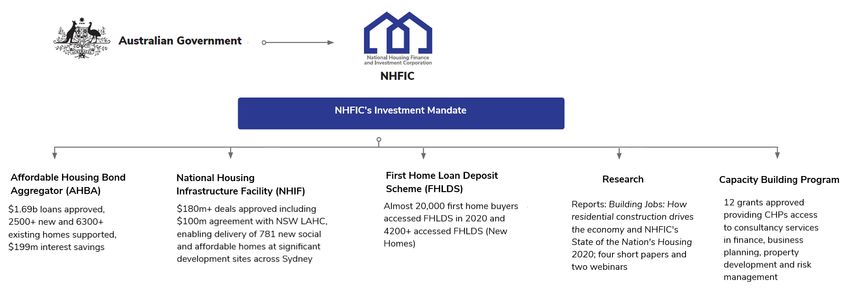
Property Council of Australia's Residential Outlook 2021 - Nathan Dal Bon Chief Executive Officer
What we do
Property Council of Australia's Residential Outlook 2021 - Nathan Dal Bon Chief Executive Officer
What we have achieved
First home buyers are on the rise
First home buyers as a proportion of total new lending

                              60%                                                                                                                                               20,000

                              50%
                                                                                                                                                                                16,000
Proportion of total lending

                                                                                                                                                                                         Number of FHBs
                              40%

                                                                                                                                                                                12,000

                              30%

                                                                                                                                                                                8,000
                              20%

                              10%                                                                                                                                               4,000
                                    2001

                                           2002

                                                  2003

                                                         2004

                                                                2005

                                                                       2006

                                                                              2007

                                                                                     2008

                                                                                            2009

                                                                                                   2010

                                                                                                          2011

                                                                                                                 2012

                                                                                                                        2013

                                                                                                                               2014

                                                                                                                                      2015

                                                                                                                                             2016

                                                                                                                                                    2017

                                                                                                                                                           2018

                                                                                                                                                                  2019

                                                                                                                                                                         2020
                                                                         FHBs as a proportion of total lending (LHS)           Number of FHBs (RHS)
Strong support for first home buyers
Government stimulus

               Max. stimulus benefit value for FHB   Level of assistance as a percentage of the
       State
                 (up until 31 December 2020)             average property value for a FHB

        NT                  ~$88,000                                  19.0%
                                                                                                  Government stimulus includes:
       WA                   ~$82,000                                  18.6%                       • HomeBuilder
                                                                                                  • First Home Owner’s Grant
       TAS                  ~$64,000                                  16.7%                       • Other building bonus grants
                                                                                                  • Stamp duty concessions
       VIC                  ~$86,000                                  16.0%
                                                                                                  • First Home Loan Deposit Scheme
       NSW                  ~$85,000                                  13.5%

       QLD                  ~$63,000                                  13.4%

        SA                  ~$53,000                                  13.0%

       ACT                  ~$63,000                                  11.2%
First home buyers supported by FHLDS
   Distribution of FHLDS places by state compared with population
    40%

            35% 35%
                                                                        FHLDS FY2019-20           FHLDS FY2020-21          NHG FY2020-21       Population
                        32%         32%

    30%                                                29%

                              26% 26%                        26%
                                                     24%
                                               24%

                  20%                    20%
    20%

                                                                         15%

                                                                               10%
    10%
                                                                        8%
                                                                   7%                             7%
                                                                                     5%
                                                                                          4% 3%
                                                                                                         2% 2%        2%     2% 1%        2%
                                                                                                                 1%                  0%        0% 0% 0% 1%
      0%
                  NSW              QLD                VIC               WA                 SA               ACT                  TAS               NT
Source: NHFIC / ABS
Largest population shock in a century
COVID-19 will decrease Australia’s population growth
Is the city exodus real?
   Less people moving from regions to the cities

     Nationally, 25,500 fewer departures                                                                                 It’s a Melbourne story…
             Thousand                                                                             Thousand
                                                                                                                                  Thousand                                                                    Thousand
                                                                                                                         100                                                                                                  100
       300                                                                                                        300

                                                                                                                          95                                                                                                  95

                                                                                                                          90                                                                                                  90

       250                                         Capital city residents                                         250
                                                                                                                          85                   Departures from                                 Arrivals to                    85
                                                  moving to regional areas                                                                                                                     Melbourne
                                                                                                                                                 Melbourne

                                                                                                                          80                                                                                                  80

                                                                                                                          75                                                                                                  75
       200                                                                                                        200

                                                                                                                          70                                                                                                  70
                                                                                            25,500 fewer
                    Regional area residents moving to capital cities                         departures
                                                                                                                          65                                                                                                  65

       150                                                                                                         150    60                                                                                                   60
         Sept 02                              Sept 08                             Sept 14                    Sept 20      Sept 02                              Sept 08                              Sept 14              Sept 20

             ABS, Regional Internal Migration Estimates, Provisional, September 2020.                                          ABS, Regional Internal Migration Estimates, Provisional, September 2020.

Source: Centre for Population
New supply expected to outstrip new demand
 (new household formation) for next two years....
   State of the Nation’s Housing

Source: CoreLogic
Rent falls have been uneven
  (% change in rents March 2020 to January 2021)

                              Melbourne - Inner         -11.2%

                    Sydney - City and Inner South        -10.8%

                        Sydney - Eastern Suburbs                         -6.2%

                          Melbourne - Inner East                                 -4.4%

                             Sydney - Inner West                                  -3.8%

                               Riverina (Griffith)                                             4.50%

                         Coffs Harbour - Grafton                                                       7.40%

            Mid North Coast (Port Macquarie)                                                                   9.30%

                     South Australia - South East                                                              9.6%

                                            Perth                                                               9.8%

                                          Darwin                                                                       11.1%

                             Central Queensland                                                                        11.4%

                                                 -15%             -10%             -5%    0%   5%          10%                 15%

Source: CoreLogic
Who’s benefiting from the rent falls?
   Annual change in rent by price quartile – Dec 2019 – Dec 2020
                              0%

                              -1%

                              -2%
      Annual change in rent

                              -3%

                              -4%

                              -5%

                              -6%
                                    25th percentile            50th percentile   75th percentile
                                                               Price quartile

                                                      Sydney        Melbourne

Source: CoreLogic
Source: CoreLogic
Where are the opportunities?
As economic stimulus tapers, what can sustain the momentum in the
property market?

CHP sector will play an important role
•   Increased demand for affordable and social housing expected in the wake of COVID-19
•   CHP sector resilient during pandemic, with little impact expected on development pipelines
•   Developer and investor interest in partnering with CHPs increases during COVID
Investors
•   We’ve seen increased interest in social bond investment          States and territories
•   Post COVID-19 social bonds have grown 800% globally              •   State/territory investment into social and
                                                                         affordable housing, eg NSW ($900 million
•   Our last three bonds have been oversubscribed.
                                                                         additional; total $4.4 billion over four years),
Lenders                                                                  Victoria ($5.4 billion over four years).
•   Joint lending: Cbus, CHRP, state government stimulus
You can also read