SHORT-TERM RENTALS IN - Opportunities and Risks David Wachsmuth
←
→
Page content transcription
If your browser does not render page correctly, please read the page content below
SHORT-TERM
     RENTALS IN
     FLO RIDA
      Opportunities and Risks

           David Wachsmuth
Canada Research Chair in Urban Governance
            McGill University

            August 25, 2020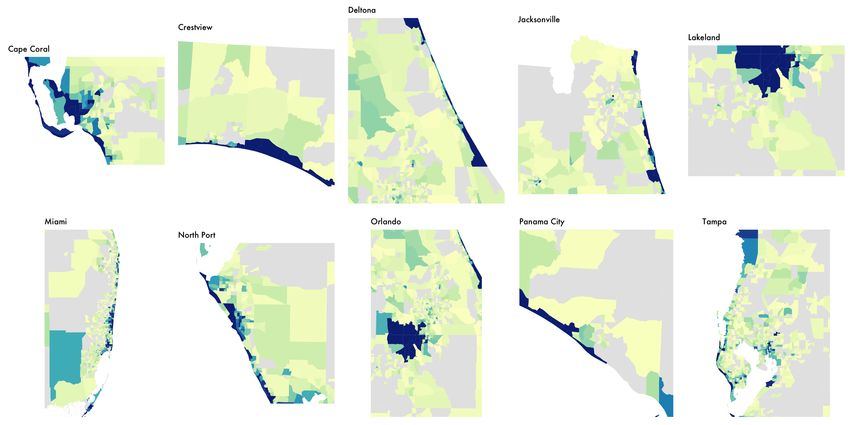
Urban Politics
and Governance
research group
1) The facts about short-term rentals in
                 Florida

  2) Who profits on Airbnb and VRBO?

3) How has Covid-19 impacted the market,
     and when is it likely to recover?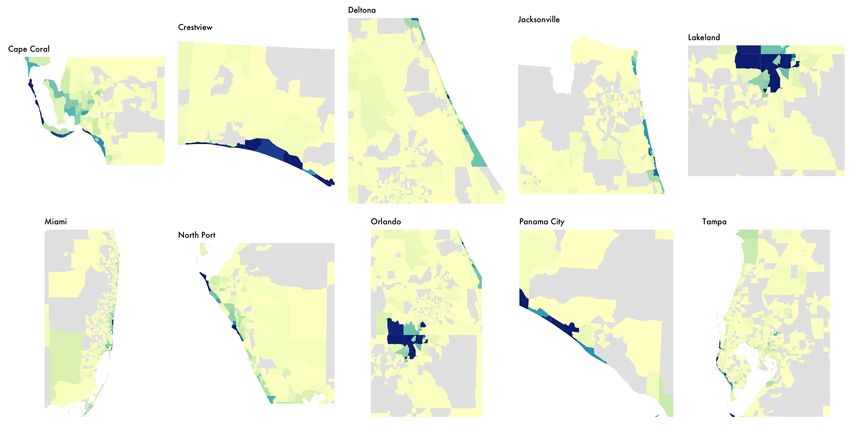
Methodology
Methodology

             We have data about…

1. Every Airbnb/VRBO property in the world
      2. Every single day since 2015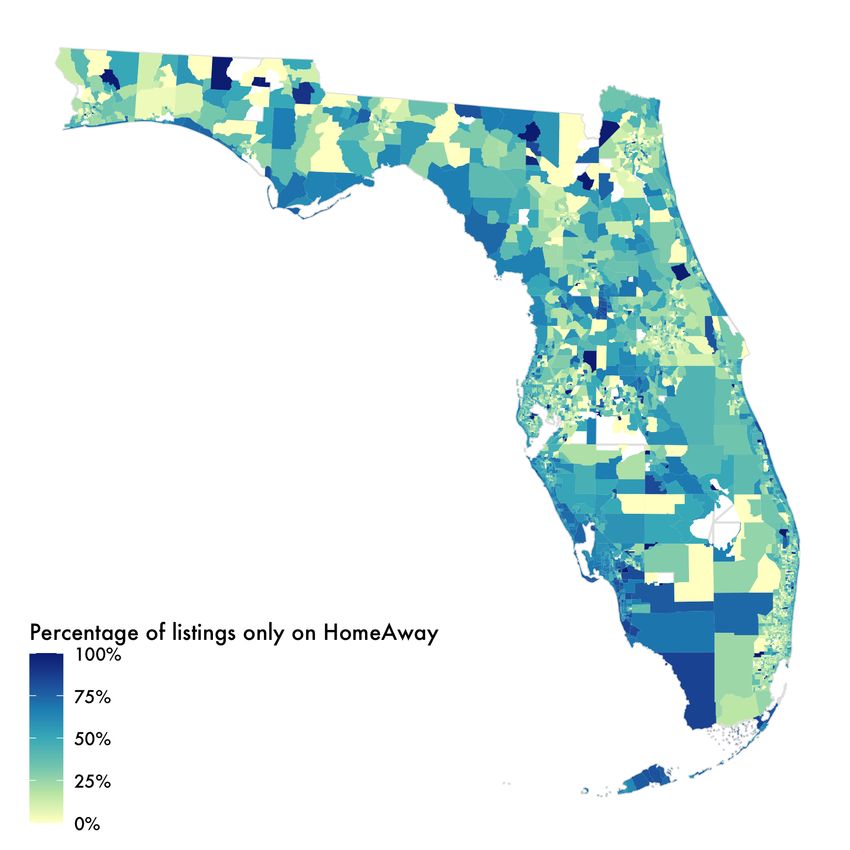
Methodology

                          Two goals

                           Two goals
                    Improve spatial resolution
“Very frequently rented”: 120 nights reserved, 240 nights available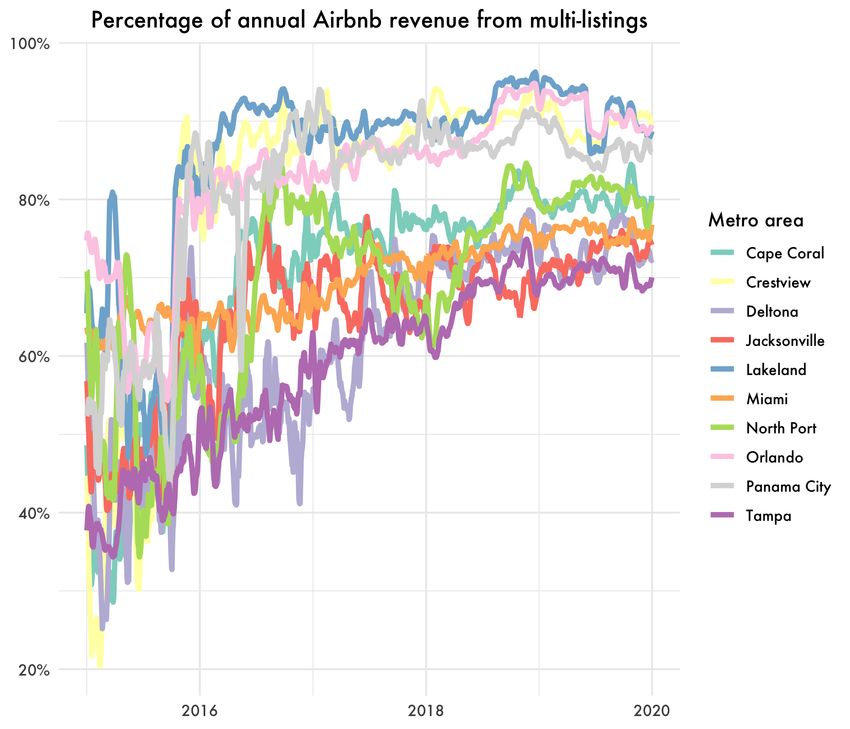
Methodology

             The bottom line

We have the best, most reliable data
about short-term rentals in the world.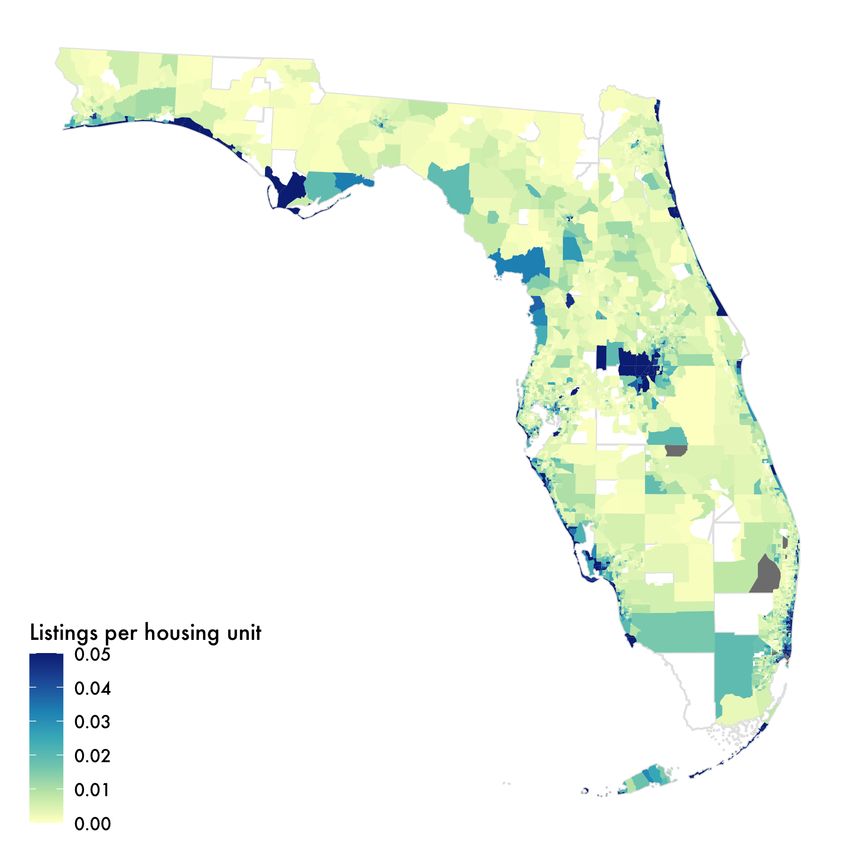
The facts about short-term
     rentals in Florida

           1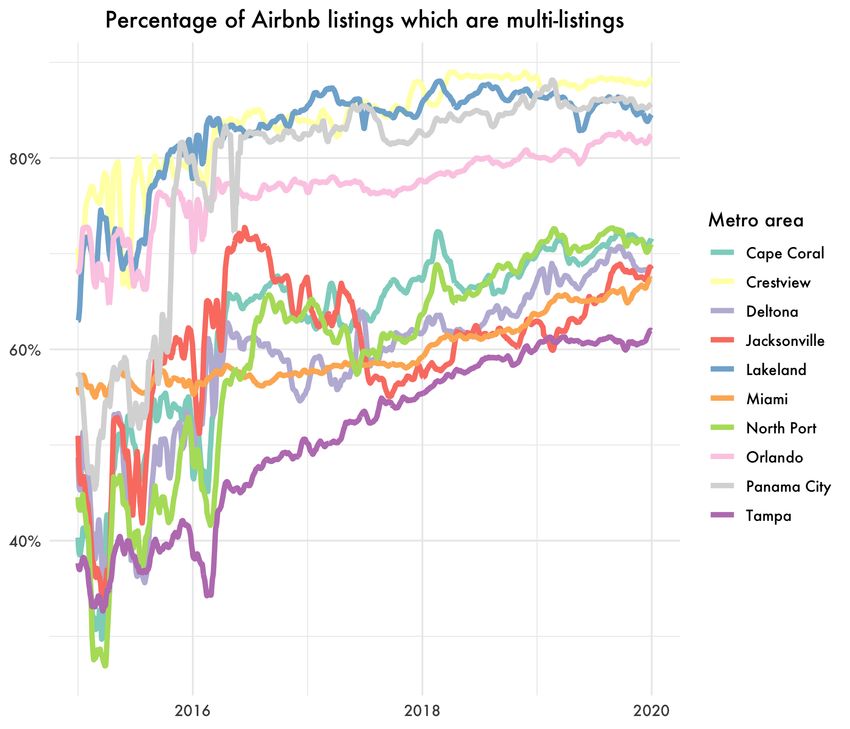
In 2019...
(We'll get to 2020 later.)
161,900 STRs active each day in Florida,
        operated by 38,400 hosts

 Earned $6.4 billion last year ($39,500 per
   listing, although median was $11,400)

Mostly entire homes (90.3%), actual housing
(95.9%) and commercially operated (53.8%)

    Even split between Airbnb (44.6%)
            and VRBO (55.3%)
From now on, we’re just talking about HOUSING (not hotels, not B&Bs, etc.) 155,200 housing STRs active each day in Florida, operated by 37,200 hosts Earned $6.2 billion last year ($40,100 per listing, although median was $11,600)
How does Florida compare with
   the rest of the country?
How does Florida compare with
   the rest of the country?

                        State            Active listings
                    1   Florida          155,200
                    2   California       111,600
                    3   New York         52,400
                    4   Texas            46,200
                    5   Colorado         36,800
                    6   North Carolina   30,500
                    7   South Carolina   26,300
                    8   Georgia          25,000
                    9   Hawaii           25,000
                    10 Arizona           22,000
How does Florida compare with
the rest of the country?
State Listings / 1000
1 Hawaii 17.6
2 Vermont 10.6
3 District of Columbia 8.2
4 Maine 7.6
5 Florida 7.5
6 Colorado 6.7
7 Montana 5.7
8 South Carolina 5.3
9 Alaska 4.6
10 Utah 4.5How does Florida compare with
the rest of the country?
State Revenue ($ bil)
1 Florida $6.2
2 California $4.7
3 New York $1.7
4 Hawaii $1.7
5 Colorado $1.6
6 Texas $1.3
7 North Carolina $1.2
8 South Carolina $1.1
9 Tennessee $0.9
10 Massachusetts $0.8How does Florida compare with
the rest of the country?
State Revenue per cap.
1 Hawaii $1,220
2 Vermont $390
3 Florida $300
4 Colorado $290
5 Maine $250
6 South Carolina $230
7 District of Columbia $230
8 Montana $200
9 Wyoming $170
10 Delaware $170How does Florida compare with
the rest of the country?
State Revenue / listing
1 Hawaii $69,200
2 Massachusetts $47,600
3 Delaware $47,000
4 Tennessee $45,100
5 Wyoming $44,400
6 South Carolina $44,700
7 Louisiana $43,200
8 Colorado $42,900
9 California $42,100
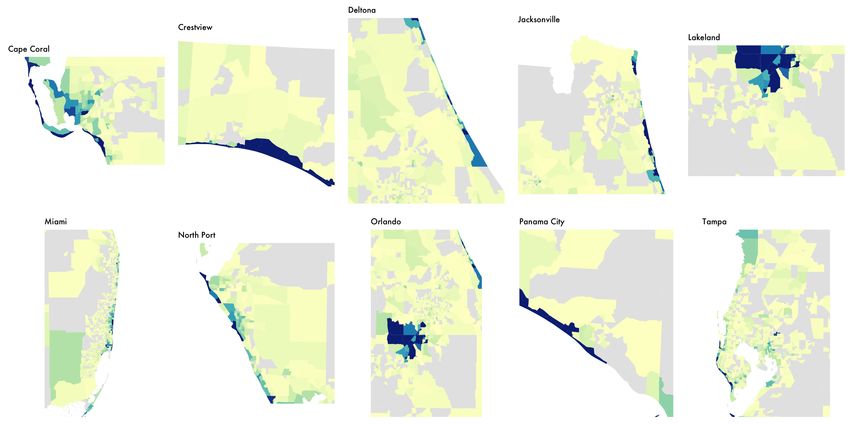
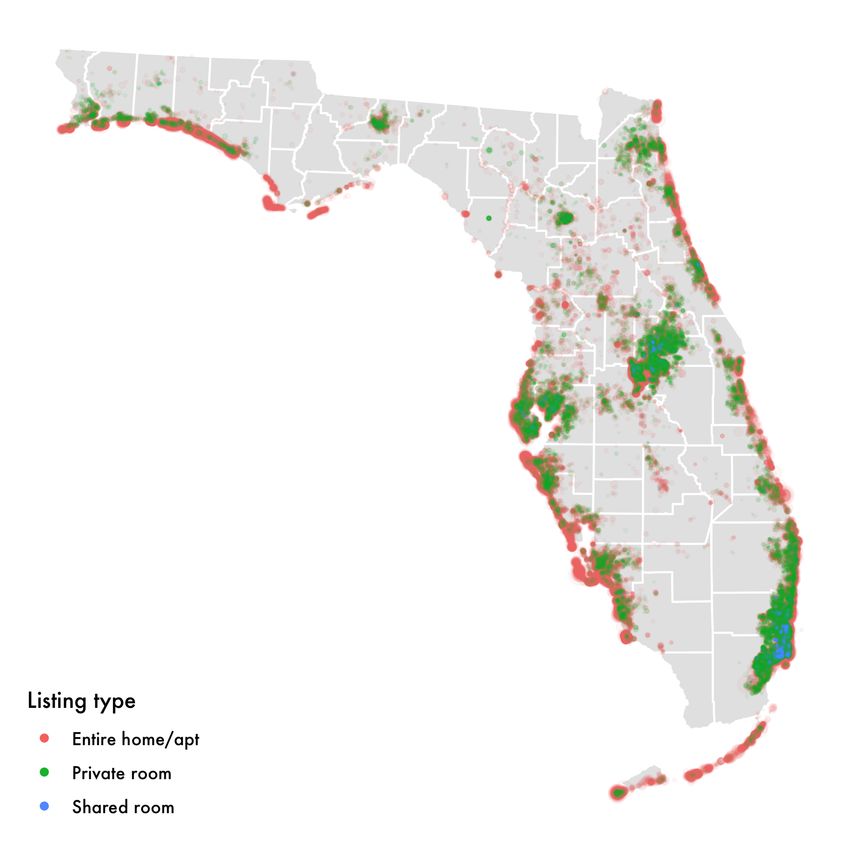
10 Florida $40,100How are STRs distributed throughout Florida?
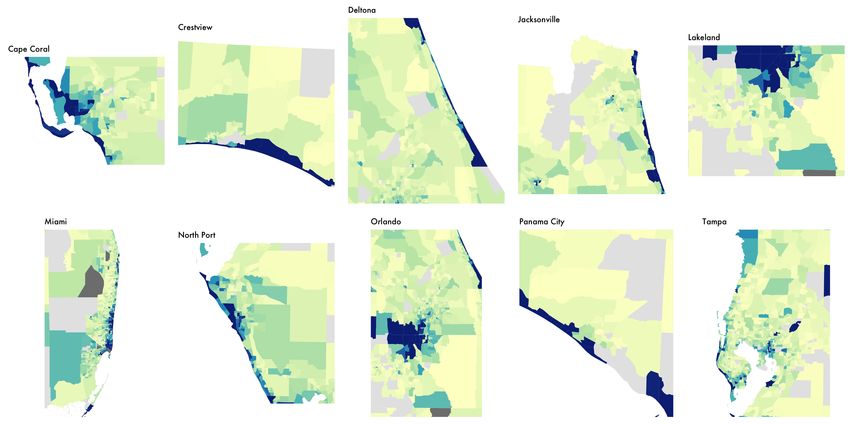
How are STRs distributed
  throughout Florida?
How are STRs distributed
  throughout Florida?
Where is VRBO more popular
       than Airbnb?
What are the growth trends?
(Just listings on Airbnb)Listing activity growth steady
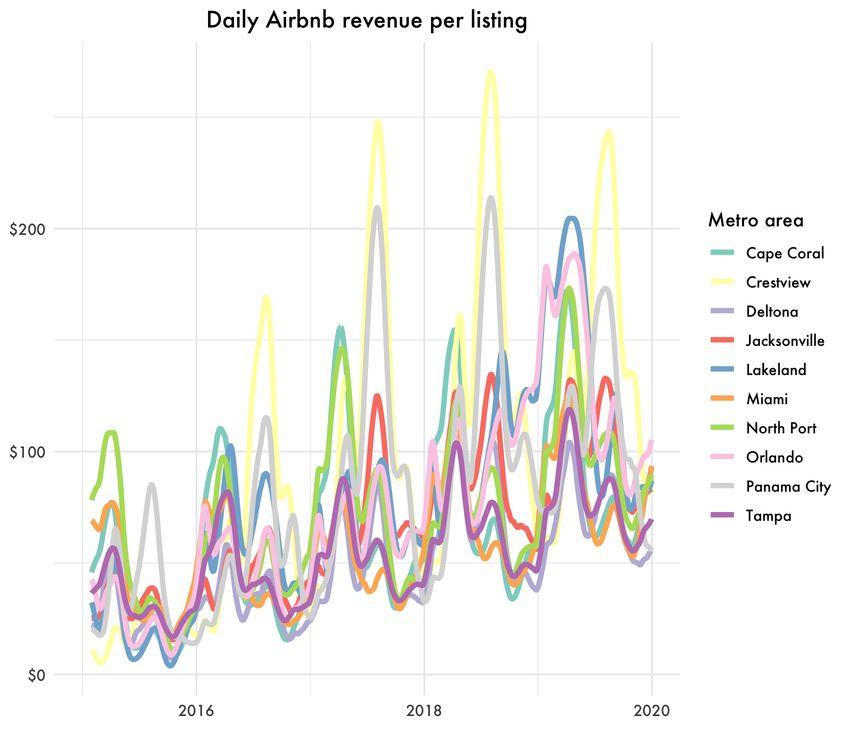
But revenue growth accelerating
Revenue per listing is climbing
To summarize…

             1. Florida leads the country in STRs.
 2. STRs are concentrated along coasts and around Orlando.
                  3. Listing growth is steady.
4. Revenue growth is accelerating, with Orlando pulling ahead.
Who profits on Airbnb
and VRBO?
2How is revenue distributed between hosts?
Casual “home sharers”?
Dedicated commercial operators?How is revenue distributed between hosts?
How is revenue distributed between home sharers
           and commercial operators?
How is revenue distributed between home sharers
and commercial operators?How is revenue distributed between metro areas?
Commercial STRs are
unpopular with neighbors.

       Nuisance: noise, garbage, etc.
  Housing costs: particularly bad for renters
  Regulatory compliance: increasingly strict
The best predictors of community
opposition to STRs are:
1) Share of housing converted to full-time STRs
2) Housing costs relative to local incomesFrequently rented entire-home listings
Available at least half the year (183 nights)
Booked at least half that time (90 nights)Frequently rented entire-home listings
To summarize…

1. Florida’s STR market is unusually dominated by commercial
         operators, and that dominance is increasing.
  2. Pricing per night is relatively consistent across the state.
3. Frequently rented entire-home listings are a growing share of
                        all STR activity.
How has Covid-19 impacted
the market, and when is it
likely to recover?
3Unprecedented drop in STR activity worldwide During what should have been the spring/summer rush
Listing activity down dramatically
Revenue growth even more
Dedicated STRs hardest hit
But signs of recovery already...
The key challenges

          1) Lack of progress in suppressing pandemic
2) Competition with hotels, which have different pricing incentives
To summarize…
1. STR activity collapsed because of Covid-19.
2. Commercial operations hardest hit.
3. Signs of recovery, but price competition from hotels will be
fierce.
4. Expect a slow shift away from dedicated STRs.Q&A What would you like to know about short-term rentals?
Thank you!
You can also read