Proteome alterations in the aqueous humor reflect structural and functional phenotypes in patients with advanced normal tension glaucoma
←
→
Page content transcription
If your browser does not render page correctly, please read the page content below
www.nature.com/scientificreports
OPEN Proteome alterations
in the aqueous humor reflect
structural and functional
phenotypes in patients
with advanced normal‑tension
glaucoma
Si Hyung Lee1,2,5, Jae Hun Jung3,5, Tae Kwann Park1,2, Chae‑Eun Moon3, Kyusun Han3,
Jinhyoung Lee3, Hyung Keun Lee3, Yong Woo Ji3,4,5* & Chan Yun Kim3,5*
Previous reports have shown possible association between altered protein levels in aqueous humor
(AH) and normal-tension glaucoma (NTG), but the underlying pathogenetic mechanism as well
as specific molecular biomarkers for NTG remains still elusive. Here, we aimed to identify novel
biomarkers for advanced NTG by analyzing the proteome of patient-derived AH and their correlation
with various functional and structural parameters from the visual field test (VF), optical coherence
tomography (OCT), and OCT angiography (OCTA). We determined differentially expressed proteins
(DEPs) of the AH of patients with advanced NTG (n = 20) using label-free quantitative (LFQ) proteomics
with pooled samples and data-independent acquisition (DIA) analysis with individual samples, and
the roles of AH DEPs in biological pathways were evaluated using bioinformatics. We identified 603
proteins in the AH of patients with advanced NTG, and 61 of them were selected as DEPs via global
proteome LFQ profiling. Individual DIA analyses identified a total of 12 DEPs as biomarker candidates,
seven of which were upregulated, and five were downregulated. Gene ontology enrichment analysis
revealed that those DEPs were mainly involved in the immune response. Moreover, IGFBP2, ENO1,
C7, B2M, AMBP, DSP, and DCD showed a significant correlation with the mean deviation of VF and
with peripapillary and macular parameters from OCT and OCTA. The present study provides possible
molecular biomarkers for the diagnosis of advanced NTG.
Glaucoma is a chronic progressive optic neuropathy involving the gradual loss of retinal ganglion cells (RGCs)
with characteristic visual-field loss and is a leading cause of irreversible blindness w
orldwide1,2. Primary open-
angle glaucoma (POAG) is the most prevalent form of glaucoma, and increased intraocular pressure (IOP) is
considered as the most important risk factor for P OAG3. Normal-tension glaucoma (NTG) is a subset disease
entity of POAG with an IOP within the normal range (10–21 mmHg), and is more prevalent in the Asian
population4–6. In NTG patients, non-IOP factors, such as vascular factors, have been suggested as important
causes of glaucomatous damage p rogression7–12, but the exact associations of these factors are still unclear.
Although there are cases that progress despite the maintenance of target IOP, the currently available treatments
for glaucoma mainly involve interventions to lower the IOP. Therefore, there are still mysteries to unravel regard-
ing this multifactorial disease.
1
Department of Ophthalmology, College of Medicine, Soonchunhyang University, Cheonan, Republic of
Korea. 2Department of Ophthalmology, Soonchunhyang University Hospital Bucheon, Bucheon, Republic of
Korea. 3Institute of Vision Research, Department of Ophthalmology, Severance Hospital, Yonsei University, College
of Medicine, 50‑1 Yonsei‑ro, Seodaemun‑gu, Seoul 03722, Republic of Korea. 4Department of Ophthalmology,
Yongin Severance Hospital, Yonsei University, College of Medicine, 363 Dongbaekjukjeon‑daero, Giheung‑gu,
Yongin‑si, Gyeonggi‑do 16995, Republic of Korea. 5These authors contributed equally: Si Hyung Lee, Jae Hun Jung,
Yong Woo Ji and Chan Yun Kim. *email: lusita30@yuhs.ac; kcyeye@yuhs.ac
Scientific Reports | (2022) 12:1221 | https://doi.org/10.1038/s41598-022-05273-0 1
Vol.:(0123456789)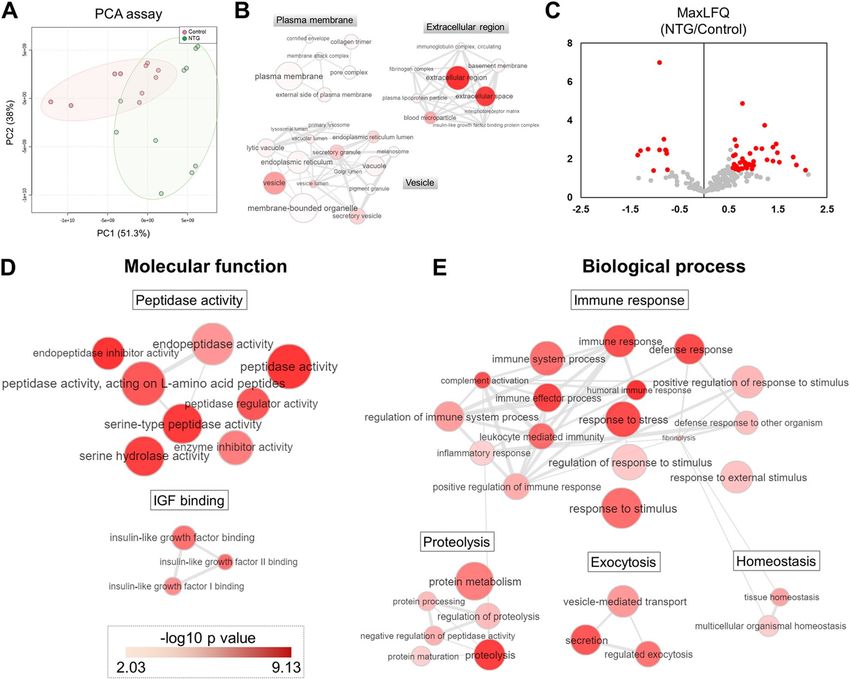
www.nature.com/scientificreports/
Baseline characteristics Control (n = 20) NTG (n = 20) p
Age (range) 67.2 (55–75) 67.2 (60–78) 0.427
Female/male 8 / 12 8 / 12 0.626
Hypertension 5 5 1.000
Diabetes mellitus 5 5 1.000
Hyperlipidemia 3 3 1.000
Cerebrovascular accident 0 0 NA
Cardiovascular disease 2 2 1.000
Baseline IOP 16.75 ± 2.15 16.65 ± 2.08 0.275
Cup/disc ratio 0.35 ± 0.20 0.88 ± 0.10 < 0.001
Axial length 23.36 ± 0.75 23.35 ± 0.65 0.077
Table 1. Baseline demographic characteristics of normal controls and NTG patients. NTG normal tension
glaucoma, IOP intraocular pressure.
The aqueous humor (AH) is a clear, essential biological fluid that flows from the posterior chamber to the
anterior chamber, exiting through the trabecular meshwork. A balance between secretion and drainage of AH is
important in the maintenance of IOP13. In addition, while circulating inside the eye, AH is enriched with endog-
enous proteins (normal and pathologic) secreted from nearby intraocular structures. Particularly, AH contains
not only proteins secreted from the anterior segment of the eye but also from the posterior segment (including
neural tissues) of the eye. A number of studies have reported associations of AH proteome with r etinal14–17 and
neurodegenerative diseases18,19.
Previous studies have investigated protein composition differences in the AH between POAG and non-POAG
subjects. Early studies used microarray techniques to detect a number of proteins, which were only a subset of
the total proteome of A H20–22. Recently, as liquid chromatography tandem-mass spectrometry (LC–MS/MS),
which provides unbiased information on the total proteome of an AH sample, was introduced, several studies
have reported protein composition changes in POAG patients, suggesting potential biomarkers and possible
mechanisms involved in glaucoma progression23–27. However, there is no previous study regarding AH proteome
in patients with NTG. Considering the differences in clinical characteristics between NTG and POAG patients,
there is a great need for determining the AH proteome of these patients to elucidate the underlying mechanisms.
In light of the above, in this study, we investigated the composition changes in the AH proteome of patients
with advanced NTG. In addition, to investigate the clinical relevance of differentially expressed proteins (DEPs)
in AH, we analyzed the association between expression levels of AH DEPs and clinical parameters from the visual
field exam (VF), optical coherence tomography (OCT), and OCT angiography (OCTA).
Results
Demographic characteristics of subjects. The demographics of subjects enrolled in this study are sum-
marized in Table 1. There were no significant differences between the advanced NTG group and the control
group in baseline characteristics, including age and sex. Among the ocular parameters assessed, baseline IOP
and axial length were not different between the two groups, while cup/disc ratio was significant larger in the
advanced NTG group (p < 0.001). Structural and functional parameters from VF, OCT, and OCTA are displayed
in Supplementary Table S1.
Comprehensive profiling of AH proteome in the advanced NTG and control groups. The label-
free quantification (LFQ) analysis using pooled sample from each group (n = 5 for each pooled sample) identi-
fied a total of 603 proteins at the 1% false discovery rate (FDR) level using the MaxQuant search engine (Supple-
mentary Table S2). To investigate the quantitative reproducibility, we calculated correlation of log2 fold changes
between two technical replicates in each biological sample. Based on the results, the duplicate mass spectrometry
analysis showed excellent consistency, with an average R2 correlation value of 0.953 (Supplementary Fig. S1).
Next, we subjected the obtained proteome profile data to principal component analysis (PCA) analysis to
compare the general clustering trends between the NTG and control groups. PCA revealed the clustering of two
groups with 51% (PC1), indicating distinct protein expression patterns between the two groups (Fig. 1A). To
understand the characteristics of the AH proteome, we investigated the localization of the AH proteome based
on the gene ontology (GO) cellular component28. Most AH proteins were found to be proteins of the plasma
membrane, extracellular region, or associated with vesicles (Fig. 1B).
To identify the AH proteins with altered abundances in NTG, we assessed DEPs in comparison with controls.
To avoid endogenously biased comparisons, only 217 proteins with three or more valid values in each group were
used for quantification. After the implementation of a normalization process to correct for systematic bias across
comparison groups, MaxLFQ based statistical analysis yielded 61 DEPs with an FDR-adjusted p value less than
0.05. Among the 61 DEPs, 50 proteins were upregulated and 11 proteins were downregulated in patients with
NTG compared with the controls (Fig. 1C; Supplementary Table S3).
GO biological processes involved in NTG. We examined the biological functions of the 61 DEPs by
performing enrichment analysis of GO and Reactome pathway (Supplementary Table S4). The DEPs were sig-
Scientific Reports | (2022) 12:1221 | https://doi.org/10.1038/s41598-022-05273-0 2
Vol:.(1234567890)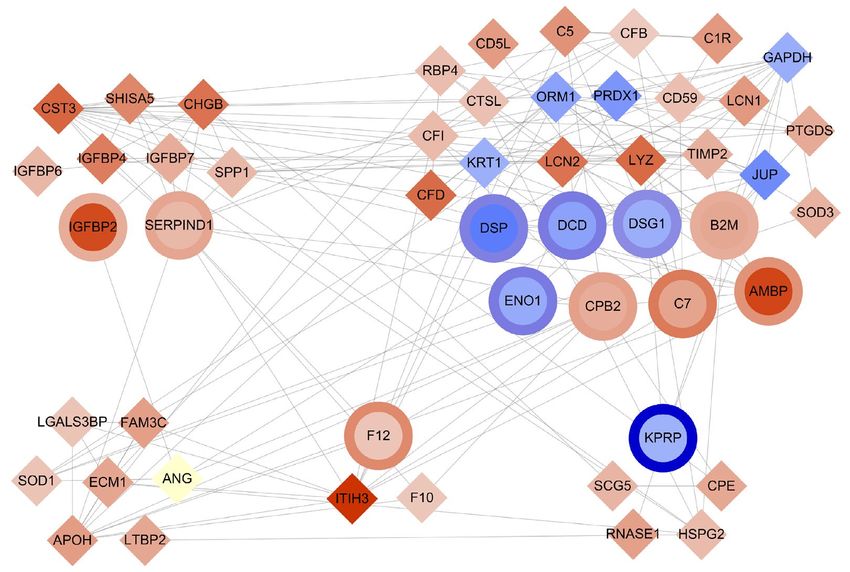
www.nature.com/scientificreports/

                                  Figure 1.  (A) Principal component analysis plot for global proteomic data in the control and normal tension
                                  glaucoma (NTG) groups. (B) Gene Ontology cellular component (GOCC) interactive clusters of proteome in
                                  aqueous humor (AH), indicating proteins found in AH were mainly located in plasma membrane, extracellular
                                  region, or associated with vesicles. (C) Volcano plot displaying the differences in protein expression according
                                  to p value (y-axis) and the difference in their relative abundance ratio (log2 fold change) in AH between the two
                                  groups. Red dots represent differentially expressed proteins (DEPs) with p value less than 0.05 and fold change
                                  upper than 1.3. (D) GO molecular functions significantly enriched by DEPs in NTG compared with the control
                                  group are shown. (E) Significantly enriched GO biological processes (terms are clustered by representative group
                                  (Immune response, Proteolysis, Exocytosis, Homeostasis). GO terms are represented by circles, and semantic
                                  similarities were applied to clusters by other GO terms in the gene ontology. GO term is proportional to the size
                                  of the circle, whereas the color indicates the − log10 p value for the enrichment.

                                  nificantly (p < 0.01) involved in the molecular functions related to peptidase activity and insulin-growth Factor
                                  (IGF) binding (Fig. 1D). Furthermore, GO biological process analysis revealed that the DEPs in NTG were
                                  mainly involved in processes related to the immune response, proteolysis, exocytosis, and homeostasis (Fig. 1E).
                                  The IGF binding and immune response pathways were also identified by Reactome pathway analysis.

                                  Data independent acquisition (DIA) analysis for verification of DEPs. To verify altered protein
                                  expression, we performed DIA analysis using 10 individual AH samples in each group. As a result, 68 pro-
                                  teins were significantly up-regulated and 43 proteins were down-regulated with a fold change > 1.5 in relative
                                  abundance and a p value < 0.05 (Fig. 2A; Supplementary Table S5). Interestingly, a total of 12 DEPs verified by
                                  DIA analysis showed consistent increase and decrease trends compared with the LFQ analysis. As shown in
                                  Fig. 2B, the heat map revealed that 7 proteins simultaneously increased (AMBP, alpha-1-microglobulin/bikunin
                                  precursor; IGFBP2, IGF binding protein 2; C7, complement component 7; B2M, beta-2-microglobulin; CPB2,
                                  carboxypeptidase B2; SERPIND1, heparin cofactor 2; F12, coagulation factor XII) and 5 proteins decreased
                                  (DSP, desmoplakin; DCD, dermcidin; ENO1, enolase 1; DSG1, desmoglein-1; KPRP, keratinocyte proline-rich
                                  protein) in LFQ and DIA, respectively.

Scientific Reports |   (2022) 12:1221 |               https://doi.org/10.1038/s41598-022-05273-0                                                 3

                                                                                                                                            Vol.:(0123456789)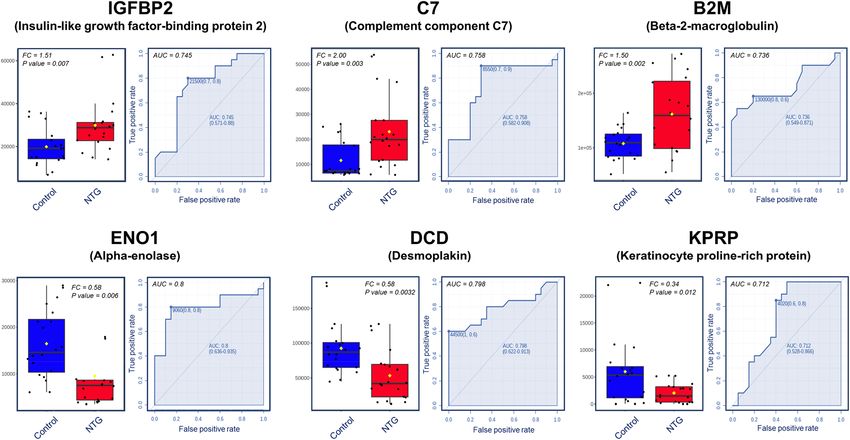
www.nature.com/scientificreports/

                                    A                                                                               B         EP EP
                                                                                                                                         Log2 Fold Change
                                                                 DIA quantification
                                                                                                                          Q _D _ D
                                                                                                                               A      -1.6       0          1.9
                                                                (Glaucoma/Control))
                                                                                                                        LF D I
                                         10
                                                                                                                                 AMBP
                                                                                                                                 IGFBP2
                                                                                                                                 C7
                                                                                                                                 B2M
                                                                                      F12                                        CPB2
                                          5                                            B2M
                                                                                                                                 SERPIND1
                                                                 DCD
                                                                                        IGFBP2                                   F12
                                                                                         C7
                                                               DSG1
                                                              ENO1                      AMBP                                     DSP
                                                             KPRP
                                                             DSP
                                                                                        CPB2
                                                                                        SERPIND1                                 DCD
                                                                                                                                 ENO1
                                                                                                                                 DSG1
                                          0
                                                                                                                                 KPRP
                                              -6           -3                0              3         6

                                    C                                                                                   Immune response
                                                  Regulation of
                                   Insulin-like Growth Factor (IGF) transport

                                                      Exocytosis                            Metabolic process                 Homeostasis

                                              Figure 2.  (A) Volcano plot depicting the variance in expression of proteins in the aqueous humor (AH)
                                              between the normal tension glaucoma (NTG) and control groups. Red dots represent significantly differentially
                                              expressed proteins (DEPs) (fold change > 1.5, p value < 0.05). Twelve DEPs in the label free quantification
                                              (LFQ) and data independent acquisition (DIA) analysis were consistently highlighted and labeled. (B)
                                              Heatmap showing the relative abundance of 12 DEPs consistently altered in the LFQ and DIA analysis. (C)
                                              Protein–protein interaction Network of AH DEPs in the NTG group versus the control group. Network model
                                              showing the biological processes affected, including the immune response, insulin-like growth factor transport,
                                              exocytosis, metabolic processes, and homeostasis. The colors of the nodes represent proteins whose levels were
                                              greatly increased (red) or decreased (blue) in NTG. The gray lines between nodes represent either a regulatory
                                              role or a physical interaction between proteins. Circle shaped nodes represent 12 verified DEPs (inner node:
                                              abundance change in the LFQ, outer layer: abundance change in DIA).

                                                  To explore the systematic functions of the aforementioned NTG-associated processes, we constructed a
                                              protein–protein interaction network describing the biological connection among DEPs (Fig. 2C). The network
                                              model demonstrated a significant activation of IGF transport (CST3, SHISA5, CHGB, IGFBP6, IGFBP4, IGFBP7,
                                              SPP1, IGFBP2, SERPIND1), exocytosis (LGALS3BP, FAM3C, SOD1, ECM1, APOH, LTBP2), and metabolic
                                              processes (ITH3, F10, F12). By contrast, the proteins in immune response and homeostasis processes were
                                              largely up-regulated in NTG, while conversely, a few proteins were down-regulated, indicating complex proteome
                                              changes in those process in the AH of NTG patients. Notably, 12 DEPs altered in LFQ and DIA belonged to IGF
                                              transport (IGFBP2, SERPIND1), metabolic process (F12), homeostasis (KPRP), and immune response (DSP,
                                              DCD, DSG1, ENO1, B2M, CPB2, C7, AMBP).

          Scientific Reports |   (2022) 12:1221 |                      https://doi.org/10.1038/s41598-022-05273-0                                                 4

Vol:.(1234567890)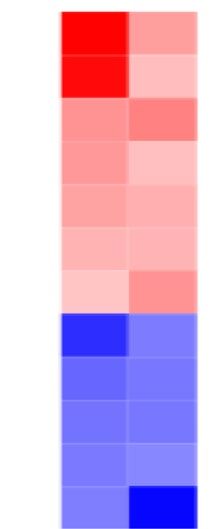
www.nature.com/scientificreports/
Clinical parameters Protein (Gene name) ra pb
Baseline IOP – – –
IOP fluctuation – – –
VF
MD IGFBP2 − 0.758 0.011
VFI – – –
OCT parameters
Mean RNFL thickness – – –
ENO1 0.729 0.017
C7 − 0.693 0.026
Mean GCIPL thickness
B2M − 0.669 0.035
DCD 0.687 0.028
OCTA parameters
Optic disc
Perfusion KPRP 0.770 0.009
Flux index KPRP 0.673 0.033
Macula
ENO1 0.697 0.025
C7 − 0.842 0.002
Vascular density DSP 0.685 0.029
B2M − 0.721 0.019
DCD 0.879 0.001
AMBP − 0.665 0.036
ENO1 0.652 0.041
C7 − 0.860 0.001
Perfusion density
DSP 0.646 0.043
B2M − 0.726 0.018
DCD 0.848 0.002
Microvasculature dropout DCD − 0.661 0.037
Table 2. Correlation between clinical parameters and expression levels of AH proteins in patients with NTG.
a
Spearman coefficients (r), bp values. AH aqueous humor, AMBP alpha-1-Microglobulin/Bikunin Precursor,
B2M beta-2-microglobulin, C7 complement component 7, DCD dermcidin, DSP desmoplakin, ENO1 alpha-
enolase, GCIPL ganglion cell inner plexiform layer, IGFBP2 insulin growth factor binding protein 2, IOP
intraocular pressure, KPRP keratinocyte proline-rich protein, MD mean deviation, OCT optical coherence
tomography, OCTAOCT angiography, RNFL retinal nerve fiber layer, VF visual field, VFI visual field index.
Correlation between clinical parameters and protein expression levels. To evaluate the clinical
significance of the DEPs detected in the AH of advanced NTG patients, we further investigated the correlation
between clinically important parameters from VF, OCT, and OCTA and expression levels of DEPs. As shown in
Table 2, a total of 8 of 12 DEPs were significantly correlated with the indices of VF, OCT, and OCTA. IGFBP2
showed a significant negative correlation with the mean deviation (MD) from the VF test, while no AH protein
showed significant correlation with visual field index. An evaluation of the OCT parameters showed that none
of the DEPs was significantly correlated with average retinal nerve fiber layer (RNFL) thickness, whereas ENO1
and DCD levels showed a positive correlation (and C7 and B2M levels showed a negative correlation) with aver-
age ganglion cell-inner plexiform layer (GCIPL) thickness.
Among the OCTA parameters, KPRP was the only AH protein that was positively and significantly correlated
with both optic disc perfusion and flux index, while a number of proteins, including AMBP, ENO1, C7, DSP,
B2M, and DCD showed significant correlations, either positive or negative, with macular vascular density or
perfusion density. Furthermore, the DCD expression level showed a significant negative correlation with the
presence of peripapillary choroidal microvasculature dropout (MvD). No AH protein showed a significant cor-
relation with baseline IOP and IOP fluctuation of the enrolled NTG patients. Representative cases are shown in
Fig. 3 to illustrate the correlation between the expression levels of selected proteins—including IGFBP2, ENO1,
DCD, and C7—and parameters from VF, macular OCT, and OCTA.
The diagnostic potential of the six proteins was further evaluated by receiver operating characteristic (ROC)
analysis. Figure 4 depicts the sensitivity and specificity for six proteins related to NTG (IGFPB2, C7, B2M, ENO1,
DCD, and KPRP) with area under the curve (AUC) values higher than 0.7 indicating a remarkable ability of the
classifier to distinguish NTG patients from normal controls.
To further validate the six proteins which showed significant correlation with VF, OCT, and OCTA, we
conducted ELISA and compared the concentration of six proteins between the control and NTG subjects (n = 5
from each group). As shown in Fig. 5, expression of IGFPB2, C7, and B2M was significantly upregulated in AH
of NTG subjects compared to that of normal control (p < 0.001 for IGFBP2 and B2M, p < 0.05 for C7), while
Scientific Reports | (2022) 12:1221 | https://doi.org/10.1038/s41598-022-05273-0 5
Vol.:(0123456789)www.nature.com/scientificreports/
Figure 3. Representative cases showing the correlation between visual field (VF), optical coherence
tomography (OCT) and OCT angiography (OCTA) parameters, and protein levels of aqueous humor (AH) in
patients with normal tension glaucoma. (A) Insulin-growth factor binding protein 2 (IGFBP2) in AH showed
a significant correlation with the mean deviation (MD) value from the VF test. (B) Alpha-enolase (ENO1) and
dermcidin (DCD) levels in AH were significantly associated with a decrease in macular ganglion cell inner
plexiform layer (GCIPL) thickness representing retinal ganglion cell (RGC) damage. (C) Reduced retinal
vascular (VD) and perfusion density (PD). Blood perfusion was significantly related to AH protein expression of
complement component 7 (C7).
expression of ENO1, DCD, and KPRP was significantly downregulated in AH of NTG group compared to the
controls (p < 0.05 for all three proteins).
Discussion
A few studies have been reported regarding proteome changes in POAG compared with non-glaucomatous
controls23–27. While the main pathogenesis of POAG involves increased IOP level, studies have focused on on
the functional changes of trabecular meshwork outflow facility by looking at protein expression changes in the
Scientific Reports | (2022) 12:1221 | https://doi.org/10.1038/s41598-022-05273-0 6
Vol:.(1234567890)www.nature.com/scientificreports/
Figure 4. Box plot and receiver operating characteristic (ROC) curve of six selected marker proteins in
the aqueous humor (AH) of patients with normal tension glaucoma (NTG). The box plot demonstrates the
differences of protein abundance in AH between the control and NTG groups. The fold change (FC) and p
value for each marker are indicated on the interactive box plots. The ROC curve yielded an area under the curve
(AUC) that indicates diagnostic efficiency.
Figure 5. Measurement of six selected marker protein levels using ELISA. Bar graphs demonstrate expression
levels of six marker proteins, including IGFBP2, C7, B2M, ENO1, DCD, and KPRP. All experiments were
repeated three times in at least triplicate (n = 5, Mann–Whitney U test for statistical analysis). *p < 0.05,
**p < 0.01, ***p < 0.001.
Scientific Reports | (2022) 12:1221 | https://doi.org/10.1038/s41598-022-05273-0 7
Vol.:(0123456789)www.nature.com/scientificreports/
AH of POAG patients. However, in NTG, which is not associated with increased IOP, the proteomic changes
found in the AH may indirectly reflect pathogenetic changes in RGCs or in the optic nerve head. In this study, we
applied two sequential approaches using high-resolution LC–MS/MS, which are mainly employed in biomarker
research: MaxLFQ for global quantitative proteomics and DIA quantification for accurate verification. Among
603 identified proteins from AH with NTG, 51 DEPs were observed in global profiling analysis, and 12 DEPs
were finally identified in a DIA analysis, which may be considered as candidates for AH biomarkers for NTG.
These AH biomarker candidates for NTG were found to be mainly involved in the immune response as well
as in IGF transport regulation, exocytosis, metabolic processes, and homeostasis. In particular, the expression
levels of 8 DEPs, namely IGFBP2, ENO1, C7, B2M, DCD, KPRP, DSP, and AMBP, were found to be significantly
associated with changes in VF, OCT, and OCTA, which reveals the clinical relevance of AH proteins in NTG.
There have been a number of evidences suggesting neuroinflammation is one of a key pathogenetic mecha-
nism underlying glaucoma damage and d evelopment29,30. A number of molecular pathways have been suggested
as major regulators of neuroinflammation that may be implicated in glaucoma pathogenesis, including the
complement cascade31–35, Toll-like s ignaling36,37, and tumor necrosis factor α p athway38–42. Moreover, various
inflammatory cytokines, interferons, interleukins, and proteins involved in antigen presentation to T cells have
previously been reported to be involved in glaucoma43–45. Recently, several studies reported that proteins related
to immune system were highly abundant in AH of POAG patients compared to c ontrol24,25,46. Consistent with pre-
vious findings, our DEPs in AH in patients with NTG were involved in immune response, including B2M, CPB2,
and C7 as commonly identified proteins from previous POAG studies. Specifically, B2M (β2-microtubulin), is
a well-known major histocompatibility complex class I molecule involved in antigen presentation, and C7 is
reported to be involved in the innate immune response. AMBP is a complex glycoprotein reported to play a role in
the regulation of inflammatory processes. From these findings, we may speculate the proteome changes observed
in AH of glaucoma patients may indicate neuroinflammation may contribute to glaucoma development and
progression. However, further evidences are needed to reveal whether our results are true reflection of inflam-
matory process occurring at the optic nerve head and retina, which is located at the posterior pole of eyeball.
While previous studies have focused on proteome changes in glaucoma patients, we further sought for any
correlation between DEPs and various parameters from VF, OCT, and OCTA. In this study, the expression level
of IGFBP2 was significantly correlated with MD values. Previously, the IGFBP2 gene was reported to be signifi-
cantly associated with optic disc morphology in the Dutch p opulation47, indicating a possible relationship with
glaucoma severity. Among OCT and OCTA parameters, several proteins were associated with macular GCIPL
thickness as well as macular vascular and perfusion density, which include ENO1, C7, B2M, AMBP, DSP, and
DCD. Especially, DCD showed a significant negative correlation with peripapillary choroidal MvD. While C7,
B2M, and AMBP are mainly involved in immune responses, ENO1 is reported to be involved in glycolytic process
and its antibodies were mostly expressed in retinal ganglion cells and inner nuclear cells48. DSP is a junctional
protein required to maintain epithelial and vascular tissue integrity and has been previously reported to be
increased in the peripapillary sclera in an experimental glaucoma m odel49. While not much is known about DCD,
an anti-microbial peptide involved in proteolysis, it was reported to be present in the AH of rabbit e yes50, and was
previously recognized as a survival-promoting peptide in several cell lines under hypoxic or oxidative s tress51,52.
Interestingly, in the peripapillary OCT and OCTA analysis, only KPRP showed a significant association with
OCTA parameters. We speculate that the reason for such finding was that the NTG patients were advanced cases
with an RNFL thickness reaching a floor effect in the OCT and OCTA measurements, which is not the case of
macular parameters, according to previous r eports53–56. Taking this into account, the DEPs from the AH of the
advanced NTG patients included in this study may be potential biomarkers for the diagnosis of advanced NTG
cases and the confirmation of the NTG stage. However, further studies including large cohorts at each glaucoma
stage should be conducted to evaluate the relationship between AH biomarker proteins and disease severity.
There are several limitations in this study. First, the limited number of subjects may weaken the clinical
implications of our study. However, we carefully matched the groups for demographic characteristics, and no
significant differences were found for other possible confounding factors including various systemic vascular
comorbidities. Nevertheless, the findings of the present study should be validated in larger samples. Second,
we did not consider the effects of IOP lowering eyedrops on AH protein composition, including prostaglandin
analogue (PGA), beta-blocker, alpha-agonist, and carbonic anhydrase inhibitor agents. We included advanced
NTG patients who were on maximal tolerated medical therapy to minimize the effects of anti-glaucoma eyedrops
on AH proteome expression among NTG patients, but there is the possibility that eyedrop usage might affect the
protein composition of AH. However, there have been no reports regarding the possible effects of anti-glaucoma
agents on AH protein expressions, and further research is needed to reveal the effects of IOP lowering agents
on AH proteome. Third, careful interpretation is needed when looking at the results of this study since AH pro-
teome changes may not directly reflect structural and functional changes occurring in the optic nerve head and
retina. However, there is continuous exchange between AH and vitreous humor located in the posterior part of
the eye, and we may expect that a large composition of proteins found in vitreous may be similar to those found
in AH57–59. Further studies are needed to confirm the findings from this study that AH proteome alteration may
have implications on underlying pathogenesis of NTG.
In summary, this study demonstrated the changes in AH proteome composition in patients with advanced
NTG, and a large portion of DEPs found in AH of NTG patients were involved in immune responses. The sig-
nificant correlation between AH DEPs and clinically essential parameters indicates that AH proteins may be
considered as biomarker candidates for advanced NTG, which should be further evaluated in future studies.
Scientific Reports | (2022) 12:1221 | https://doi.org/10.1038/s41598-022-05273-0 8
Vol:.(1234567890)www.nature.com/scientificreports/
Methods
Subject enrollment and aqueous humor sampling. This cross-sectional case–control study was con-
ducted at Soonchunhyang University Hospital Bucheon. We enrolled a total of 40 subjects: 20 NTG patients and
20 age/sex-matched control subjects with simple cataract formation. Optic disc examination was performed
to screen any glaucomatous optic disc changes using slit-lamp examination and optic disc photographs (Zeiss
Clarus 500 fundus camera; Carl Zeiss Meditec, Dublin, CA, USA), and VF test was performed using Humphrey
visual field analyzer (Carl Zeiss Meditec). OCT (RNFL and GCIPL thickness) and OCTA parameters (optic disc
perfusion/flux index and macular vascular/perfusion density) were obtained with Cirrus HD-OCT (Carl Zeiss
Meditec). Peripapillary choroidal MvD was defined as a focal capillary dropout with no detectable microvascu-
lar network located at the peripapillary area in the deep-layer en-face images, and was suspected to include the
entire choroidal thickness. Axial length was measured with an IOL Master (Carl Zeiss Meditec).
The inclusion criteria for NTG group were deep anterior chamber depth (> 4 central corneal thickness) and
open angle on slit-lamp examinations. Clinical diagnosis of NTG was made based on IOP measurement, optic
disc examination, VF test, spectral-domain OCT results. Baseline IOP was recorded using averaged IOP from two
IOP readings measured by one glaucoma specialists (SHL) during office hours, and IOP fluctuation was defined
as standard deviation of IOP during last 2 year follow-up period before the surgery. Glaucomatous damage was
defined as RNFL defects or glaucomatous optic disc changes with corresponding VF defects, confirmed by at
least 2 reliable VF examinations. Only reliable VF test results with false-positive errors < 15%, false-negative
errors < 15%, and fixation loss < 20% were included in the study, and patients with MD < 12 dB on the standard
Swedish interactive threshold algorithm 24–2 program were included in the current study. All NTG subjects
were on maximally tolerated medical therapy, using eyedrops containing prostaglandin analogues, beta-blocker,
alpha-agonist, and carbonic anhydrase inhibitor. For both control and NTG group, subjects with baseline IOP
exceeding 21 mmHg or with any previous history of ophthalmic surgery were excluded, and also subjects with
concomitant other ophthalmic or neurologic disease that may possibly affect VF testing results were excluded.
We collected AH from 40 subjects (20 control, 20 NTG subjects) undergoing either cataract surgery or glau-
coma surgery (filtration or aqueous tube shunt surgery). The AH was sampled from subject’s eye by punctur-
ing the cornea with 30 gauge needle before performing any surgical steps, with amount of 0.5–1.0 mL of AH.
During this procedure, intraocular tissues including iris and lens were not violated. The AH samples were then
transferred to Biobank in Soonchunhyang University Hospital Bucheon and stored in a deep freezer at − 80 °C
for future proteomic analysis. This study was approved by the institutional review board of the Soonchunhyang
University Hospital Bucheon (IRB No. 2020-07-011-001), informed consent was obtained from all subjects for
AH sampling and analysis. All procedures performed in the present study adhered to the tenets of the Declara-
tion of Helsinki.
Sample preparation for proteomic analysis. Five AH samples from control and NTG subjects were
used for global profiling with LFQ. For verification, an additional ten AH samples from each group were sub-
jected to DIA analysis (Supplementary Fig. S2). For each AH protein sample, we performed depletion of highly
abundant proteins using Seppro IgY spin columns (Sigma Aldrich, St. Louis, MO, USA) to facilitate the detec-
tion of potential marker proteins presented at low abundance in AH. The protein concentration was measured
using the BCA protein assay, following the manufacturer’s instructions (Thermo Scientific, Rockford, IL). Sam-
ples of 100 μg total protein were digested into peptides by in-solution digestion as described previously60. Briefly,
10 M urea in 100 mM ammonium bicarbonate was mixed with each sample (v/v, 1:1) and the mixture was
incubated for 30 min at room temperature for denaturation. Reduction and alkylation of the cysteine residues
were then performed with 10 mM dithiothreitol and 30 mM iodoacetamide, respectively. The samples were then
digested with trypsin at a 50:1 (w/w) protein-to-protease ratio and incubated overnight at 37 °C. The activated
trypsin reaction was terminated with 0.4% trifluoroacetic acid, and peptides were desalted with a C18 spin col-
umn (Thermo, Rockford, IL, USA). The resultant peptides were dried and stored at − 80 °C. A retention time
normalization kit (iRT peptides, Biognosys, Switzerland) was used to spike samples at a concentration of 1:20
v/v in all samples as an external standard.
Quantitative global profiling. All samples were processed individually for LC–MS/MS. Digested AH
samples were re-suspended in 0.1% formic acid in water and analyzed using the Q Exactive orbitrap plus hybrid
mass spectrometer (Thermo Fisher Scientific, CA, USA) coupled with the EASY-nLC 1000 system (Thermo
Scientific, Bremen, Germany). For the proteome profiling analysis and DIA verification, peptide samples were
separated on an easy spray column (2 μm C18 particles, 50 cm × 75 μm ID), with a 120 min gradient (from 5
to 35% solvent B over 90 min, from 35 to 50% solvent B over 5 min, 80% solvent B for 10 min, and 5% solvent
B for 10 min) and analyzed by mass spectrometry. Solvents A and B were 0.1% formic acid in water and 0.1%
formic acid in acetonitrile, respectively. The peptides were loaded onto a trap column (75 μm × 2 cm, 3 μm, C18,
100 Å). Eluted peptides were ionized through an EASY-spray column (50 cm × 75 μm ID) packed with 2-μm C18
particles at an electric potential of 2.0 kV. The column temperature is maintained at 60 °C using a column heater.
Full MS survey scans were acquired in a scan range of 350–2,000 Th with a resolution of 70,000 at m/z 200. A
data-dependent top 10 method was operated during which higher-energy collisional dissociation (HCD) spectra
were obtained at 17,500 MS2 resolution with automated gain control (AGC) target of 1 × 10⁶ and maximum ion
injection time (IT) of 50 ms. The top ten abundant ions with an isolation window of 2.0 m/z were selected and
fragmented by data-dependent MS/MS experiments and exclusion duration of 30 s and at a normalized collision
energy of 27 for HCD. The charge state of 1 was discarded. Maximum ion injection times for full MS survey
scans and MS/MS scans were 100 ms and 50 ms, respectively. The AGC target value was set to 1.0 × 10⁶ for both
MS and MS/MS scans.
Scientific Reports | (2022) 12:1221 | https://doi.org/10.1038/s41598-022-05273-0 9
Vol.:(0123456789)www.nature.com/scientificreports/
Database search and quantitative analysis. The MS2 spectra were processed using the MaxQuant (v.
1.5.7.4, Max-Planck-Institute of Biochemistry, Munich, Germany) against the Uniprot human database61. MS/
MS searches performed with the following parameters: fixed modification of Carbamidomethylation, N-acet-
ylation of protein, and variable oxidation of methionine. The required FDR of 1% was applied at the peptide
spectrum match (PSM), protein levels and modification level. An initial precursor was matched to 4.5 ppm
tolerance and a 20 ppm for fragment spectra. Proteins were analyzed using the XIC-based LFQ algorithm in
MaxQuant (Max-Planck-Institute of Biochemistry). To maximize the number of quantification across samples,
the retention times of all quantified samples were aligned using “match between runs” option. The match time
window was 0.7 min, and the alignment time window was 20 min. Before loading LFQ intensity data, we pro-
cessed to eliminate reverse database, contaminants, and proteins only identified by site. All LFQ intensities
were processed using a log2 scale. Proteins that did not indicate all values in at least one group were filtered out.
Additionally, missing values were imputed by normal distribution (using a width of 0.3 and a downshift of 1.8).
Using LFQ intensities, proteins with expression greater than ± 1.3 (for global profiling) and 1.5 (for DIA analy-
sis) fold change from Student’s t test were considered as DEPs, and further enrichment analyses were conducted
using DEPs.
Individual DIA analysis and data processing. For DIA analysis, a retention time normalization kit (iRT
peptides, Biognosys, Switzerland) was used to spike samples at a concentration of 1:20 v/v in all samples as an
external standard62. 2 μg of each peptide sample was analyzed using Q-Exactive plus (Thermo Fisher Scientific)
equipped with an EASY-nLC 1000 UHPLC System (Thermo Fisher Scientific). DIA method covers the mass
range from 500 to 900 m/z with a resolution of 170,000 at 200 m/z. The AGC target was set at 1e6 with a 60-ms
maximum injection time. The normalized collision energy for HCD-MS2 experiments was set to 30%, the AGC
target was set at 2 e5, and the maximum injection time was set to 60 ms.
The DIA data were analyzed with Spectronaut Pulsar (version 11.0.15038.4.29119, Biognosys) using a search
archive spectral library, and the default settings were used for targeted analysis. In brief, a dynamic window for
the XIC extraction window and a non-linear iRT calibration strategy were used. Mass calibration was set to
local mass calibration. Interference correction on the MS1 and MS2 levels was activated, eliminating fragments/
isotopes from quantification based on the presence of interfering signals. The FDR was set to 1% at the peptide
precursor level and 1% at the protein level.
Enrichment analysis using GO and protein–protein interaction network. The GO of proteins was
classified using g:Profiler (https://biit.cs.ut.ee/gprofi ler)63 to explore the functionality of altered GO biological
process and GO molecular function in AH associated with glaucoma. A cutoff of p value < 0.05 was adjusted for
all GO categories. GO enrichment analysis results were reduced and summarized by semantic similarity using
REVIGO (http://revigo.irb.hr/) which is web-based tool64. To construct the protein–protein interaction net-
works, we interrogated protein–protein interactome information from the STRING version 11 public database
(https://string-db.org/). The network model was visualized using Cytoscape (v.3.8.2, National Institute of Gen-
eral Medical Sciences, Bethesda, USA). Other statistical analysis including the box plot and the corresponding
ROC curve have been generated using Metaboanalyst 4.0 server (https://www.metaboanalyst.ca/).
ELISA. To further confirm the expression level of DEPs, commercialized ELISA was performed to meas-
ure the concentration of DEPs including IGFBP2 (MBS177374, MyBioSource, CA, USA), ENO1 (MBS706020,
MyBioSource), DCD (EK13611, Signalway Antibody, MD, USA), C7 (KA2115, Abnova, Taipei City, Taiwan),
KPRP (MBS761698, MyBioSource), and B2M (ab99977, Abcam, Cambridge, UK). Five AH samples from each
group were used for ELISA. All experiments were repeated three times in at least triplicate.
Statistical analysis. Statistical significance for both demographic characteristics and DEPs was deter-
mined using Student’s t test or Fisher’s exact test, ROC analysis was conducted to determine diagnostic poten-
tials for NTG diagnosis using selected DEPs. Correlation between mean protein levels and various clinical tests
parameters were performed using Spearman correlation test. Statistical analyses were performed using SPSS
version 26.0 (IBM Corp., Armonk, NY, USA), and differences at p value less than 0.05 were considered statisti-
cally significant.
Received: 1 April 2021; Accepted: 23 December 2021
References
1. Resnikoff, S. et al. Global data on visual impairment in the year 2002. Bull. World Health Organ. 82, 844–851 (2004).
2. Quigley, H. A. & Broman, A. T. The number of people with glaucoma worldwide in 2010 and 2020. Br. J. Ophthalmol. 90, 262–267.
https://doi.org/10.1136/bjo.2005.081224 (2006).
3. Jonas, J. B. et al. Glaucoma. Lancet 390, 2183–2193. https://doi.org/10.1016/s0140-6736(17)31469-1 (2017).
4. Iwase, A. et al. The prevalence of primary open-angle glaucoma in Japanese: The Tajimi Study. Ophthalmology 111, 1641–1648.
https://doi.org/10.1016/j.ophtha.2004.03.029 (2004).
5. Kim, C. S., Seong, G. J., Lee, N. H. & Song, K. C. Prevalence of primary open-angle glaucoma in central South Korea the Namil
study. Ophthalmology 118, 1024–1030. https://doi.org/10.1016/j.ophtha.2010.10.016 (2011).
6. Cho, H. K. & Kee, C. Population-based glaucoma prevalence studies in Asians. Surv. Ophthalmol. 59, 434–447. https://doi.org/10.
1016/j.survophthal.2013.09.003 (2014).
Scientific Reports | (2022) 12:1221 | https://doi.org/10.1038/s41598-022-05273-0 10
Vol:.(1234567890)www.nature.com/scientificreports/
7. Broadway, D. C. & Drance, S. M. Glaucoma and vasospasm. Br. J. Ophthalmol. 82, 862–870. https://doi.org/10.1136/bjo.82.8.862
(1998).
8. Chopra, V. et al. Type 2 diabetes mellitus and the risk of open-angle glaucoma the Los Angeles Latino Eye Study. Ophthalmology
115, 227-232.e221. https://doi.org/10.1016/j.ophtha.2007.04.049 (2008).
9. Newman-Casey, P. A., Talwar, N., Nan, B., Musch, D. C. & Stein, J. D. The relationship between components of metabolic syndrome
and open-angle glaucoma. Ophthalmology 118, 1318–1326. https://doi.org/10.1016/j.ophtha.2010.11.022 (2011).
10. Lin, S. C., Singh, K. & Lin, S. C. Association between body levels of trace metals and glaucoma prevalence. JAMA Ophthalmol.
133, 1144–1150. https://doi.org/10.1001/jamaophthalmol.2015.2438 (2015).
11. Lee, S. H. et al. Vascular and metabolic comorbidities in open-angle glaucoma with low- and high-teen intraocular pressure: A
cross-sectional study from South Korea. Acta Ophthalmol. 95, e564–e574. https://doi.org/10.1111/aos.13487 (2017).
12. Lee, S. H. et al. Three toxic heavy metals in open-angle glaucoma with low-teen and high-teen intraocular pressure: A cross-
sectional study from South Korea. PLoS One 11, e0164983. https://doi.org/10.1371/journal.pone.0164983 (2016).
13. Carreon, T., van der Merwe, E., Fellman, R. L., Johnstone, M. & Bhattacharya, S. K. Aqueous outflow—a continuum from trabecular
meshwork to episcleral veins. Prog. Retin. Eye Res. 57, 108–133. https://doi.org/10.1016/j.preteyeres.2016.12.004 (2017).
14. Hillier, R. J. et al. Aqueous humor cytokine levels as biomarkers of disease severity in diabetic macular edema. Retina 37, 761–769.
https://doi.org/10.1097/iae.0000000000001210 (2017).
15. Jonas, J. B., Tao, Y., Neumaier, M. & Findeisen, P. Cytokine concentration in aqueous humour of eyes with exudative age-related
macular degeneration. Acta Ophthalmol. 90, e381-388. https://doi.org/10.1111/j.1755-3768.2012.02414.x (2012).
16. Kang, G. Y. et al. Exosomal proteins in the aqueous humor as novel biomarkers in patients with neovascular age-related macular
degeneration. J. Proteome Res. 13, 581–595. https://doi.org/10.1021/pr400751k (2014).
17. Midena, E. et al. Changes of aqueous humor Müller cells’ biomarkers in human patients affected by diabetic macular edema after
subthreshold micropulse laser treatment. Retina 40, 126–134. https://doi.org/10.1097/iae.0000000000002356 (2020).
18. Kwak, D. E. et al. Alterations of aqueous humor Aβ levels in Aβ-infused and transgenic mouse models of Alzheimer disease.
PLoS One 15, e0227618. https://doi.org/10.1371/journal.pone.0227618 (2020).
19. Inoue, T., Kawaji, T. & Tanihara, H. Elevated levels of multiple biomarkers of Alzheimer’s disease in the aqueous humor of eyes
with open-angle glaucoma. Invest. Ophthalmol. Vis. Sci. 54, 5353–5358. https://doi.org/10.1167/iovs.13-12245 (2013).
20. Duan, X. et al. Proteomic analysis of aqueous humor from patients with primary open angle glaucoma. Mol. Vis. 16, 2839–2846
(2010).
21. Grus, F. H. et al. Transthyretin and complex protein pattern in aqueous humor of patients with primary open-angle glaucoma.
Mol. Vis. 14, 1437–1445 (2008).
22. Saccà, S. C., Centofanti, M. & Izzotti, A. New proteins as vascular biomarkers in primary open angle glaucomatous aqueous humor.
Invest. Ophthalmol. Vis. Sci. 53, 4242–4253. https://doi.org/10.1167/iovs.11-8902 (2012).
23. Adav, S. S. et al. Proteomic analysis of aqueous humor from primary open angle glaucoma patients on drug treatment revealed
altered complement activation cascade. J. Proteome Res. 17, 2499–2510. https://doi.org/10.1021/acs.jproteome.8b00244 (2018).
24. Kaeslin, M. A. et al. Changes to the aqueous humor proteome during glaucoma. PLoS One 11, e0165314. https://doi.org/10.1371/
journal.pone.0165314 (2016).
25. Kliuchnikova, A. A. et al. Human aqueous humor proteome in cataract, glaucoma, and pseudoexfoliation syndrome. Proteomics
16, 1938–1946. https://doi.org/10.1002/pmic.201500423 (2016).
26. Sharma, S. et al. Proteomic alterations in aqueous humor from patients with primary open angle glaucoma. Invest. Ophthalmol.
Vis. Sci. 59, 2635–2643. https://doi.org/10.1167/iovs.17-23434 (2018).
27. Liu, H. et al. Proteome alterations in aqueous humour of primary open angle glaucoma patients. Int. J. Ophthalmol. 13, 176–179.
https://doi.org/10.18240/ijo.2020.01.24 (2020).
28. Ashburner, M. et al. Gene ontology: Tool for the unification of biology. The Gene Ontology Consortium. Nat. Genet. 25, 25–29.
https://doi.org/10.1038/75556 (2000).
29. Wei, X., Cho, K. S., Thee, E. F., Jager, M. J. & Chen, D. F. Neuroinflammation and microglia in glaucoma: Time for a paradigm
shift. J. Neurosci. Res. 97, 70–76. https://doi.org/10.1002/jnr.24256 (2019).
30. Williams, P. A., Marsh-Armstrong, N. & Howell, G. R. Neuroinflammation in glaucoma: A new opportunity. Exp. Eye Res. 157,
20–27. https://doi.org/10.1016/j.exer.2017.02.014 (2017).
31. Stasi, K. et al. Complement component 1Q (C1Q) upregulation in retina of murine, primate, and human glaucomatous eyes. Invest.
Ophthalmol. Vis. Sci. 47, 1024–1029. https://doi.org/10.1167/iovs.05-0830 (2006).
32. Tezel, G. et al. Oxidative stress and the regulation of complement activation in human glaucoma. Invest. Ophthalmol. Vis. Sci. 51,
5071–5082. https://doi.org/10.1167/iovs.10-5289 (2010).
33. Doudevski, I. et al. Clusterin and complement activation in exfoliation glaucoma. Invest. Ophthalmol. Vis. Sci. 55, 2491–2499.
https://doi.org/10.1167/iovs.13-12941 (2014).
34. Howell, G. R. et al. Molecular clustering identifies complement and endothelin induction as early events in a mouse model of
glaucoma. J. Clin. Invest. 121, 1429–1444. https://doi.org/10.1172/jci44646 (2011).
35. Howell, G. R. et al. Combinatorial targeting of early pathways profoundly inhibits neurodegeneration in a mouse model of glau-
coma. Neurobiol. Dis. 71, 44–52. https://doi.org/10.1016/j.nbd.2014.07.016 (2014).
36. Takano, Y. et al. Association of Toll-like receptor 4 gene polymorphisms in Japanese subjects with primary open-angle, normal-
tension, and exfoliation glaucoma. Am. J. Ophthalmol. 154, 825-832.e821. https://doi.org/10.1016/j.ajo.2012.03.050 (2012).
37. Luo, C. et al. Glaucomatous tissue stress and the regulation of immune response through glial Toll-like receptor signaling. Invest.
Ophthalmol. Vis. Sci. 51, 5697–5707. https://doi.org/10.1167/iovs.10-5407 (2010).
38. Bozkurt, B. et al. Association of tumour necrosis factor-alpha-308 G/A polymorphism with primary open-angle glaucoma. Clin.
Exp. Ophthalmol. 40, e156-162. https://doi.org/10.1111/j.1442-9071.2011.02595.x (2012).
39. Wang, C. Y. et al. Polymorphism in the TNF-α(-863) locus associated with reduced risk of primary open angle glaucoma. Mol.
Vis. 18, 779–785 (2012).
40. Yuan, L. & Neufeld, A. H. Tumor necrosis factor-alpha: A potentially neurodestructive cytokine produced by glia in the human
glaucomatous optic nerve head. Glia 32, 42–50 (2000).
41. Yang, X. et al. Neurodegenerative and inflammatory pathway components linked to TNF-α/TNFR1 signaling in the glaucomatous
human retina. Invest. Ophthalmol. Vis. Sci. 52, 8442–8454. https://doi.org/10.1167/iovs.11-8152 (2011).
42. Mac Nair, C. E., Fernandes, K. A., Schlamp, C. L., Libby, R. T. & Nickells, R. W. Tumor necrosis factor alpha has an early protective
effect on retinal ganglion cells after optic nerve crush. J. Neuroinflamm. 11, 194. https://d oi.o
rg/1 0.1 186/s 12974-0 14-0 194-3 (2014).
43. Tezel, G. TNF-alpha signaling in glaucomatous neurodegeneration. Prog. Brain Res. 173, 409–421. https://doi.org/10.1016/s0079-
6123(08)01128-x (2008).
44. Huang, P., Zhang, S. S. & Zhang, C. The two sides of cytokine signaling and glaucomatous optic neuropathy. J. Ocul. Biol. Dis.
Inform. 2, 78–83. https://doi.org/10.1007/s12177-009-9026-6 (2009).
45. Križaj, D. et al. From mechanosensitivity to inflammatory responses: New players in the pathology of glaucoma. Curr. Eye Res. 39,
105–119. https://doi.org/10.3109/02713683.2013.836541 (2014).
46. Hubens, W. H. G. et al. The aqueous humor proteome of primary open angle glaucoma: An extensive review. Exp. Eye Res. 197,
108077. https://doi.org/10.1016/j.exer.2020.108077 (2020).
Scientific Reports | (2022) 12:1221 | https://doi.org/10.1038/s41598-022-05273-0 11
Vol.:(0123456789)www.nature.com/scientificreports/
47. Axenovich, T. et al. Linkage and association analyses of glaucoma related traits in a large pedigree from a Dutch genetically isolated
population. J. Med. Genet. 48, 802. https://doi.org/10.1136/jmedgenet-2011-100436 (2011).
48. Ren, G. & Adamus, G. Cellular targets of anti-alpha-enolase autoantibodies of patients with autoimmune retinopathy. J. Autoim-
mun. 23, 161–167. https://doi.org/10.1016/j.jaut.2004.06.003 (2004).
49. Oglesby, E. N. et al. Scleral fibroblast response to experimental glaucoma in mice. Mol. Vis. 22, 82–99 (2016).
50. Stastna, M., Behrens, A., McDonnell, P. J. & Van Eyk, J. E. Analysis of protein composition of rabbit aqueous humor following two
different cataract surgery incision procedures using 2-DE and LC-MS/MS. Proteome Sci. 9, 8. https://doi.org/10.1186/1477-5956-
9-8 (2011).
51. Porter, D. et al. A neural survival factor is a candidate oncogene in breast cancer. Proc. Natl. Acad. Sci. USA 100, 10931–10936.
https://doi.org/10.1073/pnas.1932980100 (2003).
52. Lowrie, A. G., Wigmore, S. J., Wright, D. J., Waddell, I. D. & Ross, J. A. Dermcidin expression in hepatic cells improves survival
without N-glycosylation, but requires asparagine residues. Br. J. Cancer 94, 1663–1671. https://doi.org/10.1038/sj.bjc.6603148
(2006).
53. Shin, J. W., Sung, K. R., Lee, G. C., Durbin, M. K. & Cheng, D. Ganglion cell-inner plexiform layer change detected by optical
coherence tomography indicates progression in advanced glaucoma. Ophthalmology 124, 1466–1474. https://doi.org/10.1016/j.
ophtha.2017.04.023 (2017).
54. Ghahari, E. et al. Association of macular and circumpapillary microvasculature with visual field sensitivity in advanced glaucoma.
Am. J. Ophthalmol. 204, 51–61. https://doi.org/10.1016/j.ajo.2019.03.004 (2019).
55. Belghith, A. et al. Structural change can be detected in advanced-glaucoma eyes. Invest. Ophthalmol. Vis. Sci. 57, 511–518. https://
doi.org/10.1167/iovs.15-18929 (2016).
56. Sung, M. S., Kang, B. W., Kim, H. G., Heo, H. & Park, S. W. Clinical validity of macular ganglion cell complex by spectral domain-
optical coherence tomography in advanced glaucoma. J. Glaucoma 23, 341–346. https://doi.org/10.1097/IJG.0b013e318279c932
(2014).
57. Aretz, S. et al. In-depth mass spectrometric mapping of the human vitreous proteome. Proteome Sci. 11, 22. https://doi.org/10.
1186/1477-5956-11-22 (2013).
58. Kim, T. W. et al. Proteomic analysis of the aqueous humor in age-related macular degeneration (AMD) patients. J. Proteome Res.
11, 4034–4043. https://doi.org/10.1021/pr300080s (2012).
59. Nobl, M. et al. Proteomics of vitreous in neovascular age-related macular degeneration. Exp. Eye Res. 146, 107–117. https://doi.
org/10.1016/j.exer.2016.01.001 (2016).
60. Lee, J. H. et al. Proteomic analysis of human synovial fluid reveals potential diagnostic biomarkers for ankylosing spondylitis. Clin.
Proteom. 17, 20. https://doi.org/10.1186/s12014-020-09281-y (2020).
61. Cox, J. & Mann, M. MaxQuant enables high peptide identification rates, individualized ppb-range mass accuracies and proteome-
wide protein quantification. Nat. Biotechnol. 26, 1367–1372. https://doi.org/10.1038/nbt.1511 (2008).
62. Bruderer, R., Bernhardt, O. M., Gandhi, T. & Reiter, L. High-precision iRT prediction in the targeted analysis of data-independent
acquisition and its impact on identification and quantitation. Proteomics 16, 2246–2256. https://doi.org/10.1002/pmic.201500488
(2016).
63. Raudvere, U. et al. g:Profiler: A web server for functional enrichment analysis and conversions of gene lists (2019 update). Nucleic
Acids Res. 47, W191-w198. https://doi.org/10.1093/nar/gkz369 (2019).
64. Supek, F., Bošnjak, M., Škunca, N. & Šmuc, T. REVIGO summarizes and visualizes long lists of gene ontology terms. PLoS One 6,
e21800. https://doi.org/10.1371/journal.pone.0021800 (2011).
Acknowledgements
This research was supported by the Basic Science Research Program through the National Research Foundation of
Korea (NRF) funded by the Ministry of Education (NRF-2017M3A7B4041798 and NRF-2020R1I1A1A01073919).
This study was also supported by the Soonchunhyang University Research Fund.
Author contributions
S.H.L. and J.H.J. contributed to enrollment of patients, conducting the experiments, data acquisition, data analy-
sis, and writing of the manuscript. T.K.P. and H.K.L. contributed to the design of the study and sample collection.
C.M., K.H., and J.L. contributed to conducting the experiments. Y.W.J. and C.Y.K. contributed to the design of
the study, conducting experiments, data acquisition, data analysis, and writing of the manuscript. All authors
reviewed the manuscript.
Competing interests
The authors declare no competing interests.
Additional information
Supplementary Information The online version contains supplementary material available at https://doi.org/
10.1038/s41598-022-05273-0.
Correspondence and requests for materials should be addressed to Y.W.J. or C.Y.K.
Reprints and permissions information is available at www.nature.com/reprints.
Publisher’s note Springer Nature remains neutral with regard to jurisdictional claims in published maps and
institutional affiliations.
Scientific Reports | (2022) 12:1221 | https://doi.org/10.1038/s41598-022-05273-0 12
Vol:.(1234567890)www.nature.com/scientificreports/
Open Access This article is licensed under a Creative Commons Attribution 4.0 International
License, which permits use, sharing, adaptation, distribution and reproduction in any medium or
format, as long as you give appropriate credit to the original author(s) and the source, provide a link to the
Creative Commons licence, and indicate if changes were made. The images or other third party material in this
article are included in the article’s Creative Commons licence, unless indicated otherwise in a credit line to the
material. If material is not included in the article’s Creative Commons licence and your intended use is not
permitted by statutory regulation or exceeds the permitted use, you will need to obtain permission directly from
the copyright holder. To view a copy of this licence, visit http://creativecommons.org/licenses/by/4.0/.
© The Author(s) 2022
Scientific Reports | (2022) 12:1221 | https://doi.org/10.1038/s41598-022-05273-0 13
Vol.:(0123456789)You can also read