(Q-ACSM) Quadrupole Aerosol Chemical Speciation Monitor Standard Operating Procedure - Version May 2021
←
→
Page content transcription
If your browser does not render page correctly, please read the page content below
Funded by the Horizon 2020 Framework Programme of
        the European Union

Quadrupole Aerosol Chemical
    Speciation Monitor
        (Q-ACSM)
Standard Operating Procedure
                          Version May 2021
COST Action CA16109 COLOSSAL                 Deliverable 1.1          May 2021

TABLE OF CONTENTS
1.     PREAMBLE ................................................................................................................................. 1
2.     DOCUMENTATION AND RESOURCES .......................................................................................... 2
3.     INSTALLATION OF THE ACSM ON SITE FOR LONG-TERM OBSERVATIONS.................................... 3
     3.1.     Sampling system ................................................................................................................ 3
     3.2.     “ACSM-local” software ....................................................................................................... 5
     3.3.     Other recommendations .................................................................................................... 5
4.     SERVICING, CHECKS AND MAINTENANCE ................................................................................... 7
     4.1.     Synthesis of ACSM Diagnostics and Actions ........................................................................ 7
     4.2.     Description of main ACSM Diagnostics and Actions .......................................................... 11
5.     RESPONSE FACTOR AND RELATIVE IONIZATION EFFICIENCY CALIBRATION ............................... 18
     5.1.     Aerosol generation........................................................................................................... 18
     5.2.     Software configuration..................................................................................................... 19
     5.3.     RF and ammonium RIE ..................................................................................................... 20
     5.4.     Sulfate RIE ........................................................................................................................ 20
     5.5.     Ammonium Chloride ........................................................................................................ 20
     5.6.     Methanesulfonic acid (MSA) ............................................................................................ 20
6.     ACSM DATA REPROCESSING AND VALIDATION ........................................................................ 21
     6.1.     Data Validation Scheme ................................................................................................... 22
     6.2.     Data Ratification Scheme ................................................................................................. 23
Annex 1 Igor function to calculate time-dependent CE under various RH conditions (courtesy of David
Green, modified from Middlebrook et al., 2015) .............................................................................. 29
COST Action CA16109 COLOSSAL   Deliverable 1.1   May 2021

1. PREAMBLE
This document provides some recommendations for the use of quadrupole-type Aerosol Chemical
Speciation Monitors (Q-ACSM) developed by Aerodyne Research Inc. (ARI) for the measurement of
the chemical composition of non-refractory submicron particles (NR-PM1), and more recently of non-
refractory particles with aerodynamic diameter below 2,5µm (NR-PM2.5).

It is intended to provide key information and good practice relating to operating parameters,
maintenance frequencies, as well as data validation steps to be respected.

The reader is also strongly encouraged to refer to the manual supplied by the manufacturer and/or by
the distributor for information about the operation of the instrument.

These standard operating procedures were prepared based on documentation and information
provided by ARI and its French distributor (ADDAIR) as well as the state of the scientific art and good
practice shared in the context of the European Aerosol, Clouds and Trace gases Research
InfraStructure (ACTRIS, www.actris.eu), the European COST Action CA16109 for Chemical On-Line
cOmpoSition and Source Apportionment of fine aerosoL (COLOSSAL, www.costcolossal.eu), and
feedback from ACSM operators within French regional monitoring networks.

Information provided herewith reflects consensual agreements reached within these research
communities by the time the first version of the present document has been edited in May 2021. A
revised version might bring additional and complementary information on a later stage.

How to cite:
COST Action CA16109 COLOSSAL Chemical On-Line cOmposition and Source Apportionment of fine
aerosoL, Working Group 1. Quadrupole Aerosol Chemical Speciation Monitor (Q-ACSM) - Standard
Operating Procedure. Deliverable 1.1. Released in May 2021. https://www.costcolossal.eu/

                                                  1
COST Action CA16109 COLOSSAL Deliverable 1.1 May 2021
2. DOCUMENTATION AND RESOURCES
Website of the manufacturer Aerodyne:
https://support.aerodyne.com/
User manuals in English for Igor and the data acquisition software DAQ can be downloaded from this
website. It is also possible to download useful software for the proper functioning of the instrument
(Igor function, pump software, dryer software).
Software:
DAQ: ACSM driver software
Igor (Wavemetrics): scientific software for data processing and user interface with the
instruments
Igor Function “ACSM_Local”: raw data processing module
VS_PumpStats_Pfeiffer: pump driver software.
Website of the University of Colorado and of the Paul Scherrer Institute:
http://cires.colorado.edu/jimenez-group/wiki/index.php?title=ToF-AMS_Main
https://www.psi.ch/acsm-stations/
These sites give very useful information for operating “Aerosol Mass Spectrometer” (AMS) type
instruments, including the ACSM, particularly concerning collection efficiency, installation of the
sampling line, and data treatment methodologies.
2
COST Action CA16109 COLOSSAL     Deliverable 1.1   May 2021

3. INSTALLATION OF THE ACSM ON SITE FOR LONG-TERM OBSERVATIONS
3.1. Sampling system
3.1.1. Cut-off diameter of the sampling line
It is recommended to use a cyclone upstream from the ACSM’s sampling line. This cut-off diameter
limits obstruction of the critical orifice at the inlet of the ACSM by preventing large particles from
passing through. The cyclone cut-off diameter should be higher than the size fraction under
investigation to avoid the particle cut-off to be applied twice: once at the sampling line's inlet and
again at the inlet of the ACSM.
The PM2.5 cyclone recommended by the manufacturer (URG-2000-30ED) is compatible with a PM1
ACSM sample flow rate of 3 l/min. When using this cyclone upstream from a PM2.5 ACSM, the sample
flow rate should be reduced to 2 l/min. Otherwise, ensure that the cut point of the cyclone is greater
than the cut point of the ACSM lens and the flow rates are in agreement with section 3.1.3.

3.1.2. Sampling line materials
It is recommended to use a sampling line made of a conductive material (stainless steel, copper) in
order to reduce particle losses. The use of a stainless-steel line is ideal for long-term observations. The
long-term use (i.e. several years) of an annealed copper line must be checked regularly due to
potential oxidation.
Flexible black tubes with an interior conductive carbon coating must not be used as they can
contaminate the measurement, especially m/z 73 fragment, which is also a marker of biomass burning
aerosols.

3.1.3. Flow rate in the sampling line
The ACSM has an internal sample flow rate of around 0.08 l/min, which is fixed by a critical orifice at
the inlet of the vacuum chamber.
This flow rate is too low to ensure accurate sampling of ambient air through a sampling system that is
several meters long. Consequently, the primary flow rate must be higher to reduce the residence time
and, consequently, particle loss through diffusion. An external sampling pump must be used to
regulate the flow in the sampling system, at a flow rate consistent with the cyclone as described in
section 3.1.1.
The flow rate and sample tube diameter must be adjusted so that the flow remains laminar in the line
(Reynold’s number Re

COST Action CA16109 COLOSSAL      Deliverable 1.1   May 2021

The sample flow should be continuously recorded to monitor stability.
The length of sample lines should be minimised. To avoid condensation in the sample line ahead of
the dryer, especially when hot / humid air enters an air-conditioned room, the distance between the
dryer and the outside should be minimised and / or well insulated.
Finally, it is important to ensure that there is no leak in the sampling system. This can be checked by
placing a HEPA filter at the inlet of sampling line and/or by verifying the correspondence of the flow
measured both sides of the sampling line.

3.1.4. Drying the collected air
The ACSM sampling line system should routinely be maintained at a relative humidity between 20%
and 60%. Principally because collection efficiency (CE) is impacted by the water content of the aerosol
that is difficult to predict.
Nafion® membrane dryers are recommended over dryers with silica beads as they require less
maintenance. The dryer must have a metallic casing to reduce the loss of charged particles.
Recommendations for drying particles are found here: http://www.wmo-gaw-wcc-aerosol-
physics.org/files/actris-recommendation-for-aerosol-drying.pdf.
The manufacturer offers a Nafion® dryer which enables all of its parameters (i.e. relative humidity,
temperature, dryer’s inlet pressure, dryer inlet/outlet differential pressure, and dryer sheath
pressure) to be recorded. It functions with a pump which also controls the sample flow (section 3.1.3)
as well as the reverse flow in the dryer. It is recommended to compare the humidity sensors on this
dryer with a reference sensor annually.

3.1.5. Estimating losses from the sampling line system
As with other instruments that measure the characteristics of aerosols, the losses in the sampling
system should be evaluated, taking into account parameters such as the length and diameter of the
line, the sample flow, the presence of kinks, the presence of a dryer, etc.). These losses can be
modelled with IGOR using the PLC tool (free download available at: http://www.mpch-
mainz.mpg.de/~drewnick/PLC/).
Nevertheless, losses in the lines are minimised by following the recommendations described above,
specifically avoiding kinks in the sampling line, ensuring a laminar flow in the line and using metallic
tubing.

3.1.6. Sampling frequency
Usually, the Quadrupole ACSM are run in ambient air with a time resolution of about 30min
(corresponding to 28 sets of 1 open followed by 1 closed measurement scan, at 200ms/amu).
This time resolution may be set to approximately 1h at remote sites displaying very low
concentrations. Note that short sampling times can also be re-gridded during post-analysis to generate
longer averages if signal-to-noise appears to be too low.

                                                     4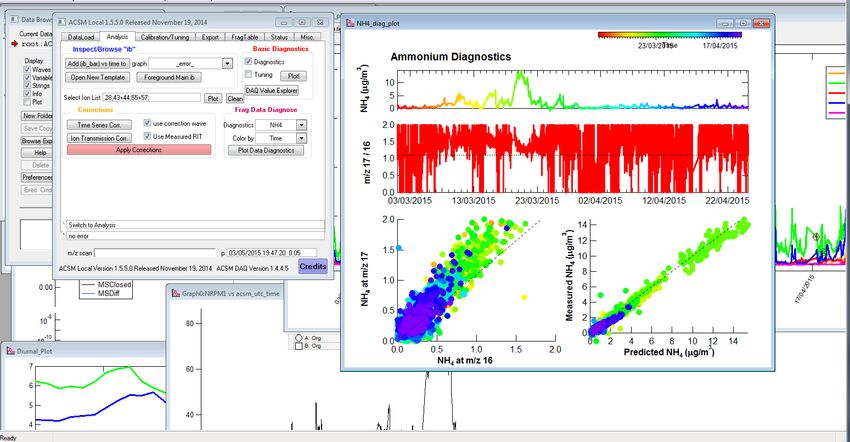
COST Action CA16109 COLOSSAL Deliverable 1.1 May 2021
Conversely, a 15min time resolution (or higher) may be better suited when substantial emissions from
local sources are expected (e.g., traffic sites).
3.2. “ACSM-local” software
The correct configuration of “ACSM_local” software is necessary to ensure the valid operation of the
instrument. This needs to be undertaken periodically and following any system change (e.g. after
rebooting), as follows:
Set RF and RIEs values coherently with results obtained from the last accurate
calibration(s) (section 5)
Set a default Collection Efficiency (CE) value, such as CE=0.5 in case of standard vaporizer
and CE=1 in case of capture vaporizer.
Figure 1: “ACSM_local” software, setting-up RIE, RF and CE values
It is also important to note that these parameters can be updated a posteriori, when reloading and
reprocessing raw data files (*.itx) within the "ACSM_local" software (section 6). Therefore, if an
erroneous calibration data entry is identified, it is possible to reprocess the data as long as the
validation of the technical parameters presented in section 4 is achieved.
3.3. Other recommendations
The ACSM requires 300W of power and operates on 85-264 VAC, 47/63 Hz. An inverter (for example,
an uninterruptible power supply (UPS), 2000kV) is recommended in order to protect the instrument
from unexpected electrical interruptions. If power is lost to the instrument, venting can be avoided
using an automatic shutdown device; this monitors the AC power through an AC/DC converter
connected to the same circuit as the UPS (but not the UPS itself) and trigger a timer to shutdown the
system if power is not restored in a certain (user configurable) amount of time.
It is imperative that the ACSM is installed in an air-conditioned environment to prevent the turbo
pumps or the Prisma detector from failing due to overheating. The maximum operating temperature
5
COST Action CA16109 COLOSSAL   Deliverable 1.1   May 2021

indicated by the manufacturer is 33°C and the station temperature should be stable and maintained
below 25°C. Avoid direct flow of AC system onto the instrument or sampling line (see section 3.1.3 on
insulating the sample line which is especially relevant if the AC flow cannot be redirected). The turbo
pump and Prisma detector ventilators should be cleaned once a year to avoid cooling problems.
Finally, the ACSM should be connected to the Internet to allow remote access control of the
instrument (e.g. via TeamViewer) and to collect data.

                                                  6
COST Action CA16109 COLOSSAL Deliverable 1.1 May 2021
4. SERVICING, CHECKS AND MAINTENANCE
4.1. Synthesis of ACSM Diagnostics and Actions
The following table (Table 1) summarises the parameters that influence whether the ACSM functions
properly and how frequently these parameters should be checked by the operator. Respecting these
checks and maintenance operations enables optimisation of the operating rate and maximizes the
quality of available data.
7COST Action CA16109 COLOSSAL Deliverable 1.1 May 2021
Table 1: Summary table of checks and maintenance
Check and/or Requirement
Frequency Action in case of non-conformance with the requirement
maintenance points PM1 PM2.5
The scanning bar, visible in the DAQ
Verification that the
software or in Igor, must be moving.
acquisition software or the Daily Reboot the Prisma, then PC and the software
The graphics in Igor and the voltages
PC is not “frozen”
on the DAQ must be updated.
Clean the critical orifice, see section 4.2.1.
Verify that the pumps (turbo and primary) are working properly within
Stable 1.3 ± 15% Stable 3.3 ± 15%
Aerodynamic lens pressure established parameters (these differ for different pumps). Note: these
Daily torr valve open torr valve open
(inlet pressure) in DAQ values will also differ at high altitude locations and different critical orifices
may be required in these locations.
0.04 ± 0.04 valve closed
Vaporizer voltage Daily Initial set point See section 4.2.2
Airbeam Daily Must be stable at 10-7 (± 15%) amps Check SEM voltage on, if so tune, see section 4.2.3
SEM voltage Daily Activated (ON) Turn on and tune, see section 4.2.4
Filament emission Daily 1mA ± 5% Turn on the filament or change if broken
Long term zero concentrations must lead to an investigation (valve,
Concentrations (NO3, NH4, filament, voltage, acquisition tuning…)
SO4, Org) Daily Must be primarily positive (>± LOD) Systematically negative concentrations can be caused by an inversion of the
particle filter valve see section 4.2.5
Investigation, turbo pumps issues can be caused by a leak in the vacuum
Correct power and temperature
Turbo and MD1 pumps Daily chamber, fan etc. MD1 pump issues may be due to the diaphragm which can
(dependent on pump #)
be replaced.
Verification of the flow rate, integrity of the Nafion® membrane and pump,
Dryer Daily RH 20 - 60%
see section 4.2.6
3-6 months / Backing pressure should be ±10% of
MD1 backing pressure Change diaphragm or pump
every visit last check
Stable and equal Stable and equal
Flow rate of the sampling Each visit (or
to 3 l/min (±0.3 to 2 l/min (±0.3 Verification of the pump and sample line integrity, see section 4.2.7
system remotely)
l/min) l/min)
8COST Action CA16109 COLOSSAL Deliverable 1.1 May 2021
Check and/or Requirement
Frequency Action in case of non-conformance with the requirement
maintenance points PM1 PM2.5
Check 2 l/min
Check 3 l/min (±0.3 l/min) using
(±0.3 l/min) using independent flow Investigate leaks, pump performance
6 months
independent flow
meter
meter
6 months or
Install HEPA filter on instrument inlet.
whenever Concentrations must be close to the instrument’s detection limits.
Instrument Blank / Leak Concentrations must be close to the
changes are Investigation (leak, nafion, vacuum problem, clogged filter …), see section
Check instrument’s detection limits (< ± 0.5
made to the 4.2.8
µg/m3)
sample line
6 months / post
Reset baseline to avoid negative error
Reset PrismaPlus baseline SEM See section 4.2.9
matrix
replacement
Cleaning of the critical
6 months Clean critical orifice
orifice
6 months or
Check prisma resolution and mass-to- Check m/z 28 and m/z 128, see section 4.2.10
m/z calibration whenever RF
charge (m/z) calibration Note: m/z calibration before RF calibration
calibration
6 months /
If checking – within 1V of previous
coincident with Note: post filament change check daily for 1 week and retune once stable,
Heater bias voltage value.
calibration / see section 4.2.11
Post filament change - tune
filament change
6 months or
more often in Cleaning similar to other automatic PM
Cleaning the cyclone dirtier / more measuring systems with DI water and
corrosive detergent if required.
locations
Cleaning the sampling line Cleaning similar to other automatic PM
1 year
(from head to the lens) measuring systems
9COST Action CA16109 COLOSSAL Deliverable 1.1 May 2021
Check and/or Requirement
Frequency Action in case of non-conformance with the requirement
maintenance points PM1 PM2.5
These include fans (electronics box,
Cleaning of pumps’ and
1 year pump1, under prisma, internal to Note: may be required more often depending on environment
detector’s fans
prisma)
Preventive replacement, pressure
Replacement of the
1 year difference should be less and 0.01 Torr
particle filter
between open and closed
Replacement of the three- Note: it is recommended that a spare servo is kept and replaced when
2 years Preventive replacement
way valve needed.
Change turbo pump https://support.aerodyne.com/knowle
4 years
lubricant reservoir dgebase/articles/KA-01144/en-us
10COST Action CA16109 COLOSSAL Deliverable 1.1 May 2021
4.2. Description of main ACSM Diagnostics and Actions
4.2.1. Aerodynamic lens pressure (inlet pressure)
The inlet pressure corresponds to the air flow entering into the ACSM and differs for PM 1 and PM2.5
instruments. When the inlet valve is open, this parameter must be between 1.3 ±15% Torr for PM1
and 3.3 ± 15% Torr for PM2.5 in DAQ so as to obtain a sample flow rate in the instrument equal to 0.08
± 0.015 L/min. When the valve is closed, this parameter drops to a value of approximately 0.04 ± 0.04
Torr. The inlet pressure also varies with atmospheric pressure and can be compared to the variation
in atmospheric pressure (available in the dryer output parameters) when troubleshooting.
A gradual or sudden decrease in pressure when the valve is open corresponds to a decrease in the
ACSM inlet flow, most often caused by a partial or complete blockage of the critical orifice and is
typically returned to normal operation by cleaning (see user manual). An increase in pressure, in
particular when the valve is closed, can often be caused by a leak. It is also possible that there is a
blockage in the sample line.
4.2.2. Vaporizer
The recommended value of this parameter is 600 (±30°C) for a tungsten vaporiser and 550 (±30°C) for
a capture vaporiser. It can be controlled by varying the vaporiser set voltage (Set V) in the DAQ “ionizer
settings" menu. If temperature is >650 °C adjust voltage to bring down to 600°C.
A temperature that varies too significantly from its recommended value will induce a modification of
the fragmentation processes of the analysed species and thus a bias in the calculation of the
concentration of these species (i.e. invalidating of the fragmentation table used for this calculation).
Turning off the vaporiser set voltage will bring about a sudden drop in its temperature, leading to a
decrease in the vaporisation of chemical species, starting with the least volatile (Org and SO 4). These
species’ signal will consequently become almost zero. An ammonium nitrate signal can still persist
because it is very volatile.
A significant variation in vaporiser temperature typically indicates that the connection between the
temperature sensor (thermocouple) and the vaporiser has weakened or broken. In rare cases it can
also be due to an issue in the electronics box.
It is important to note that, according to the manufacturer, the voltage-to-temperature relationship
does not vary over time. Therefore, unless the vaporiser has been replaced, the temperature set
voltage should be set at the value initially configured and found in ‘Performance and Calibration’ file
shipped with your instrument typically titled ‘XXX_XXX_performance_and_calibration.odp’ and found
on the desktop or in a subdirectory of C:\ACSM.
4.2.3. Airbeam (N2+ signal)
The Airbeam is the measured signal in amps of m/z=28 in the mass spectrum while the switching valve
is in filter position. This is predominantly from N2+ from atmospheric N2. This value is taken as a
reference to correct for variations in the ACSM’s flow rate as well as changes in instrument sensitivity,
typically due to a decrease in the detector effectiveness.
11COST Action CA16109 COLOSSAL Deliverable 1.1 May 2021
The Airbeam reference value is 10-7 amps. This value is controlled by adjusting the SEM voltage of the
Prisma detector following the tuning procedure described in the user's manual. This tuning must be
done before a calibration. It must be also be done when the value has decreased by more than 15 %
from the reference value. It can also be low if the SEM voltage has been switched off.
During data processing, the concentrations measured by the ACSM are corrected, linearly, from the
Airbeam variations around its reference value. If the Airbeam deviates more than 30% from its
reference value, correction may no longer be valid and the data should be investigated to ensure
consistent response. If the deviation is due to drift (SEM), rather than flow, then it may be possible to
correct the data with some confidence.
A low value from the Airbeam can be due to a closed inlet valve, a blocked critical orifice, or the SEM
detector or filament’s power being off. In “acquisition” mode, do not forget to activate the Airbeam’s
correction function in the tab “time series correction”.
4.2.4. SEM Voltage
This parameter corresponds to the voltage applied to the electron multiplier (SEM). There is no set
reference value for this parameter. At a constant voltage, the SEM efficiency decreases with the
duration that the instrument is in operation, in particular when it is new, thus inducing a decrease in
the Airbeam’s signal over time.
A drop in the Airbeam can also be linked to a drop in the air flow entering into the ACSM (blockage of
the critical orifice) or the filaments being switched off. Before calibrating the SEM’s voltage, first verify
the inlet pressure (which corresponds to the flow entering into the ACSM) and that the filament is
functioning properly.
The SEM voltage must be increased with caution to avoid the rapid deterioration of the SEM (i.e. by
increments of maximum 100 Volts). The SEM linearity is ensured up to 3000V according to the
manufacturer.
SEM voltage should be tuned before calibration and checked periodically as described in section
4.2.3.Filament emission
The reference value for the filament emission is 1 mA. It should be verified that the real average value
varies in a range of the order of ±5%.
This parameter does not degrade; rather it falls to zero when the filament is broken or when the
reference voltage has been stopped. If the filament stops, so will ionisation, which corresponds to a
significant decrease in the Airbeam and the concentrations detected by the ACSM.
4.2.5. Switching Valve
The switching valve is a servo-actuated 3-way valve that changes the sample entering the ACSM
vacuum system between particle-laden air and air that has passed through a particle filter. The
instrument is typically configured so the valve switches every 30 seconds. The servo lifetime is variable
from system to system, but typically needs to be replaced every two years.
12COST Action CA16109 COLOSSAL Deliverable 1.1 May 2021
The two most common symptoms of a switching valve issue are: 1. Measured mass loadings are noise
about zero which indicates that the valve is stuck in one position, typically because of a failed servo
motor 2. Measured pressure between sample and filter position are dramatically different indicating
that one of the two positions is not correct. In early versions of the ACSM with electronics board
revisions below 7.1, running with a damaged servo for prolonged periods could lead to damage to the
electronics. Newer instruments include a fuse in the valve control circuitry which may need to be
replaced if a servo motor fails.
4.2.6. Dryer
Drying the particles before measurement is important because the concentration measured by the
ACSM is dependent on humidity. Calculation of the corrected collection coefficient according to the
method proposed by Middlebrook (CE_dry) considers particles that were first dried. The "Middlebrook
method" indicates that the maximum relative humidity is difficult to predict and thus recommends
effectively drying the aerosols upstream from the ACSM. Full details are in section 6.2.4.
A relative humidity at the dryer exit of 20-60% is recommended, this should be logged at 5 min.
intervals.
4.2.7. Pump operation
The software that monitors the pumps displays the rotation speeds, power and operating
temperatures. The rotation frequencies are equal to 650, 1500 and 1000Hz respectively for the three
turbo-pumps. The software also allows one to record these parameters in a log. The default log is the
following: « c:\ACSM\PumpData.txt ». These parameters should be recorded at 5 to 10 min intervals.
These data can be used in the event of an investigation.
4.2.8. Instrument Blank / Leak Check
Place a HEPA filter on the sample inlet and measure in “acquisition” mode for minimum 3 hours.
Concentrations must be close to the instrument’s species dependent detection limits (see section
¡Error! No se encuentra el origen de la referencia.). It may be useful to have a CPC in line for added
sensitivity.
If a leak is suspected in the sampling line: measure through the ACSM filter placed before the
aerodynamic lens to help identify the locations.
Important locations to check are the switching valve (ensure it rotates to a fully closed position),
switching valve (which can/should be cleaned using compressed air, filter integrity, damage to o-rings,
…).
A He leak check may help identify the location:
https://support.aerodyne.com/knowledgebase/articles/KA-01157/en-us
13COST Action CA16109 COLOSSAL Deliverable 1.1 May 2021
4.2.9. Reset the baseline settings of the PrismaPlus electronics
It is recommended to run the Amplifier Offsets routinely (every 6 months) or after SEM replacement.
To do so, first set the scan parameter “Pause” to “0” for all channels in the “Scan Parameters” panel
by right clicking in the “Pause” column to bring up the “Scan Parameter Change Form,” typing “0” in
the “Enter New Value” text box, then clicking “Set All” as shown in Figure 2.
Figure 2: Set the Pause value to “0” in all channels
Then, reset the baseline by clicking “Measure Offsets” and set the “AMU for zero” value to “140 or
145” in the top right of the “Utilities” panel and clicking “Save values and exit” and clicking “Update”
when the routine completes as shown in Figure 3.
Figure 3: Updating the “Amplifier Offsets” by clicking “Measure Offsets” in “Utilities” panel
14COST Action CA16109 COLOSSAL Deliverable 1.1 May 2021
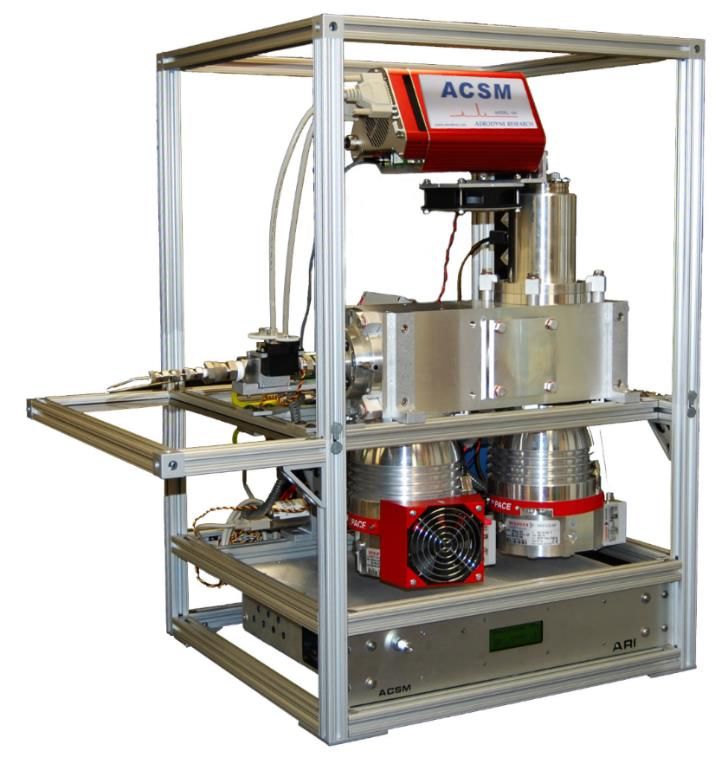
4.2.10. Prisma resolution and mass-to-charge (m/z) calibration.
The mass-to-charge (m/z) calibration of the quadrupole is based on water, air and naphthalene peaks.
The naphthalene fragment ions, with a parent peak at m/z 128 (Figure 5), come from an internal
standard that is used to correct for ion transmission loss at high m/z in the quadrupole, as well as to
calibrate the m/z scale. Naphthalene molecules are emitted continuously into the vacuum chamber
close to ionisation region because this chemical compound has a correct vapor pressure to be used as
an effusive source (~ 0,01 torr at 25°C). It is important to note that naphthalene signal is detected
whatever the position of the 3-way switching filter valve, that explains there is no naphthalene signal
in the MS diff.
RGA
100
EI spectra from NIST for Napthalene
80
RelativeIntensity
60
40
Naphthalene
Molecules 20
1011 s-1 emitted
0
continuously 20 40 60 80 100 120 140
1 µm pin hole
AMU
Figure 4: Naphthalene mass spectrum from NIST and localization of the naphthalene source into the vacuum chamber.
In practice, this is a two-point calibration procedure using peaks at m/z 28 (N2+) and naphthalene peak
at m/z 128 to “electronically” calibrate the analyzer over the 10-150 amu range. These fragments
provide in-situ measurements of ion transmission and thus can impact the RIT correction (see section
6.2.1).
The mass-to-charge calibration can be performed through the ‘Control Settings -> Scan Parameters’
window in the DAQ menu. Predefined ‘mz cal mode’ acquisition mode needs to be selected (with
sample = 0; filter = 1; Nb of sets = 10 in the mass spec. scan sequence for example) before starting
acquisitions with the Igor Automation Server enabled. Results can be viewed in the IGOR
‘acsm_local.ipf’ procedure through ‘Calibration/Tuning’ window by selecting ‘Resolution and m/z
Adjustement Plot’. Nominal mass at m/z 28 and 128 can be compared to centred values obtained by
clicking on “fits for m/z cal’ button.
15COST Action CA16109 COLOSSAL Deliverable 1.1 May 2021
N2+
O2 +
Naphtalene
Figure 5: m/z calibration results in the ‘acsm_local’ software.
If the amu difference is higher than +/-0.05 (the mass resolving power is 1 for Q-ACSM so it is not
critical that the mz calibration is set perfectly), make m/z offset and slope adjustments on the
Calibration tab of the Configuration and Control window of ACSM DAQ (v1.6.0.0 and higher) or using
the OPC Browser (prior to 1.6.0.0) until the N2+ and naphthalene peaks are centred at their nominal
mass value. The slope parameter is set to 1.000 and the offset parameter is set to 0.000 by default.
Both are quite sensitive and need to be adjust with caution in steps of 0.001. The adjustment
procedure is described in the user manual. For more information, see also the specific technical note
‘TN_012’ from the manufacturer describing empirical calibration of the OPC Slope and OPC offset
relationships.
Even if m/z calibration is not supposed to change over time, it is important to check amu calibration
once per half-year and after each maintenance into the vacuum chamber. There is no reference value
for naphthalene signal, which varies from one instrument to the other but the signal needs to be
enough intense to be detected on each MS to reduce measurement uncertainties when ion
transmission is corrected. Please refer to section 4.2.3 for airbeam signal values.
4.2.11. Heater Bias Voltage
This voltage optimises the throughput of ions generated in the ion source to the mass spectrometer,
calibration is therefore very important.
There is no reference value for this parameter, which varies from one instrument to the other.
However, its optimum is typically within several volts of the Ion Reference voltage. It should be
adjusted to maximise the Airbeam signal for a given SEM voltage. In normal operation, these voltages
must remain close from one calibration to the next.
16COST Action CA16109 COLOSSAL Deliverable 1.1 May 2021
As with the SEM voltage, this calibration is semi-automatic via the instrument’s operating software
through the "tuning" function and is described in the user manual. The calibration of these two
parameters must also be done sequentially, calibration of the heater bias voltage always preceding
calibration of the SEM voltage.
Heater bias voltage should be checked periodically as described in Table 1 but only adjusted if a change
in the Airbeam signal varies by greater than 15% from value 7 days before.
17COST Action CA16109 COLOSSAL Deliverable 1.1 May 2021
5. RESPONSE FACTOR AND RELATIVE IONIZATION EFFICIENCY CALIBRATION
The Response Factor (RFRF) of NO3, and Relative Ionisation Efficiencies (RIE) of NH4 and SO4 are
determined from measurement of 300 nm diameter particles of NH 4NO3 and (NH4)2SO4 respectively.
The determination of RIEs for chloride and MSA may be necessary in some environments (see sections
5.5 and 5.6). Experimental setup is detailed on the following Figure.
Figure 6: Typical ACSM calibration setup
First, particles are generated from nebulizing of solutions of ammonium nitrate or
ammonium sulfate (see section 5.1).
Particles are dried before size-selection. After the dryer, the relative humidity should
ideally be kept between 20 and 40%.
300 nm particles are size-selected using a Differential Mobility Analyzer (DMA).
An aerosol diluter allows the user to dynamically change the aerosol concentration to
provide a concentration range during calibration. The use of a mixing tube downstream
of the aerosol diluter is necessary to ensure the aerosols and diluting air are fully mixed
before they reach the ACSM and CPC inlet.
The outlet of the generation setup can be connected on the ½ inch sampling tube located
downstream the dryer to mimic the sampling setup.
A CPC is used to measure the number concentration of 300 nm particles. It should be
connected to the ACSM sampling pump connector. The length of the tube should be
minimized to avoid particle loss.
5.1. Aerosol generation
It is important that the calibration solution not be too highly concentrated to avoid artefacts from
double-charged particles (located at 510nm when 300 nm particles are generated). For example, an
optimum concentration value of 5 mM has been obtained using a TSI nebulizer model 3076. If another
type of nebulizer were used, it could be necessary to check the concentration of 510nm particles
18COST Action CA16109 COLOSSAL Deliverable 1.1 May 2021
generated. Ratio of number concentration of 510nm on 300 nm particles should be minimized, and at
least, less than 2%
Devices such as Centrifugal particle Mass Analyser (CPMA) or Aerodynamic Aerosol Classifier (AAC)
can be used to remove double charge particles at 510nm. In that case, there is less need to control
the concentration of the solution precisely. When used, such a device must be installed between DMA
and aerosol diluter on the scheme.
5.2. Software configuration
The instrument should be tuned directly prior to the calibration.
The user should use the custom file for calibration from the Aerodyne ACSM webpage:
“ACSM_Calibration_NH4NO3.scn” and calibrate ACSM using the “ambient air mode” (i.e. full scan
mode).
For calibration with ammonium sulphate, use the respective custom scan file also available on the
Aerodyne webpage: ACSM_Calibration_NH42SO4.scn
Figure 7: Example of usual RF and RIE calibration results using the dedicated “ACSM-local” software panel
It is recommended that each calibration curves includes at least 6 data points, equally distributed over
the expected concentration range in the investigated ambient air and starting from zero (¡Error! No
se encuentra el origen de la referencia.). Near-future updates of this calibration panel are planned to
include some statistics on the linearity of the calibration curves, which might then be used to assess
the validity of obtained calibration results.
19COST Action CA16109 COLOSSAL Deliverable 1.1 May 2021
5.3. RF and ammonium RIE
RF is determined by measuring ions for NO3+ (m/z 30, 46) obtained from measurement of 300nm
ammonium nitrate particles. The signal of NO3+ (m/z 30, 46) in Amps, is linked with the mass
concentration injected into the ACSM. The particle number concentration (measured by the CPC) is
converted to mass concentration using the density of ammonium nitrate (in g/cc) and a shape factor
of 0.8.
Cmass = density x Shape factor x 4/3 x πr3
RIE of NH4+ is then calculated from mass balance between NH4+ and NO3- in ammonium nitrate.
5.4. Sulfate RIE
The RIE of SO42- should be measured immediately following an RF NO3 and RIE NH4 from nitrate
calibration.
RIE of SO42- is determined from (NH4)2SO4 particles generated by the set up and sampled with the
ACSM.
The RIE of SO42- can be calculated from mass balance with NH 4+, since the RIE of NH4+ is known from
the ammonium nitrate calibration. This method is not biased by particle bounce. Indeed, ratios of NH4
from nitrate and NH4 form sulphate are used to estimate the collection efficiency of sulfate during
calibration.
For the calibration with ammonium sulphate, start with small concentrations and increase slowly. Due
to partly slow evaporation of ammonium sulphate hysteresis effects can influence the calibration if
done otherwise.
5.5. Ammonium Chloride
It is advisable to calibrate for ammonium chloride if this is the dominant form of chloride in your
environment1.
5.6. Methanesulfonic acid (MSA)
It is advisable to calibrate for MSA if your sampling point is near the ocean. This species has been
observed in previous ACSM/AMS measurements but the RIE is not well known.
1
Tobler, A. K., Skiba, A., Wang, D. S., Croteau, P., Styszko, K., Nęcki, J., Baltensperger, U., Slowik, J. G., and Prévôt, A. S. H.:
Improved chloride quantification in quadrupole aerosol chemical speciation monitors (Q-ACSMs), Atmos. Meas. Tech., 13, 5293–
5301, https://doi.org/10.5194/amt-13-5293-2020, 2020.
20COST Action CA16109 COLOSSAL Deliverable 1.1 May 2021
6. ACSM DATA REPROCESSING AND VALIDATION
The quality assurance regime described here is designed to be applied to ACSM instruments operating
in long term deployments but could equally applied to instruments operating on campaigns. It
comprises a two-stage process consisting of regular ‘validation’ checks during the instrument
operation to ensure the instrument is working correctly. This is followed periodically (every 3/6
months or at the end of the campaign) by a final ratification step which reviews the QA/QC
information, cleans data for anomalies not identified in the first step and applies the quality assurance
data over a longer timescale. Both these steps utilise a set of diagnostics that are important for
assessing the correct operation of the instrument; these are shown in section 6.1.
Figure 8: Data Reprocessing and Validation Schematic
21COST Action CA16109 COLOSSAL Deliverable 1.1 May 2021
6.1. Data Validation Scheme
For each data point, check the following technical parameters and ensure they are consistent with the
values in Table 2 using the *.csv file exported to the acquisition PC or by opening the ACSM's raw files
with the Igor software.
Table 2: Summary table of data validation criteria
Criterion Action when criteria are not
Diagnostic Reference
PM1 PM2.5 met
Investigate data validity if
Aerodynamic lens
3.3 ± 0.2 outside criteria range or large
pressure (inlet 1.3 ± 0.2 torr 4.2.1
torr deviations / sudden changes
pressure)
and flag / reject if necessary
Vaporizer voltage Check set point maintained 4.2.2
Investigate data validity if less
Must be close to 10-7 ± 30%
Airbeam than 70% and flag / reject if 4.2.3
amp
necessary
No sudden variations other
Investigate data validity and
SEM Voltage than those induced by 4.2.4
flag / reject if necessary
tuning
Investigate data validity and
Heater Bias Voltage No sudden variations 4.2.11
flag / reject if necessary
Investigate data validity and
Filament Emission No sudden variations, >0mA 0
flag / reject if necessary
Investigate data validity and
Dryer RH 20% to 60% 4.2.6
flag / reject if necessary
Verification of the ionic
balance: If slope not close to 1, verify
The fit between the that the RIEs are correct and
5.3
measured NH4 and the consider recalibration.
Validity of RIEs
predicted NH4 should be If the relationship is not linear,
5.4
linear and its slope should and below 1, this may indicate
be close to 1 (±0.1) and the presence of acidic aerosol.
linear
Investigate (valve closed, filter
valve switching, filament off,
Positive and not close to
Total concentration detector voltage, acquisition
zero / negative for long 4.2.8
of ACSM settings, RF and RIE
periods
configuration, inlet clean,
leaks…)
A "diagnostic" tab allows all of these parameters to be visualised. The window represented in Figure
9 allows an overview of certain significant time series, including the flow rate into the ACSM
(pressure), the Airbeam (N2), as well as the RF set during measurements.
22COST Action CA16109 COLOSSAL Deliverable 1.1 May 2021
Figure 9: Visualisation of the ACSM's technical parameters with the ACSM_local data visualisation software.
6.2. Data Ratification Scheme
This second step consists of checking, for each data point, the correct configuration of the calibration
coefficients (RF, RIE), the collection efficiency (CE), reference values enabling correction of the
Airbeam's measurement variations, as well as the relative ion transmission efficiency (RIT) for
naphthalene (Figure 10).
Figure 10: Configuration of the reference parameters to take into account corrections of Airbeam pressure variations and
calibration coefficients
23COST Action CA16109 COLOSSAL Deliverable 1.1 May 2021
The windows represented in Figure 11 shows on the righthand side the ACSM's "reference" technical
parameters (N2 signal, O2 signal, Ar signal, naphtalene signal, RF, aerodynamic lens pressure,
temperature), i.e. as they were measured during calibration RF. All of these reference parameters
shown here can be modified by the operator, and the configured parameters on the righthand side of
this window must be those recorded during calibration of the RF applicable to the considered data
series.
The reference parameters that have most significant impacts on data are: the flow rate (when using
this to correct in time series window) into the instrument (reference P), the Airbeam (reference N2)
and the RF. Each of these three parameters impacts directly and linearly the concentrations measured
by the ACSM. More specifically, an RF value must always be associated with a Pref and N2 ref value.
Note 1: It is important to validate the RF value in this window as this value will be used in the
calculations, in priority over that of the "review batch", of which the start-up value can be different.
Note 2: If an RF change is visible on the graph on the bottom of Figure 3, corresponding to the fact
that a calibration was done, the default reference values will be those corresponding to the oldest
data. Therefore, the operator should modify the reference values if necessary.
Note 3: Following a calibration, new reference values are saved in the DAQ software and can be
consulted in the "calibration" tab. Each saved raw *.itx file are stored, and calibration results are saved
in an Igor file in c:\\ACSM\settings » under the name « ACSM_NO3CalPlot_yyyymmdd_hhmmss.pxp
Figure 11: Calibration tab of the ACSM driver software in which the reference values of the last calibration are shown.
6.2.1. Verification that the ACSM's transmission efficiency correction (RIT) is activated
This correction can be accessed in the window of the "ACSM_local" software shown in Figure 12 and
should be consistent with the relationship shown. It corresponds to the assessment of the ACSM's
transmission efficiency, which decreases for greater masses.
24COST Action CA16109 COLOSSAL Deliverable 1.1 May 2021
Figure 12: Mass spectrometer transmission efficiency correction function (RIT)
This option must be activated and the mathematical adjustment (exponential, power, etc.) must be
selected by the operator so that the correction function is the closest possible to the experimental
points.
After verification of the four preceding points, the operator should activate "time series correction"
and "RIT" by selecting the button "Apply Corrections".
Note: there are some cases where it is not working = not a good fit. Then clean the system closing the
valve, and then check if the fit is better. If not, do not apply (then the red line will be applied).
6.2.2. Fragmentation diagnostic plots
Org44 vs. Org43: Org44 has potential air interferences, while Org43 is an approximate (interference-
free) surrogate for total organics. The Org44/Org43 plot should have an intercept at the origin.
Potential issues around blocked filter causing pressure drop can lead to non-zero intercept.
Nitrate and sulfate diagnostics: Check for (1) linearity; (2) intercept at origin.
6.2.3. Ion balance
This step enables validation of the NH4 and SO4 RIE values. It is a question of verifying that the
ammonium concentration measured by the instrument is close to "predicted ammonium"
concentrations. This is determined with NO3, SO4 and Cl measurements, since in the atmosphere,
these species are most often associated with ammonium in the form of NH4NO3, (NH4)2SO4 and NH4Cl.
Thus:
NH4predicted = [NO3]/62 + 2 [SO4]/96 + [Cl]/35.45
NH4measured = [NH4]
25COST Action CA16109 COLOSSAL Deliverable 1.1 May 2021
This diagnostic can be carried out by applying the above calculations to the exported data in the *.csv
file. It is also available in the "ACSM_local" under the "Analysis" tab.
Figure 13: Ion balance diagnostics in IGOR.
An NH4measured/NH4predicted close to 1 means that the relative distribution of the four inorganic
species (NO3, NH4, Cl, SO4) measured by the ACSM is correct within the instrument's uncertainty limits.
Hence, the slope of a series of data must be equal to 1 ± 10%. It is preferable to evaluate this slope
with a relatively continuous time series (several weeks) and inorganic particle concentrations that are
not too low (> 5 μg m-3).
This relationship can be temporarily lowered during certain pollution episodes when there is a
presence of (NH4)HSO4 instead of (NH4)2SO4-type acid aerosols, or in the presence of SO4 or NO3 linked
to organic matter (organo-nitrate, organo-sulfate). In these two examples, the predicted ammonium
would be overestimated and the NH4measured/NH4predicted relation decreased.
Hence, one should monitor the evolution of this relationship over time in order to observe any drift.
A continuous and significant deviation over time can indicate that the calibration of the NH 4 and SO4
RIEs must be checked. A one-time deviation that returns to normal should be interpreted in terms of
atmospheric chemistry.
An operator error in RIE calibration can lead to an error in the slope.
Finally, it should be noted that feedback shows that RIE values fluctuate very little over time in
metropolitan urban-background stations.
26COST Action CA16109 COLOSSAL Deliverable 1.1 May 2021
6.2.4. Collection efficiency adjustment
Standard operation procedures to be applied for accurate ACSM operation are given elsewhere2.
Furthermore, an important parameter to be considered is the collection efficiency, which translates
how efficiently the sampled particles eventually reach and are impacted onto the vaporizer. For online
ACSM data acquisition and for instrument equipped with a standard vaporizer, a default collection
efficiency of 0.5 (CE=0.5) is commonly set on the instrument software (so-called “ACSM_local”). This
collection efficiency should be adjusted post hoc to take into account its variation over time, notably
depending on the chemical composition and mixing state of the sampled aerosols. Middlebrook et
al. (2015) proposed a procedure to accurately estimate CE under various conditions3. This procedure
is assumed as state-of-the-art. Its use is then highly recommended.
Note: For ACSM equipped with so-called capture vaporizer, a constant CE value of 1 should be used.
For standard vaporizers, time-dependent CE values mainly fluctuate with the ammonium nitrate mass
fraction (ANMF), aerosol’s acidity, and relative humidity. This can be calculated using Igor functions
given in Annex 1 of the present document, which is a modification from Middlebrook et al., 2015.
Annex 1 refers to the calculation of CE_dry values,
The logic behind the calculations is to use a constant default CE when the ANMF is not very high, and
to use a variable CE that depends on the ANMF, when it is higher. For low concentrations below DL,
the CE is set to the default value.
Depending on the version used for this CE correction procedure (which needs to be previously
imported into the computer’s Igor folders), time-dependent CE may be obtained via the command
window, as follows:
CalcCE_dry(NH4_DL,CE_lowNH4) or CalcCE_fPhase(NH4_DL,CE_lowNH4,RH_SL)
where NH4_DL is the detection limit for ammonium, CE_lowNH4 is the CE that should be used when
measured NH4 is below the detection limit (typically 0.5), and RH_SL is the measured relative humidity
if not kept below 60%.
The detection limit for ammonium (NH4_DL in the procedure) should be determined for each
measurement site and period. To do so, a filter should be placed in the ACSM inlet line and
measurements should be collected. Averaging the mass concentrations for each species using CE=0.5
and multiplying the resulting standard deviations by 3 would result in the determined detection limits.
2
Current SOP version available from COLOSSAL website
3
Middlebrook et al. (2012) Evaluation of Composition-Dependent Collection Efficiencies for the Aerodyne
Aerosol Mass Spectrometer using Field Data, Aerosol Science and Technology, 46:3, 258-271.
27COST Action CA16109 COLOSSAL Deliverable 1.1 May 2021
When this is not done, a default detection limit of 0.284 ug/m3 can be used for ammonium (Ng et al.,
2011).
The CE that should be used when measured NH4 is below the detection limit (CE_lowNH4 in the
procedure) is dataset specific. If a dataset corresponds to a polluted place and most likely it is never
ammonia-deficient, hence ammonium concentrations below DL indicate low concentrations in
general of all species and hence the default CE should be set to 0.5, since the calculation of the ANMF
would have too high uncertainty. If a dataset can have acidic aerosol, then ammonium concentrations
below DL may show acidic aerosol and hence default CE should be set to 1. The DL of sulfate may be
used instead to determine when the concentrations are low.
An example of the input can then be
CalcCE_dry(0.45,0.5) or CalcCE_dry(0.45,1), depending on the site
Once calculated, time-dependent CE corrected values can automatically be reported in the exported
*.csv data files using an Igor function, "Auto_ACSM_export.ipf", which is currently available on request
at acmcc@lsce.ipsl.fr and should hopefully be implemented in the ACSM software in the near-future.
Finally, it should be noted that the CE might also be significantly influenced by the type of sampled
aerosols. For instance, Alfarra et al. suggested CE value equal to 0.7 when high relative contributions
of organic matter from biomass combustion are present.4 Comparisons of individual chemical species
concentrations with external data can support the identification of the optimal CE value.
4
Alfarra et al. (2007) Identification of the Mass Spectral Signature of Organic Aerosols from Wood Burning
Emissions. Environ. Sci. Technol., 41, 5770-5777
28COST Action CA16109 COLOSSAL Deliverable 1.1 May 2021
Annex 1 Igor function to calculate time-dependent CE under various RH conditions
(courtesy of David Green, modified from Middlebrook et al., 2015)
Function CalcCE_fPhase(NH4_DL,CE_lowNH4)
Variable NH4_DL,CE_lowNH4
// NH4_DL = ammonium detection limit
// CE_lowNH4 = CE for points where ammonium is below its detection limit
// Prior to running this procedure, all species must be calculated using CE=1.
// The sampling line relative humidity (if measured) should be named "RH_SL"
wave SO4, NH4, NO3, Chl, org, RH_SL
// Create waves of each species to smooth for the calculations.
duplicate/o SO4 SO4_CE1
duplicate/o NH4 NH4_CE1
duplicate/o NO3 NO3_CE1
duplicate/o Chl Chl_CE1
duplicate/o org org_CE1
Smooth 1, SO4_CE1,NH4_CE1,NO3_CE1,Chl_CE1, org_CE1
Variable i
Duplicate/o SO4 PredNH4_CE1, NH4_MeasToPredict, ANMF
Duplicate/o SO4 CE_dry,CE_fPhase
CE_dry=nan
CE_fPhase=nan
// Equation 3
PredNH4_CE1=18*(SO4_CE1/96*2+NO3_CE1/62+Chl_CE1/35.45)
NH4_MeasToPredict=NH4_CE1/PredNH4_CE1
// Equation 5
ANMF=(80/62)*NO3_CE1/(NO3_CE1+SO4_CE1+NH4_CE1+Org_CE1+Chl_CE1)
// Calculate the dry collection efficiency, CE_dry
For (i=0;iCOST Action CA16109 COLOSSAL Deliverable 1.1 May 2021 ElseIf (NH4_MeasToPredict[i]
You can also read