Q1 2021 INVESTOR PRESENTATION
←
→
Page content transcription
If your browser does not render page correctly, please read the page content below
Q1 2021 INVESTOR PRESENTATION
SAFE HARBOR STATEMENT
This presentation does not constitute an offer or invitation for the sale or purchase of securities and
has been prepared solely for informational purposes. This presentation contains forward-looking
statements within the meaning of the federal securities laws, which statements involve substantial
risks and uncertainties. Forward-looking statements generally relate to future events or our future
financial or operating performance. In some cases, you can identify forward-looking statements
because they contain words such as “may,” “might,” “will,” “would,” “should,” “expect,” “plan,”
“anticipate,” “could,” “intend,” “target,” “project,” “contemplate,” “believe,” “estimate,” “predict,”
“likely,” “potential” or “continue” or the negative of these words or other similar terms or expressions
that concern our expectations, strategy, plans or intentions.

These forward-looking statements are necessarily based upon estimates and assumptions that, while
considered reasonable by the Company and its management, are inherently uncertain. Factors that
may cause actual results to differ materially from current expectations include, but are not limited to,
future economic or market conditions and the other risks and uncertainties described in “Risk Factors”
contained in the Company’s Annual Report on Form 10-K or Quarterly Reports on Form 10-Q or
otherwise described in the Company’s other filings with the Securities and Exchange Commission.
New risks and uncertainties emerge from time to time and it is not possible for the Company to predict
all risks and uncertainties that could have an impact on the forward-looking statements contained in
this presentation.

Nothing in this presentation should be regarded as a representation by any person that the forward-
looking statements set forth herein will be achieved or that any of the contemplated results of such
forward-looking statements will be achieved. You should not place undue reliance on forward-looking
statements, which speak only as of the date they are made. The Company undertakes no duty to
update these forward-looking statements.

This presentation contains certain non-GAAP financial measures determined by methods other than in
accordance with generally accepted accounting principles (“GAAP”). We use non-GAAP financial
measures, including “Adjusted EBITDA,” as useful measures of the Company’s core operating
performance and trends and period-to-period comparisons of the Company’s core business. These
non-GAAP financial measures have limitations as analytical tools and should not be viewed as a
substitute for financial results determined in accordance with GAAP, nor are they necessarily
comparable to non-GAAP performance measures that may be presented by other companies.
Reconciliations of these non-GAAP financial measures to the most directly comparable GAAP
financial measures are included in the appendix to this presentation.

WHY WE EXIST

                  Our purpose is to challenge the
                      impossible and lead in
               the never-ending pursuit of maximum
                           performance.

                “We will enable our customers to be their best –
                to safely go farther and faster than they’ve ever
                                    imagined”

                                                                    3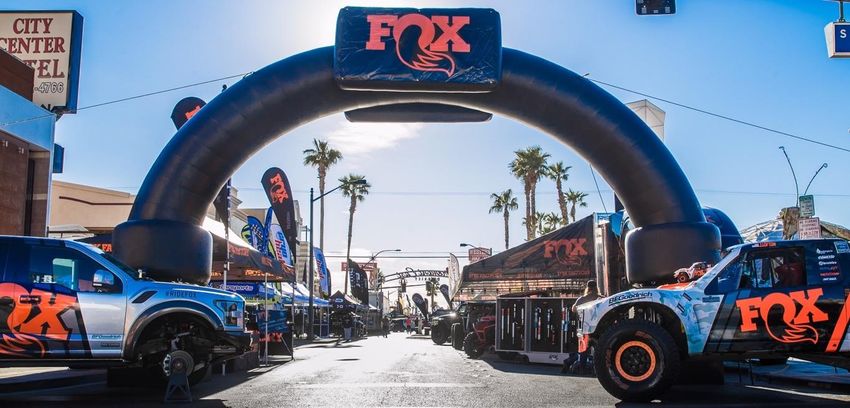
WHO WE ARE

A global, purpose-led organization
built on these CORE values:

LEADERSHIP             AGILITY

COLLABORATION          SERVICE

TRUST                  INGENUITY

                                     4
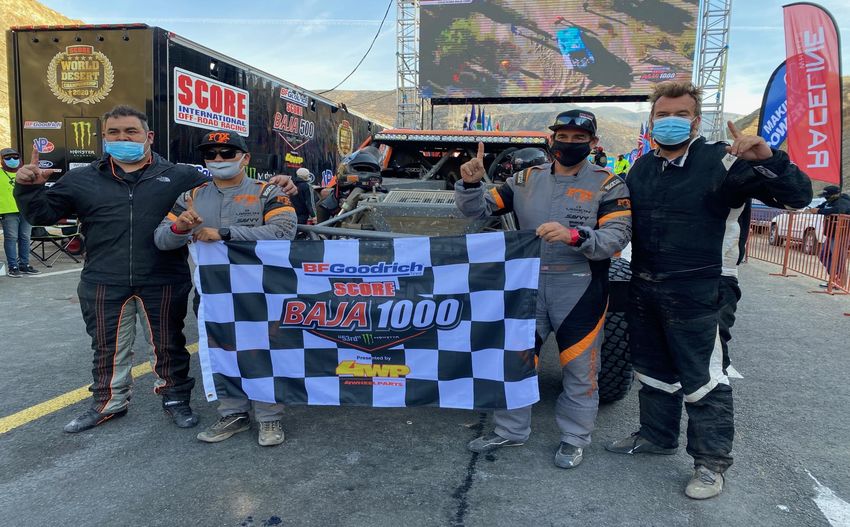
A COMPANY OF PASSIONATE ENTHUSIASTS

                                                                                MANUFACTURING ENGINEER

Mike Kim, FOX Motorsports Tuner, and Erik Rivera
 FOX Service Tech with TT Spec class win at the
                2020 Baja 1000
                 OFF-ROAD RACE TUNER               INCLUSION, DIVERSITY & ENGAGEMENT VP         BRAND MANAGER

                                                                                                                5
WHAT WE DO
DELIVER RACE PROVEN PRODUCTS THROUGH PERFORMANCE DEFINING TECHNOLOGIES

   JUSTIN LOFTON                          CASEY CURRIE                             MATT WALKER
   1ST Overall Unlimited TT 2020          2020 Dakar Rally Side-by-Side Champion   2020 UCI DHI World Cup Overall
   BlueWater Desert Challenge                                                      Winner (Elite Men)

                                          JESSE MELAMED                            MARINE CABIROU
   RYAN PIPLIC
                                          2020 EWS Champion – Zermatt, SWI         2020 UCI DHI World Cup Overall Winner
   Overall Win at 2020 Pro Turbo Desert
                                                                                   (Elite Women)
   Race

                                                                                                                           4
FOX’S CORE AND GROWING CONSUMERS BASE

                                        Core Consumer Base

 Continue to capture a
 greater share of the
 Performance
 Enthusiast and
 General Consumer
 Markets

                                                             7
ASPIRATIONAL BRAND
     PROFESSIONAL                 WEEKEND WARRIORS AND                   DIEHARD BRAND
       ATHLETES                       ENTHUSIASTS                         EVANGELISTS
  Demand the best product for a   Look for the same performance as the
                                    professional athletes they admire    A brand that fans truly love
       competitive edge

                                                                                                        8
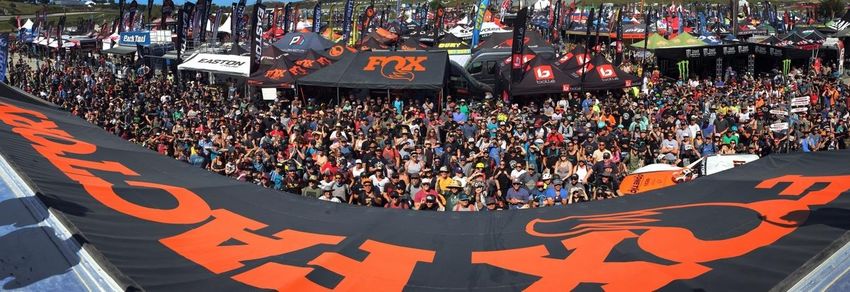
CONSUMER CONNECTION IN DIVERSE MARKETS

                                 Total Social Audience: 4M +

                                                               9
SPECIALTY SPORTS GROUP (SSG)

                               10
CUSTOMER LANDSCAPE
ORIGINAL EQUIPMENT
AFTERMARKET
11PORTFOLIO OF PERFORMANCE DEFINING PRODUCTS
EASTON EC90AX - BEST
GRAVEL WHEELSET
MARZOCCHI Z1 COIL
A great performing, big-hit-
swallowing fork at a
relatively reasonable price.
Comfortable, big-hit
capable and stiff; out-
performs many more- #1 STEM TO BUY
expensive forks; swallows
bigger bumps with less
feedback than its RockShox
Yari rival. – Bike Radar
#1 SUSPENSION FORK & REAR
SHOCK
12GROWTH OPPORTUNITIES and WHITE SPACE
MARKET EMERGING INNOVATIVE AFTER SALE
EXPANSION SEGMENTS COMPONENTS INTEGRATED SYSTEMS SERVICES
➢ Forks and Suspensions market expansion through new segments and price point management
➢ Components market penetration through strategic OEM relationships
➢ Evolution of Value Chain integration e.g. Live Valve integrated with crank sensor, bundling of components
➢ After-sale Services expansion through loyalty relationships and expanded life-time value relationships.
13SSG SALES
$ IN MILLIONS
FY 2020 Growth of 22%
FY 2021 YTD Growth of 85%
3 Year CAGR of 14%
$367
$300
$282
$246
$118
$64
2017 2018 2019 2020 Q1'20 YTD Q1'21 YTD
Solid growth in existing premium mountain bike product lines coupled
with product line expansion has enabled FOX to historically meet or
exceed its mid to high single digit long term growth target
14POWERED VEHICLES GROUP (PVG)
CUSTOMER LANDSCAPE

                     ORIGINAL EQUIMENT

                       AFTERMARKET

                                         16
GROWTH OPPORTUNITIES and WHITE SPACE
SIGNIFICANT PENETRATION GROWING PENETRATION ADDITIONAL OPPORTUNITIES
TRUCK & SUV ATV MOTORCYCLE DEFENSE
UPFITTING SNOW STREET PERFORMANCE COMMERCIAL
OFF-ROAD UTV MARINE
➢ OEM market expansion through Newer Platforms biding and Product Innovation
➢ Upfitting market expansion through increased number of dealership relations/trucks sold per dealership
➢ Military market expansion through dedicated facility operations in Southern California
➢ Continue to explore ways to penetrate markets for commercial trucking/RVs
17PVG SALES
$ IN MILLIONS
FY2020 Growth of 16%
FY 2021 YTD Growth of 35%
3 Year CAGR of 32%
$524
$451
$337
$230
$163
$121
2017 2018 2019 2020 Q1'20 YTD Q1'21 YTD
Strong growth in Off-Road capable On-Road markets further
strengthened by Off-Road sport / recreational markets and acquisitions
has enabled FOX to exceed our low double digit long term growth target
18FINANCIALS
FINANCIALS
19FINANCIAL HIGHLIGHTS
Sales Adjusted EBITDA*
FY 2019 FY 2019
$751M $146M
FY 2020 FY 2020
$891M $176M
+19% +21%
*FOX defines adjusted EBITDA as net income adjusted for interest expense, net other expense, income taxes, amortization of purchased intangibles, depreciation, stock-based compensation, offering expense, strategic
transformation costs, contingent consideration valuation adjustments, acquisition-related compensation expense, litigation-related costs, and certain other acquisition-related costs that are more fully described in the appendix.
20CONSISTENT SALES GROWTH FUELED BY
PRODUCT LEADERSHIP AND NEW MARKETS
$ IN MILLIONS
Sales Growth – Consolidated SALES GROWTH – MAJOR MARKETS
3 Year CAGR of 23% PVG 3-year CAGR of 32%
FY 2020 Growth of 19%
SSG 3-year CAGR of 14%
Q1`21 YoY Growth of 53%
TOTAL COMPANY SALES
FY 2020 Q1’21 TTM
$891
$751
$619
SSG SSG
$476
41% PVG 43%
PVG
57%
$281 59%
$184
2017 2018 2019 2020 Q1'20 YTD Q1'21 YTD
21LEVERAGING AFTERMARKET STRENGTH TO DRIVE
OEM SPEC GROWTH AND EXPAND CUSTOMER BASE
FY 2020 Q1’21 TTM
AM AM
45% OEM 45% OEM
55% 55%
➢ FOX typically enters new markets in the aftermarket channel to drive end-consumer adoption and brand value,
which often leads to OEM spec wins
➢ Focused on maintaining a healthy balance between the two channels to sustain long-term growth and
competitive advantage
22IMPROVING PROFITABILITY THROUGH
STRATEGIC INITIATIVES
$ IN MILLIONS
3 Year CAGR of 23%
Opportunity exists to achieve sustainable
2020 Adjusted EBITDA Growth of 21% Adjusted EBITDA Margins in excess of 20% over
2020 Adjusted EBITDA Margin of 19.8% the next few years through continued
Q1’21 YoY Adjusted EBITDA Growth of 93% improvement initiatives
$176 Initiatives Include:
$146 ➢ Powered Vehicle manufacturing and R&D
$125 platform expansion and supply chain
optimization in North America
$94
➢ Other process-related efficiency initiatives
$60
including a new ERP system
➢ Further optimizing bike production in
$31
Taichung, Taiwan facility
2017 2018 2019 2020 Q1'20 YTD Q1'21 YTD
NOTE: See appendix for reconciliation of Adjusted EBITDA to its most comparable GAAP measure.
23SOLID LIQUIDITY AND CASH GENERATION
Net LEVERAGE RATIO(1)
FLEXIBILITY ON CAPITAL ALLOCATION Q1’21 YTD Long Term Target
0.8xPROFITABLE BUSINESS MODEL PROVIDES FURTHER
GROWTH OPPORTUNITIES OR LEVERAGE REDUCTION
STRONG CASH
➢ Cash position along with capacity on revolver provides
POSITION & CREDIT adequate near-term liquidity
FACILITY
➢ Focused on imperative operational and strategic initiatives
CASH MANAGEMENT ➢ Leveraging the lessons learned during pandemic to
improve our cash management moving forward
OTHER USES ➢ M&A screen for possible future acquisitions
25WRAP UP
Proven Track Record
Organic and of Financial Success
Adjacent Growth
A Company of Opportunities
Passionate
Enthusiasts
Diversity of
Applications &
Markets
Innovative
Technologies: SUSTAINABLE
COMPETITIVE ADVANTAGE
Performance
Defining Products
Aspirational TO ENABLE FUTURE GROWTH
Brand
26APPENDIX
29ADJUSTED EBITDA RECONCILIATION
ADJUSTED EBITDA RECONCILIATION
Fiscal Year Year to Date
($ in Millions) 2017 2018 2019 2020 Q1'20 Q1'21
Net Income $43.2 $85.4 $94.5 $91.7 $8.7 $38.0
Provision for Income Taxes 21.1 5.5 14.1 12.8 0.9 4.0
Depreciation & Amortization 9.9 14.2 17.6 33.9 5.8 10.0
Stock-Based Compensation 8.7 7.3 6.9 8.6 1.9 2.5
Fair Value Adjustment of Contingent Consideration and Acquisition
1.4 - - - - -
Related Compensation
Patent Litigation Related Expenses 4.7 7.2 4.4 2.0 0.4 0.3
Other Acquisition and Integration Related Expenses (1) 1.9 0.9 2.7 14.9 10.9 1.3
Strategic Transformation Costs (2) - - 1.7 2.8 0.6 0.5
Tax reform implementation costs - 0.5 0.2 - - -
Offering Expense 0.1 - - - - -
Other Expense, Net 2.8 3.6 4.1 9.6 1.9 3.9
Adjusted EBITDA $93.8 $124.6 $146.2 $176.3 $31.3 $60.4
Divided by Sales $475.6 $619.2 $751.0 $890.6 $184.4 $281.1
Adjusted EBITDA margin 19.7% 20.1% 19.5% 19.8% 17.0% 21.5%
(1) Represents various acquisition-related costs and expenses incurred to integrate acquired entities into the Company’s operations, excluding $160 and $53 in stock-b ased compensation for
the three month periods ended April 2, 2021, and April 3, 2020, respectively, and the impact of the finished goods inventory valuation adjustment recorded in connection with the purchase of
acquired assets.
(2) Represents costs associated with various strategic initiatives including the expansion of the Powered Vehicles Group’s manufacturing operations. For the three month period ended April 2,
2021, $508 is classified as cost of sales. For the three month period ended April 3, 2020, $314 is classified as operating expense, and $287 is classified as cost of sales.
30THANK YOU
29You can also read