Q2 Conference Call Presentation - Linda Hasenfratz August 11, 2021 - Linamar
←
→
Page content transcription
If your browser does not render page correctly, please read the page content below

Q2 Conference Call Presentation
For Audio Only Dial in:           Linda Hasenfratz
North America: (877) 668-0168
International: (825) 312-2386      August 11, 2021
Conference ID: 1797109
Forward Looking Information, Risk and Uncertainties
Certain information regarding Linamar set forth in this presentation and oral summary, including management’s
assessment of the Company’s future plans and operations may constitute forward-looking statements. This
information is based on current expectations that are subject to significant risks and uncertainties that are difficult to
predict. Actual results may differ materially from these anticipated in the forward-looking statements due to factors
such as customer demand and timing of buying decisions, product mix, competitive products and pricing pressure.
In addition, uncertainties and difficulties in domestic and foreign financial markets and economies could adversely
affect demand from customers. These factors, as well as general economic and political conditions and public
health threats, may in turn have a material adverse effect on the Company’s financial results. Please also refer to
Linamar’s most current Management’s Discussion and Analysis of Financial Condition and Results of Operations
("MD&A") and Annual Information Form (“AIF”), as replaced or updated by any of Linamar’s subsequent regulatory
filings, which set out the cautionary disclaimers, including the risk factors that could cause actual events to differ
materially from these indicated by such forward looking statements. These documents are available at
https://www.linamar.com/investors. The Company assumes no obligation to update the forward-looking statements,
or to update the reasons why actual results could differ from those reflected in the forward-looking statements.
Content is protected by copyright and may not be reproduced or repurposed without express written consent by the
Company.
                                                                                                                        2
                                                                                                                © Linamar Corporation 2
COVID-19 Update

                  © Linamar Corporation 3
Pandemic Crisis Management
   Assemble Team

                                                                                                            Gather Data
                          COVID-19 Task Force

                                                                                                            Make a Plan & Execute
   Communicate

                   Employees    Investors   Customer   Employees   Financially   Customers   Community

                                                                                                         © Linamar Corporation 4
Current Focus
▪   Safe Workplace
      ▪ Ensure we continue to maintain a safe work environment
      ▪ As vaccination rates continue to climb we are looking at implementing new protocols to reflect our ability to
          interact more together safely
▪   Testing
      ▪ Testing running on a regular basis for Linamar employees in jurisdictions where test kits are available
      ▪ Regular testing is key to controlling community spread
           ▪    Most contagious in 1-3 days BEFORE first symptoms
           ▪    Only way, along with vaccination, we keep ourselves and safe and get back to normal
           ▪    Critical to avoiding another wave driven by variants
▪   Vaccinations
      ▪ Encouraging employees to get fully vaccinated
           ▪    Core Guelph plants 81% first shot complete
           ▪    Vaccines have been proven safe by extensive clinical trials and rigorous government review
           ▪    Only way, along with testing, we keep ourselves and families safe and get back to normal
           ▪    Critical to avoiding another wave driven by variants
      ▪ Linamar Vaccination Clinic a Huge Success
           ▪    Completed >57,000 injections for Wellington Dufferin Guelph in 5 months of operation
           ▪    Our clinic recognized as the most efficient with best throughput per staff member
           ▪    Playbook on how to launch posted on website for other companies to access
           ▪    Looking at possibly creating a mobile unit to help clean up remote/rural areas not yet vaccinated, also to run pop ups at our
                plants                                                                                                                     © Linamar Corporation 5
Linamar Vaccination Clinic Wraps Up
▪ Clinic launched early March
▪ >57,000 Shots Administered
▪ Playbook posted on Linamar website to
  assist any company in launching their own
  clinic quickly

Community Posts (Volunteers & PH)

Our Volunteers
                 Celebrating the success   Realizing the clinic is ending
Sales, Normalized¹ Earnings and CPV

1 –Management uses certain non-GAAP financial measures including
normalized earnings which exclude foreign exchange impacts and the impact of
unusual items when analyzing consolidated and segment underlying
operational performance.
For more information refer to the section entitled “Non-GAAP and Additional
GAAP Measures” in the Company’s separately released Management’s
Discussion and Analysis (“MD&A”).

                                                                               © Linamar Corporation 9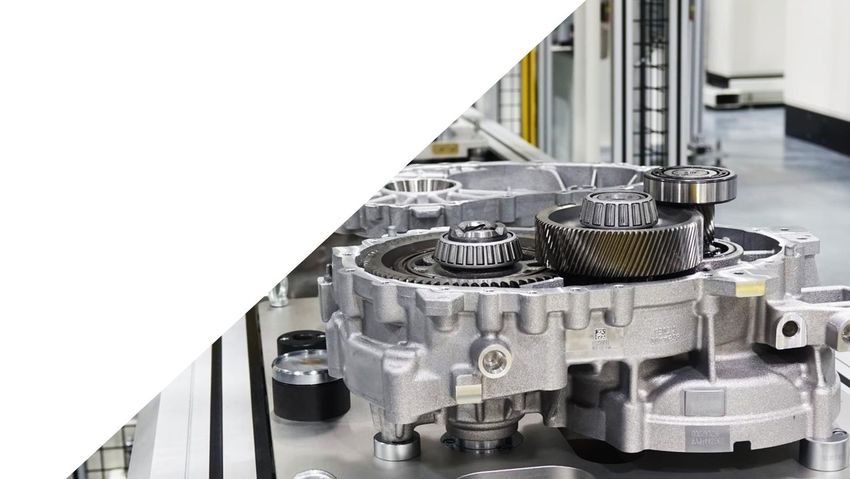
Sales, Normalized Earnings, and Margins (in millions CAD)
                                                                                                                                       Q2 2021                                           The key impacts to the segments vs prior
                                                                    Q2 2021                  Q2 2020                    %Δ
                                                                                                                                       The key factors impacting results in              year are:
  Sales                                                                1,575.3                    923.6               70.6%            the quarter are:                                  Mobility
                                                                                                                                       ▪ Strong market demand in all                     ▪ Global light vehicle markets up 45%;
  EBITDA – Normalized²                                                   259.2                     92.1             181.4%                 businesses; partially offset by                   ▪ Mobility sales growth of 78% far exceeds
                                                                                                                                       ▪ Chip related customer shutdowns                          market growth; partially offset by
  EBITDA – Normalized Margin                                            16.5%                    10.0%
                                                                                                                                           negatively impacting sales and                ▪ Reduced customer production levels due to
     Industrial OE – Normalized¹                                           66.3                    36.5               81.6%                earnings in auto business;                       semi-conductor chip shortages; and
                                                                                                                                       ▪ FX headwinds;                                   ▪ FX headwinds.
     Industrial OE – Normalized Margin                                  16.8%                    14.1%                                 ▪ Less government subsidies as                    Industrial
                                                                                                                                           markets continue to recover; and              ▪ Skyjack markets strongly recovering &
     Mobility OE – Normalized¹                                             85.9                  (55.9)             253.7%             ▪ Supply chain, labour availability and              market share up in targeted boom markets;
                                                                                                                                           logistics challenges increasing costs         ▪ MacDon markets & market share up in all
     Mobility OE – Normalized Margin                                      7.3%                  (8.4%)
                                                                                                                                           and hindering production in all                  core products; partially offset by
  OE – Normalized¹                                                       152.2                   (19.4)             884.5%                 businesses.                                   ▪ FX headwinds.
  OE – Normalized Margin                                                  9.7%                  (2.1%)                                           OE Normalized Margin¹           EBITDA Normalized Margin²          NE Normalized Margin³
                                                                                                                                                                                               18.9%       17.9%     19.2%
  NE – Normalized³                                                       106.9                   (22.0)             585.9%
                                                                                                                                                   14.0%      13.8%      13.8%                                                       16.5%
  NE – Normalized Margin                                                  6.8%                  (2.4%)                                                                                          12.1%                 12.4%
                                                                                                                                                                                     10.0%
                                                                                                                                                                                                           10.3%                      9.7%
                                                                                                                                                   8.0%        7.0%
  EPS – Normalized4                                                        1.63                  (0.34)             579.4%                                                6.7%
                                                                                                                                                                                                  8.6%                 8.9%           6.8%
                                                                                                                                                                                                             7.6%
                                                                                                                                                   5.5%        4.7%
1 – Operating Earnings before unusual items and foreign exchange impacts from revaluation of the balance sheet.                                                          4.4%        -2.1%
2 – EBITDA before unusual items and foreign exchange impacts from revaluation of the balance sheet.
3 – Net Earnings before unusual items and foreign exchange impacts from revaluation of the balance sheet, tax affected.
4 – Earnings per share (EPS) before unusual items, and foreign exchange impacts from revaluation of the balance sheet, tax affected.                                                 -2.4%
                                                                                                                                                   Q3 19      Q4 19      Q1 20       Q2 20      Q3 20      Q4 20      Q1 21     Q2 21
                                                                                                                                                                                                                        © Linamar Corporation 10
Automotive Sales & Content Per Vehicle (CPV)
CPV Q2 2021 CPV Q2 2020 CPV % Change Vehicle Production Automotive Automotive Automotive
Units % Change Sales Q2 2021 Sales Q2 2020 Sales % Change
(CAD Millions) (CAD Millions)
North America 176.62 185.56 (4.8%) 131.3% 588.1 267.1 120.2%
Europe 80.07 81.27 (1.5%) 86.7% 336.4 183.0 83.8%
Asia Pacific 12.51 13.92 (10.1%) 20.0% 128.3 118.9 7.9%
Global CPV1 59.18 46.49 27.3% 45.3% 1,052.8 569.0 85.0%
Other Automotive Sales - - - - 53.8 37.8 42.2%
Annual CPV, except Q2 2021
North America
▪ CPV down in each region with key
159.07 163.85 166.17 176.00 176.62 customers disproportionately
2017 2018 2019 2020 Q2 2021 affected by chip related shutdowns
Europe
▪ Global CPV up thanks to our
69.62 78.30 81.58 77.73 80.07 strongest sales growth coming in the
2017 2018 2019 2020 Q2 2021 region with the lowest relative
Asia Pacific
production – global production
9.66 9.82 9.72 12.81 12.51
growth is a lot less than global
2017 2018 2019
Global CPV 1
2020 Q2 2021
automotive sales growth
53.80 56.96 59.15 58.85 59.18
2017 2018 2019 2020 Q2 2021
1 – Global CPV includes only the markets that Linamar serves of North America, Europe, and Asia Pacific. Source: IHS Markit, July 2021 © Linamar Corporation 11Commercial & Industrial Sales (in millions CAD)
Q2 2021 Q2 2020 % Change ▪ Skyjack
▪ Global markets up more than double 2020 in Q2 and
Sales 468.7 316.7 48.0% market share growth, notably in booms globally,
driving strong sales growth
▪ MacDon
▪ Draper header market up 20% in NA in Q2
▪ Solid market share gains in all core products
QvQ¹ Change in Commerical & Industrial Sales Growth
25.2% 48.0%
-21.9% -9.6% -37.3% -54.0% -20.0% -1.7%
Q3 18 v Q3 19 Q4 18 v Q4 19 Q1 19 v Q1 20 Q2 19 v Q2 20 Q3 19 v Q3 20 Q4 19 v Q4 20 Q1 20 v Q1 21 Q2 20 v Q2 21
1 – Quarter versus quarter (“QVQ”) indicates year over year comparison of two of the same quarters. © Linamar Corporation 12Capital Expenditures (in millions CAD)
Q2 2021 Q2 2020 ▪ Capex up from 2020 but at a lower level than our normal run
rate as we continue to conservatively manage cash
Capital Expenditures (Capex) 50.8 24.0 ▪ Flexible equipment allows us to continue to grow and tool up
programs until market volumes pick up
Capex as a % of Sales 3.2% 2.6%
▪ Capex will return to normal levels of 6-8% of sales in 2022
Capex Capex as a % of Sales
9.1%
7.4%
5.9%
4.5% 4.4%
3.3% 3.2%
2.6%
24.0
158.5 120.1 90.7 73.9 75.8 59.5 50.8
Q3 2019 Q4 2019 Q1 2020 Q2 2020 Q3 2020 Q4 2020 Q1 2021 Q2 2021
© Linamar Corporation 13Cash Flow Continues to be a Key Priority
▪FCF1 in Q2 $138 million
1,300 40%
1,200
1,100
35%
▪ 13th consecutive quarter of positive FCF
1,000
30% ▪FCF Yield has been consistently >20%
900
800 25% since 2019
▪Liquidity1 excellent with $1.7 billion of
$ Millions
700
20%
600
500
cash available at quarter end
15%
400 317.6 ▪Solid liquidity and balance sheet
304.0
300
10%
positions us well for takeover and
acquisition opportunities as they arise
200
5%
100
468.6 236.7 166.9 703.6 1,185.0 170.5 137.7
- 0%
2016 2017 2018 2019² 2020 Q2 2020 Q2 2021
Annual Results YTD Current Quarter FCF Yield - Last 12 Months²ʼ³
1 - For more information on the Free Cash Flow and Liquidity measure refer to section entitled “Non-GAAP and Additional GAAP Measures” and “Liquidity and Capital Resources” respectively, in the Company’s separately released Management
Discussion and Analysis (“MD&A”).
2 - Free cash flow has been adjusted for additions of property, plant and equipment related to the dissolution of a joint venture.
3 - Free cash flow yield is calculated as free cash flow divided by fully diluted shares divided by share price.
© Linamar Corporation 14Leverage (in millions CAD)
Q2 2021 Q1 2021 Q2 2020 ▪We have brought down net debt by $1.96 Billion
Net Debt 198.7 308.9 1,342.1 from our peak in early 2018
Net Debt to EBITDA 0.17x 0.31x 1.80x
Net Debt to EBITDA
0.17x
1.75x 1.50x 1.57x 1.80x 1.11x 0.50x 0.31x
1
Q3 2019 Q4 2019 Q1 2020 Q2 2020 Q3 2020 Q4 2020 Q1 2021 Q2 2021
1 - 2020 EBITDA restated in Q1 2021. Please refer to the definition of EBITDA in the section entitled “Non-GAAP and Additional GAAP Measures” in the Company’s separately released MD&A. © Linamar Corporation 15Challenges
© Linamar Corporation 16Disruptions
Semi Conductor Chip Major Increases in
Shortages Shipping Costs
Spiking Commodity Prices Labour Shortages
© Linamar Corporation 17Semiconductor Chip Shortage – Light Vehicle Production Impact
Total estimated 2021 volume loss of 5.3M units. Supply disruption expected to continue in Q4 2021 and Q1 2022 (amount TBD)
with supply stabilizing in Q2 2022.
Estimated Volume Loss by Quarter Estimated Volume Loss by Region
3.0 2.60 2.5
2.5 1.92
2.0 1.65
2.0 1.40
1.44 1.5
Millions
Millions
1.5 1.27
0.87 0.86
1.0 0.74
1.0 0.58 0.48
0.35 0.43 0.43 0.33
0.5 0.23
0.5 0.07 0.13 0.13
0.0 0.0
Volume loss Q1 2021 Volume loss Q2 2021 *Volume loss Q3 2021 North America Europe Asia-Pacific ROW
Volume loss Q1 2021 Volume loss Q2 2021 *Volume loss Q3 2021 Total
Estimated Volume Loss by OEM Estimated Volume Loss - Start of Quarter Versus Latest Estimate
Total Q1-2021 to Q3 2021 3.0 2.60
Ford, 850,545
2.5
Other, 1,597,280
2.0
Stellantis, 1.44 1.27
Millions
732,442 1.5
Nissan, 207,980 1.0 0.63
SAIC-VW, 232,500 0.5 0.16 0.05
General Motors,
0.0
Renault-Nissan-Mitsubishi,… 661,659
Volume loss Q1 2021 Volume loss Q2 2021 Volume loss Q3 2021
Volkswagen, 459,004 Estimate at Start of Quarter Latest Estimate
FAW-VW, 316,310
Original Estimates Jan 12th for Q1, Mar 12th for Q2, May 7th for Q3
Source: IHS Markit, August 9, 2021. *Volume loss in Q3 may increase as additional OEMs announce shutdowns due to lack of supply. © Linamar Corporation 18Commodity Prices a Challenge
Pass Through for Mobility, Less Flexibility in Industrial
Steel Plate (CDN) - per
metric ton Aluminum (USD) - per lb
$1.40
$1,200.00 $1.20
$1,000.00 $1.00
$800.00 $0.80
$600.00 $0.60
$400.00 $0.40
$200.00 $0.20
$-
$-
Feb-20
Jun-20
Feb-21
Jun-21
Aug-19
Dec-19
Aug-20
Dec-20
Apr-20
Apr-21
Oct-19
Oct-20
Crude Oil, WTI (USD) - per Scrap Steel No. 1 Busheling
barrel N. America - per long ton
$80.00 $700.00
$70.00 $600.00
$60.00 $500.00
$50.00 $400.00
$40.00
$30.00 $300.00
$20.00 $200.00
$10.00 $100.00
$- $-
Aug-19
Aug-20
Feb-20
Feb-21
Jun-20
Jun-21
Dec-19
Dec-20
Oct-19
Apr-20
Oct-20
Apr-21
Commodity Pricing Update Aug 5, 2021 © Linamar Corporation 19Ocean Freight A Key Concern…
$20,500 India 20'
India 40'
$18,500
Germany 20'
$16,500 Germany 40'
USD Cost Per Shipment
China 20'
$14,500
China 40'
$12,500 Brazil 20'
Switzerland 20'
$10,500
Germany 20'
$8,500 Germany 40'
Italy 40'
$6,500
Hungary 40'
$4,500 Japan 20'
S.Korea (Prince Rupert)
$2,500 20'
Jan-20 Jan-21 April May June July
Ocean Freight Pricing Update Aug 5, 2021 © Linamar Corporation 20Labour Shortages Exacerbating Situation
▪ Labour Challenge Case Study
▪ December 2019 – 5.6% in LinkedIn
3 Million Impressions
Guelph, struggling to fill
130,000 Job Views
openings
16,000 Applies
▪ June 2021 – 9.4% in Guelph
seasonally adjusted to 13.1%,
even harder to fill open positions
▪ 1,000 openings in Guelph –
major struggle to fill despite
higher unemployment Indeed
200,000 Impressions
▪ Generous government subsidies
22,000 Job Views
an issue – people not motivated
4,000 Applies
to come to work
▪ This is a global issue, not just
Canada
© Linamar Corporation 21Unprecedented
The Most Overused and Least Understood Word of 2021
© Linamar Corporation 22Market Outlook
© Linamar Corporation 23Market Snapshot
Commercial Combine Commercial
2021 Light Vehicle
Truck Heads
Access 2022 Light Vehicle
Truck
Access
North North
America ▲12.3% ▲29.4% ▲20.0% ▲30.9% America ▲16.4% ▲5.7% ▲25.0%
Europe Europe
▲8.9% ▲17.3% ▲10.0% ▲37.4% ▲12.4% ▲6.6% ▲18.1%
Asia ▲8.5% ▼23.3% n/a ▲147.1% Asia ▲7.6% ▼22.0% ▲5.5%
Rest of Rest of
▲21.2% n/a ▲10.0% n/a ▲13.1% n/a n/a
World World
Above projections are external industry expert estimates for total market % unit change as a whole vs. prior year in each of the respective market segments.
They are not internal expectations of Linamar’s results.
Source: IHS Markit estimates for LV, CV Production. Industrial and Agriculture Markets utilize, 3 rd party industry analysts as well as internal forecasts . Asia Access Market includes ROW. Asia & Europe Access markets are AWP only (excludes
telehandlers). Updated July 27, 2021 © Linamar Corporation 24Light Vehicle Sales
Demand Staying Well Above 2020 Despite Lack of Vehicles to Purchase re Chip Issues
China Light Vehicle Sales Europe Light Vehicle Sales US Light Vehicle Sales
% Change YOY
% Change YOY % Change YOY
100% 388% 100% 100%
251%
77%
80% 71% 80% 80% 62%
59%
60% 60% 60% 41%
40% 28% 40% 40%
18%
20% 11% 9% 14%10%10%11%12% 9% 20% 14% 20% 7%
6% 6% 5% 6% 6% 4%
1% -5% 3% 0% 1%
-6%
0% 0% 0%
-2% -2% -4%
-20% -15%
-20% -12% -9%
-14%
-20% -11% -15% -12%
-17% -20% -20% -19%
-40% -27%
-40% -40% -29%
-41% -38%
-47% -46%
-60% -60% -54% -60%
-80% -80% -76%
-80%
-80%
-100% -100% -100%
Jul-20
Jul-21
Jan-20
Mar-20
Apr-20
Jun-20
Oct-20
Nov-20
Dec-20
Jan-21
Mar-21
Apr-21
Jun-21
Feb-20
May-20
Aug-20
Sep-20
Feb-21
May-21
Apr-20
Oct-20
Apr-21
Apr-20
Oct-20
Apr-21
Jul-20
Jul-20
Jan-20
Feb-20
Mar-20
Jun-20
Nov-20
Dec-20
Jan-21
Feb-21
Mar-21
Jun-21
Jan-20
Feb-20
Mar-20
Jun-20
Nov-20
Dec-20
Jan-21
Feb-21
Mar-21
Jun-21
May-20
May-20
Aug-20
Sep-20
May-21
Aug-20
Sep-20
May-21
▪ June sales expected to be down 15% YOY due to ▪ June sales expected to be up 14% YOY as sales ▪ US sales up 4% YOY in July. July sales negatively
lower inventory levels associated with continue to recover from low levels reported last impacted by record low inventory levels due to
semiconductor shortage. year during pandemic related lockdowns. semiconductor shortage.
▪ 2021 sales expected to increase by 6% to 25M, ▪ 2021 sales expected to increase by 8%. ▪ 2021 US sales expected to grow by 14% to 16.7M.
highest since 2018.
Source: IHS Markit, Autonews & Wards Auto, August 4, 2021 © Linamar Corporation 25US Light Vehicle Inventory – Days’ Supply
Will Take Years To Replenish Inventory Levels Regardless of Demand…
Change vs Same Period Last
Year
180
Overall -32
160
140 GM -36
120 Ford -39
100
Stellantis -23
80
60 Toyota -24
40 Honda -38
20
88 77 68 76 64 67 66 61 66 73 67 57 76 69 95 119 61 59 55 52 50 59 55 48 61 54 39 33 25 27 24 Renault/Nissan -41
0
Nov-19
Dec-19
Nov-20
Dec-20
May-21
Jan-19
Feb-19
May-19
Feb-20
May-20
Feb-21
Jun-19
Jan-20
Jun-20
Jan-21
Jun-21
Apr-19
Jul-19
Oct-19
Apr-20
Jul-20
Oct-20
Apr-21
Jul-21
Mar-19
Aug-19
Sep-19
Mar-20
Aug-20
Sep-20
Mar-21
VW -38
-60 -40 -20 0
Overall GM Ford Stellantis Toyota Honda Renault/Nissan VW Ind. Norm. Jul-21 vs. Jul-20
Source: Ward’s Automotive © Linamar Corporation 26Global Light Vehicle Market: Q2 2021, Q3 2021 and 2021
Q2 2021 production decreased by 1.1M units. Q3 2021 forecast reduced by 500,000 units. 2021 full-year forecast reduced by 1.5M.
▪ Q2 2021 light vehicle production lower than ▪ Q3 2021 forecast reduced by 1.1M due to ▪ 2021 full-year outlook reduced by 1.5M due
expected in April due to global shortage of ongoing global shortage of semiconductors to ongoing global semiconductor shortage
semiconductors ▪ Q3 production expected to decline 3% ▪ 2021 production expected to be up 10%
▪ Q2 production still up 49% versus prior year verses prior year versus prior year
Source: IHS Markit, July 16, 2021. Comparison of global light vehicle production forecast at end of Q1 vs latest forecast. © Linamar Corporation 27Industrial Segment Impacts - Skyjack
Access Equipment Market Commentary 2021 Access Industry YTD Results & Forecast
▪ Continued recovery of Aerial Work Platform (AWP) market in Q2 2021. All regions saw
% Change vs. Prior Year
triple-digit increase versus Q2 2020 (low prior year comparison due to pandemic related
lockdowns)
200% 183%
▪ Customer fleet utilization levels remain within 5% of 2019 levels. 173%
180%
▪ Rising commodity prices, supply shortages negatively impacting production and costs. 153%
160% 147%
▪ NAM Access market up 173% YOY in Q2, 71% YTD (June)
140%
▪ EMEA Access market up 108% YOY in Q2, 41% YTD (June)
▪ Asia Access market up 153% YOY in Q2, 183% YTD (June) 120% 108%
▪ 2021 is expected to see double-digit growth in core NAM and EMEA markets, Asia 100%
expected to be up 147% 80% 71%
▪ 2022 is expected to continue to see double digit growth in core NAM and EMEA but single
60%
digit growth in Asia 37% 41%
40% 31%
20%
0%
NAM EMEA Asia*
2021 Full-Year Forecast 2021 YTD (June) Q2 2021
Source: Industry & internal management reports. *Asia Access Market includes ROW. YTD results are Aerial Work Platform (AWP) only. Asia & Europe forecast are AWP only (excludes telehandlers). NAM forecast includes
telehandlers. Updated August 4, 2021 © Linamar Corporation 28Agricultural Market
Agriculture Market Commentary North American Combine Retails
▪ Ag. retailers seeing lean inventory indicating retail demand is high
▪ Commodity price rally, improved farm net income outlook continuing to boost retails 900
▪ Continuing to see challenges with global supply chain availability, material costs,
and logistics 800
▪ North America combine retails up 10% in Q2, 13% YTD (June) 700
▪ Canada combine retails up 22% in Q2, up 22% YTD (June)
▪ United States combine retails up 7% in Q2, 10% YTD (June) 600
▪ 2021 North American combine header retails expected to be up 20% versus 2020 500
▪ The coming months will give us a better idea of the success of the harvest and
400
therefore farmers attitudes towards buying for 2022
300
200
100
0
Jan Feb Mar Apr May Jun Jul Aug Sep Oct Nov Dec
2020 2021
Source: AEM & MacDon internal, August 2021. YTD North America based on AEM Combine flash report. © Linamar Corporation 29Growth Update and Outlook
© Linamar Corporation 30Electrified Vehicles Key Growth Opportunity for Linamar
$75
$65
$55
Content Per Vehicle (CPV)
$45
$35
$25
$15
$5
2015 2016 2017 2018 2019 2020 2021 2022 2023 2024
Electric Hybrid ICE
Updated: July 27, 2021. Estimates based on current projections and EV applications in market. © Linamar Corporation 31Strategy
Maximize Electrification Opportunities
Diverse Products
1 ▪ Propulsion System
▪ Structural and Chassis
▪ Power Generation
▪ Power Storage
Diverse Vehicle Types
▪ Pass car, CUV/SUV, Light truck
▪ Commercial vehicles
▪ Trucks Class 1-8
5
▪ Off road vehicles
Scalable Solutions
▪ Individual components
2
▪ Sub-assemblies
Maximizing ▪
▪
Integrated systems
Full system solutions.
Electrification
Opportunities
4
Diverse Propulsion Types 3 Diverse & Growing
▪ BEV
▪
▪
Hybrid
FCEV
Customer Base
▪ Traditional OEM’s
▪ New Entrants
© Linamar Corporation 32Global Addressable Market Grows More Than 3X in 20 Years
Addressable Market - Light Vehicle
$350
$300
$250
Addressable Market (Billions CAD)
$200
$150
$100
$50
$0
2002
2003
2021
2039
2000
2001
2004
2005
2006
2007
2008
2009
2010
2011
2012
2013
2014
2015
2016
2017
2018
2019
2020
2022
2023
2024
2025
2026
2027
2028
2029
2030
2031
2032
2033
2034
2035
2036
2037
2038
2040
ICE HEV BEV FCEV
Source
IHS Forecasting 2000-2028 Advanced Consensus Projection 2029-2040
ii) Production Share of Technologies by 2040 of ICE 18%, HEV 22%, BEV 50%, Fuel Cell 10%. (Based on Consensus Average of External Industry Expert Forecasts for BEV adoption, Updated August 4, 2021)
© Linamar Corporation 33Launches
4,000.00 Launching over $3.7 billion of new work today
3,500.00
3,000.00
2,500.00
2,000.00
1,500.00
1,000.00
500.00
-
2020 2021 2022 2023 2024 2025
Other Body & Chassis Driveline Engine Transmission
$500 to $600 Million in 2021 $600 to $700 Million in 2022
Updated: July 2021 © Linamar Corporation 34Consolidated Normal Ranges 2020 Actuals Expectations 2021 Expectations 2022
Outlook Sales Growth
Normalized Earnings Growth
(21.6%) Double Digit Growth Continued Double Digit Growth
Q3 Expectations EPS
EBITDA
(32%)
(15%)
Strong Double Digit Growth Continued Double Digit Growth
▪ Auto Normalized Net Margin 7.0% - 9.0% 5.4% Expansion Back Into Normal Range Expansion, Normal Range
▪ Risk we could see similar impact in Q3 as seen in Q2 Capex (% of Sales) 6.0% - 8.0% 264m Up From 2020 Up From 2021
2021 from chip related shutdowns 4.5% Under Normal Range Within Normal Range
▪ Ag Leverage Net Debt:EBITDA 0.50x Continued Improvement Continued Improvement
▪ Solid growth over prior year
▪ Modest growth over Q2 2021 Free Cash Flow $ 1,185 m Solidly Positive Continued Solidly Positive
▪ Access
▪ Solid growth over prior year Industrial
▪ Modest growth over Q2 2021 Sales Growth
Skyjack Double Digit Growth Double Digit Growth
▪ Cash MacDon Double Digit Growth Continued Growth
▪ Continued positive free cash flow Normalized Operating Margin 14.0% - 18.0% 13.4% Light Expansion Towards Normal Range Expansion, Low End Normal Range
▪ General
▪ Expect continued cost impacts and production Mobility
disruptions from supply chain and labour shortage Factors Influencing Sales Growth
issues in both segments Launch Book $3.7 Billion Driving Incremental
▪ Currently not forecasting additional government Sales Of: $376m $500 to $600 million $600 to $700 million
pandemic related subsidies past Q2
Business Leaving (% Consolidated Sales) 5.0% - 10.0% Low End of Normal Range Low End of Normal Range
▪ Given ongoing challenges and uncertainties, Q3
should be conservatively forecast to be similar to Q2 Normalized Operating Margin 7.0% - 10.0% 6.5%
2021 in earnings performance. Expansion, Mid Normal Range Expansion, Normal Range
© Linamar Corporation 35New Business
© Linamar Corporation 36New Business Win
$64M in new business wins for battery electric vehicle driveline components including two wins for a Domestic China OEM
Average Annual Revenue SOP Year Peak Volume Year
$64 M / year 2022 2024
Production Location
Canada & China
© Linamar Corporation 37New Business Win
$111M in new business wins for increased production of 10-speed automatic transmission components
Average Annual Revenue SOP Year Peak Volume Year
$111 M / year 2022 2023/4
Production Location
Canada
© Linamar Corporation 38New Business Win
$80M in wins for all-new, next generation 8-speed transmission components
Average Annual Revenue SOP Year Peak Volume Year
$80 M / year 2024 2026
Production Location
Canada
© Linamar Corporation 39New Business Win
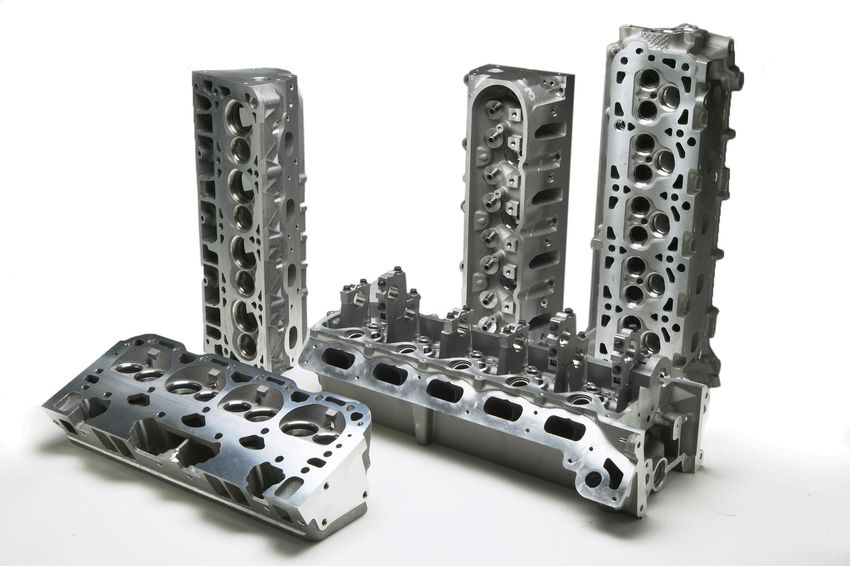
$90M in volume increase and program extension wins for fuel-efficient cylinder head programs
Average Annual Revenue SOP Year Peak Volume Year
$90 M / year 2022 2023/4
.
Production Location
Mexico & France
© Linamar Corporation 40Innovation
© Linamar Corporation 41Innovation in Aerial Work Platforms
SJ20 Vertical Mast Lift
▪ Began shipments to the rental market in
early spring 2021
▪ Offers 20’ working platform height, full
electric drive, improved duty cycle and
battery life
▪ Received 2021 Editor’s Choice Award
from Rental Magazine
© Linamar Corporation 42Innovation in Harvesting Equipment
New MacDon FD2 Series Announced
▪ The new 2 Series FlexDraperTM
launched to the market as a 2022
Model Year
▪ More crop capacity, enables faster
cutting speeds, and more flex for
better ground following
▪ Begins production Spring 2022
© Linamar Corporation 43Innovation for Mobility Electrification
Linamar MD Beam eAxle Linamar UD Beam eAxle Linamar LD eAxle
Commercial Vehicle eAxle Product Line
▪ Continued R&D development in market leading technology solutions for Commercial Vehicle EV eAxle systems
▪ Product family of advanced eAxle offerings covering Class 1 through Class 6 vehicle segment applications
© Linamar Corporation 44Innovation with Early Stage Partner: IMSystems
IMSystems Manufacturing Agreement
▪ Patented gearbox technology for use in multi-axis
industrial robots
▪ Leveraging Linamar’s manufacturing expertise, global
footprint and product development rigor
▪ Anticipated Start of Production in 2024 upon
successful product validation
© Linamar Corporation 45Digitization with AI/ML and Our Digitization Journey
July 2021
61
61
Plants
Plants
4,559 3,476 5000
4500
Category Counts by Quarter
16000
Robots 4000 14000
Connected Digital Asset Counts by Category
LMMS Data
Collection Connections 3500 12000
Total Connected Digital Assets
3000
2,527 10000
2,004 1,180 2500
8000
Connected 2000
Machines 6000
1500
RFID Stations 4000
1000
Vision Systems
500 2000
2,425 9 973 0 0
Traceability
AGVs Marking
Stations TOTAL
AGVs
Traceability Read Stations Robots
Vision Systems
© Linamar Corporation 46Financial Review
Dale Schneider
© Linamar Corporation 47Sales, Normalized Earnings, and Margins (in millions CAD)
Q2 2021 The key impacts to the segments vs prior
Q2 2021 Q2 2020 %Δ
The key factors impacting results in year are:
Sales 1,575.3 923.6 70.6% the quarter are: Mobility
▪ Strong market demand in all ▪ Global light vehicle markets up 45%;
EBITDA – Normalized² 259.2 92.1 181.4% businesses; partially offset by ▪ Mobility sales growth of 78% far exceeds
▪ Chip related customer shutdowns market growth; partially offset by
EBITDA – Normalized Margin 16.5% 10.0%
negatively impacting sales and ▪ Reduced customer production levels due to
Industrial OE – Normalized¹ 66.3 36.5 81.6% earnings in auto business; semi-conductor chip shortages; and
▪ FX headwinds; ▪ FX headwinds.
Industrial OE – Normalized Margin 16.8% 14.1% ▪ Less government subsidies as Industrial
markets continue to recover; and ▪ Skyjack markets strongly recovering &
Mobility OE – Normalized¹ 85.9 (55.9) 253.7% ▪ Supply chain, labour availability and market share up in targeted boom markets;
logistics challenges increasing costs ▪ MacDon markets & market share up in all
Mobility OE – Normalized Margin 7.3% (8.4%)
and hindering production in all core products; partially offset by
OE – Normalized¹ 152.2 (19.4) 884.5% businesses. ▪ FX Headwinds.
OE – Normalized Margin 9.7% (2.1%) OE Normalized Margin¹ EBITDA Normalized Margin² NE Normalized Margin³
18.9% 17.9% 19.2%
NE – Normalized³ 106.9 (22.0) 585.9%
14.0% 13.8% 13.8% 16.5%
NE – Normalized Margin 6.8% (2.4%) 12.1% 12.4%
10.0%
10.3% 9.7%
8.0% 7.0%
EPS – Normalized4 1.63 (0.34) 579.4% 6.7%
8.6% 8.9% 6.8%
7.6%
5.5% 4.7%
1 – Operating Earnings before unusual items and foreign exchange impacts from revaluation of the balance sheet. 4.4% -2.1%
2 – EBITDA before unusual items and foreign exchange impacts from revaluation of the balance sheet.
3 – Net Earnings before unusual items and foreign exchange impacts from revaluation of the balance sheet, tax affected.
4 – Earnings per share (EPS) before unusual items, and foreign exchange impacts from revaluation of the balance sheet, tax affected. -2.4%
Q3 19 Q4 19 Q1 20 Q2 20 Q3 20 Q4 20 Q1 21 Q2 21
© Linamar Corporation 48Foreign Exchange Gain/Loss (in millions CAD)
Q2 2021 Q2 2020 +/- ▪ Total FX Gain was $1.5 which was fully related to the
FX Gain/(Loss) – Operating1 1.5 (5.9) 7.4 revaluation of operating balances.
FX Gain/(Loss) – Financing - (5.1) 5.1
▪ FX Gain – Operating was a $1.5 gain with a $7.4 gain in
Total FX Gain/(Loss) 1.5 (11.0) 12.5 Industrial and $5.9 loss in Mobility.
Operating Margin 9.8% (2.7%) ▪ FX Gain impacted EPS by 2 cents in the quarter.
Operating Margin – Normalized2 9.7% (2.1%)
FX Gain/(Loss) – Impact on EPS FD3 0.02 (0.13)
Total FX
Gain
5.7 14.1 1.5
(19.6) (11.0) (6.6) (12.4) (6.4)
(Loss)
Q3 2019 Q4 2019 Q1 2020 Q2 2020 Q3 2020 Q4 2020 Q1 2021 Q2 2021
1 – Foreign Exchange as a result of the revaluation of operating balances due to changes in foreign exchange rates.
2 – Operating Earnings before unusual items and foreign exchange impacts from revaluation of the balance sheet.
3 – The impact on Earnings Per Share Fully Diluted from FX is a non-GAAP financial measure that divides the tax effected foreign exchange impact by the Company’s diluted number of shares © Linamar Corporation 49Industrial Sales, Earnings, and Margins (in millions CAD)
▪ Industrial sales increased by 51.8% or $134.3 to $393.5.
Q2 2021 Q2 2020
Finance ▪ The sales were helped by:
Sales 393.5 259.2 ▪ strong global demand and boom market share gains (EU and Asia)
updating at Skyjack; and
for dale ▪ strong volumes at MacDon driven by market demand and further
Operating Earnings 73.7 24.5 driven by market share gains.
▪ The sales were hurt by:
Foreign Exchange1 (Gain)/Loss (7.4) 12.0 ▪ a negative FX impact related to the change in rates since last year.
▪ Normalized Industrial OE increased $29.8 or 81.6% to $66.3.
Operating Earnings – Normalized2 66.3 36.5
▪ The Normalized OE was helped by:
▪ the strong sales at Skyjack and MacDon; and
Operating Earnings Margin 18.7% 9.5% ▪ an AR provision reversal based on cash collected in the quarter
▪ The Normalized OE was hurt by:
Operating Earnings Margin – Normalized2 16.8% 14.1% ▪ reduced COVID-19 government support due to the market
recoveries;
▪ a negative FX impact related to the change in rates since last year;
▪ ongoing supply chain issues increase costs for items such as raw
materials and freight.
1 – Foreign Exchange as a result of the revaluation of operating balances due to changes in foreign exchange rates.
2 – Operating Earnings before unusual items and foreign exchange impacts from revaluation of the balance sheet. © Linamar Corporation 50Mobility Sales, Earnings, and Margins (in millions CAD)
▪ Mobility sales increased by $517.4 to $1,181.8.
Q2 2021 Q2 2020
▪ The sales were helped by:
Sales 1,181.8 664.4 ▪ market recoveries since Q2 2020 driving significant volume; and
▪ increasing volumes on launching programs.
Operating Earnings 80.0 (49.8)
▪ The sales were hurt by:
▪ the market impact of the semi conductor chip supply issues which
are impacting our customers; and
Foreign Exchange1 (Gain)/Loss 5.9 (6.1) ▪ a negative FX impact related to the change in rates since last year.
▪ Normalized Mobility OE were higher by $141.8 to come in at $85.9
Operating Earnings – Normalized2 85.9 (55.9) which is an increase of 253.7%.
▪ Mobility normalized earnings were helped by the significant volume
Operating Earnings Margin 6.8% (7.5%) increases.
▪ Mobility normalized earnings were hurt by
Operating Earnings Margin – Normalized2 7.3% (8.4%)
▪ the ongoing OEM semi-conductor supply issues;
▪ the reduction in global COVID-19 government support as a result of
the market recoveries; and
▪ a negative impact from the changes in FX rates.
1 – Foreign Exchange as a result of the revaluation of operating balances due to changes in foreign exchange rates.
2 – Operating Earnings before unusual items and foreign exchange impacts from revaluation of the balance sheet. © Linamar Corporation 51Operating Expenses (in millions CAD)
Q2 2021 Q2 2020 +/- % ▪ Gross Margin was $228.5 in the quarter and was impacted by:
▪ the margin improvement from the net increases in volumes within both the
Sales 1,575.3 923.6 651.7 70.6%
Mobility and Industrial segments; which were partially offset by
Cost of Goods Sold 1,346.8 882.6 464.2 52.6% ▪ the negative impacts related to the changes in FX rates;
Gross Margin 228.5 41.0 187.5 457.3% ▪ the reduction in global COVID-19 government support; and
▪ the ongoing supply chain issues driving cost increases for items such as raw
Gross Margin as a % of Sales 14.5% 4.4%
materials and freight.
Cost of Goods Sold Amortization 109.4 109.4 -- 0.0% ▪ Amortization decreased to 6.9% due to the strong sales recovery.
COGS Amortization as a % of Sales 6.9% 11.8% ▪ SG&A was $77 for the quarter and was impacted by:
▪ the reductions in government support;
Selling, General, and Administrative 77.0 60.4 16.6 27.5% ▪ increased costs supporting the sales growth; which were partially offset by
SGA as a % of Sales 4.9% 6.5%
▪ the AR provision reversal in the quarter.
Gross Margin as a % of Sales COGS Amortization as a % of Sales SGA as a % of Sales
13.2% 12.2% 12.9% 4.4% 16.7% 16.0% 17.5% 14.5% 5.7% 6.6% 7.0% 11.8% 6.7% 7.2% 6.6% 6.9% 5.4% 6.1% 6.3% 6.5% 5.5% 6.2% 5.1% 4.9%
Q3 2019 Q4 2019 Q1 2020 Q2 2020 Q3 2020 Q4 2020 Q1 2021 Q2 2021 Q3 2019 Q4 2019 Q1 2020 Q2 2020 Q3 2020 Q4 2020 Q1 2021 Q2 2021 Q3 2019 Q4 2019 Q1 2020 Q2 2020 Q3 2020 Q4 2020 Q1 2021 Q2 2021
© Linamar Corporation 52Finance Expenses & Income Tax (in millions CAD)
▪ Finance expenses decreased by $17.0.
Q2 2021 Q2 2020 +/-
▪ Finance expenses were helped by:
▪ the Q2 2020 make-whole payment due to the prepayment of 2021 notes; and
Finance Expense 0.7 17.7 (17.0) ▪ the significant reduction in debt balances since Q2 2020.
▪ Finances expenses were hurt by the lower interest earned due the lower long-term
receivables.
Effective Interest Rate 2.0% 2.0% 0.0%
▪ The effective interest rate remained flat at 2.0% from Q2 2020.
▪ The tax rate increased to 25.9% in the quarter from last year due a prior year adjustment
Effective Tax Rate 25.9% 21.2% 4.7% made in Q2 2020 that did not recur in 2021.
▪ Full year 2021 tax rate expected to be in the range of 24% to 26%.
Finance Expense Effective Interest Rate Effective Tax Rate
11.1 12.0 7.4 17.7 1.5 0.2 7.6 0.7 2.8% 2.8% 2.5% 2.0% 1.8% 1.7% 1.9% 2.0% 23.8% 22.6% 24.6% 21.2% 26.3% 23.7% 26.0% 25.9%
Q3 2019 Q4 2019 Q1 2020 Q2 2020 Q3 2020 Q4 2020 Q1 2021 Q2 2021 Q3 2019 Q4 2019 Q1 2020 Q2 2020 Q3 2020 Q4 2020 Q1 2021 Q2 2021 Q3 2019 Q4 2019 Q1 2020 Q2 2020 Q3 2020 Q4 2020 Q1 2021 Q2 2021
© Linamar Corporation 53Leverage (in millions CAD)
Q2 2021 Q2 2020 ▪ Cash position at the end of the quarter was $731.6
▪ Linamar generated $186.0 in Cash from Operating Activities.
Cash Position 731.6 375.6
▪ Linamar generated $137.7 of Free Cash Flow1 in the quarter.
Available Cash on Credit Facilities 957.6 754.0 ▪ Net Debt to EBITDA was decreased significantly to 0.17x.
▪ Based on current estimates, we expect Net Debt to EBITDA to continue to
Net Debt to EBITDA 0.17x 1.80x
improve by the end of 2021.
▪ Liquidity1 remains strong and improved to $1.7 billion compared to Q2 2020.
Debt to Capitalization 17.3% 30.1%
Net Debt to EBITDA
3 0.17x
1.75x 1.50x 1.57x 1.80x 1.11x 0.50x 0.31x
2
Q3 2019 Q4 2019 Q1 2020 Q2 2020 Q3 2020 Q4 2020 Q1 2021 Q1 2021
1 - For more information on the Free Cash Flow measure and Liquidity refer to sections entitled “Non-GAAP and Additional GAAP Measures” and “Liquidity and Capital Resources” respectively, in the Company’s separately released Management Discussion and Analysis (“MD&A”).
2 – 2020 EBITDA restated in Q1 2021. Please refer to the definition of EBITDA in the section entitled “Non-GAAP and Additional GAAP Measures” in the Company’s separately released MD&A. 54
© Linamar Corporation 54Conclusion
▪ Sales up 71%
▪ Normalized Net Earnings up 585.9%
▪ Strong Sales and Earnings performance in both Segments
▪ Operations have continued to recover
▪ Excellent Free Cash Flow1 generation of $137.7 million in the quarter
▪ Available Liquidity1 remains strong at $1.7 billion
1 - For more information on the Free Cash Flow measure and Liquidity refer to sections entitled “Non-GAAP and Additional GAAP Measures” and “Liquidity and Capital Resources” respectively, in the Company’s separately released
Management Discussion and Analysis (“MD&A”). © Linamar Corporation 55Question and Answer
Consolidated                                    Normal Ranges   2020 Actuals          Expectations 2021                   Expectations 2022

Outlook                                                      Sales Growth

                                                             Normalized Earnings Growth
                                                                                                                                 (21.6%)                   Double Digit Growth     Continued Double Digit Growth

Q3 Expectations                                              EPS
                                                             EBITDA
                                                                                                                                   (32%)
                                                                                                                                   (15%)
                                                                                                                                                    Strong Double Digit Growth     Continued Double Digit Growth

▪ Auto                                                       Normalized Net Margin                           7.0% - 9.0%            5.4%     Expansion Back Into Normal Range          Expansion, Normal Range
   ▪ Risk we could see similar impact in Q3 as seen in Q2    Capex (% of Sales)                               6.0% - 8.0%          264m                         Up From 2020                       Up From 2021
     2021 from chip related shutdowns                                                                                              4.5%                   Under Normal Range                Within Normal Range
▪ Ag                                                         Leverage Net Debt:EBITDA                                              0.50x               Continued Improvement             Continued Improvement
   ▪ Solid growth over prior year
   ▪ Modest growth over Q2 2021                              Free Cash Flow                                                    $ 1,185 m                        Solidly Positive       Continued Solidly Positive

▪ Access
   ▪ Solid growth over prior year                            Industrial
   ▪ Modest growth over Q2 2021                              Sales Growth
                                                              Skyjack                                                                                      Double Digit Growth               Double Digit Growth
▪ Cash                                                        MacDon                                                                                       Double Digit Growth                 Continued Growth
   ▪ Continued positive free cash flow                       Normalized Operating Margin                     14.0% - 18.0%         13.4% Light Expansion Towards Normal Range Expansion, Low End Normal Range
▪ General
   ▪ Expect continued cost impacts and production            Mobility
     disruptions from supply chain and labor shortage        Factors Influencing Sales Growth
     issues in both segments                                  Launch Book $3.7 Billion Driving Incremental
   ▪ Currently not forecasting additional government          Sales Of:                                                           $376m                    $500 to $600 million              $600 to $700 million
     pandemic related subsidies past Q2
                                                              Business Leaving (% Consolidated Sales)        5.0% - 10.0%                            Low End of Normal Range           Low End of Normal Range
   ▪ Given ongoing challenges and uncertainties, Q3
     should be conservatively forecast to be similar to Q2   Normalized Operating Margin                     7.0% - 10.0%           6.5%
     2021 in earnings performance.                                                                                                                Expansion, Mid Normal Range          Expansion, Normal Range

                                                                                                                                                                                       © Linamar Corporation 57
Key Messages
Significantly Outpacing Market
Growth
We Have a War Chest of
Cash
Sustained Strong Production
Ahead
© Linamar Corporation 58Thank You
www.linamar.com
@linamarcorp
Linamar CorporationYou can also read