Quantifying Collective Identity Online From Self-dening Hashtags - Research ...
←
→
Page content transcription
If your browser does not render page correctly, please read the page content below
Quantifying Collective Identity Online From Self- de ning Hashtags Alexander T. J. Barron ( atbarron@iu.edu ) Indiana University Bloomington Johan Bollen Indiana University Bloomington Research Article Keywords: Mass communication, social media, Quantifying, Hashtags, self-de ning Posted Date: October 21st, 2021 DOI: https://doi.org/10.21203/rs.3.rs-960863/v1 License: This work is licensed under a Creative Commons Attribution 4.0 International License. Read Full License
Quantifying collective identity online from
                 self-defining hashtags
              Alexander T. J. Barron1* and Johan Bollen1,2
1
    Luddy School of Informatics, Computing, & Engineering, Indiana
                         University-Bloomington
     2
       Cognitive Science Program, Indiana University-Bloomington
                 *
                   Corresponding email: atbarron@iu.edu

                                 October 19, 2021

                                       Abstract
           Mass communication over social media can drive rapid changes in our
       sense of collective identity. Hashtags in particular have acted as powerful
       social coordinators[1], playing a key role in organizing social movements
       like the Gezi park protests, Occupy Wall Street, #metoo, and #black-
       livesmatter [2, 3, 4]. Here we quantify collective identity from the use
       of hashtags as self-labels in over 85,000 actively-maintained Twitter user
       profiles spanning 2017-2019. Collective identities emerge from a graph
       model of individuals’ overlapping self-labels, producing a hierarchy of
       graph clusters. Each cluster is bound together and characterized seman-
       tically by specific hashtags key to its formation. We define and apply two
       information-theoretic measures to quantify the strength of identities in
       the hierarchy. First we measure collective identity coherence to determine
       how integrated any identity is from local to global scales. Second, we con-
       sider the conspicuousness of any identity given its vocabulary versus the
       global identity map. Our work reveals a rich landscape of online identity
       emerging from the hierarchical alignment of uncoordinated self-labeling
       actions.

1      Main
The evolving nature and structure of collective identity is a crucial driver of
a range of present-day socioeconomic phenomena. Societal norms of identity
evolve rapidly and continuously, with implications for public policy, politics,
and law[5]. Questions of identity permeate popular culture presently, and have
increasingly been the subject of scholarly and scientific investigations[6, 5, 1].

                                           1
Here we quantitatively study the social construction of collective identity
by treating identity as a personal labeling process, a concept explored sepa-
rately in sociology and psychology through Social Identity Theory and Self-
Categorization Theory[7, 8, 9]. A central tenet of this approach is the discrete
affiliations individuals assign to themselves are references to known, external
social categorizations[7, 8]. These self-labels allow an individual to express an
identity relative to the collections of attributes that others use to express their
own identities. From the similarity between individual labeling choices thus
emerges a super-structure of user collectives with aligned identity.
Social media lends itself well to this process of self-labeling. Many platforms
such as Twitter allow individuals to create user profiles to describe themselves,
providing a public space to express identities with words or other language
tokens. Hashtags are likely candidates for such an identity labeling process.
The inclusion of the hash character (#) in any token signals a desire to connect
to others who are presumed to understand what the hashtag means in a broader
social context. The hashtag is thus an interesting signal for individual identity
labeling; it serves as a focal point of common knowledge whose use by any one
person implies its use by many others[10]. For this reason, hashtags have arisen
as crucial social movement coordinators[1] that may bear signals of collective
identity when used as self-descriptors in users’ online profiles. For example, a
user that includes #metoo in their profile expresses a facet of their personal
identity, expecting others to understand it as an identity token that expresses
shared knowledge, implicitly inviting others to do the same. Thus a social
construction of individuals with aligned identities is co-created.
Identity: describing ourselves
We focus on social media profiles as a large-scale, detailed source of data about
individuals publicly declaring their identities. The Twitter streaming API has
been a valuable resource for research on tweets themselves[11, 12, 13], but hides
another resource: user profiles, containing self-descriptions, held in the metadata
of each tweet. Due to a quirk in the standard Twitter API (as of 2020), user
profile information is provided with every tweet, but their contents reflect the
profile at the time of the API request, not the time of the tweet. Twitter’s
streaming sample, in contrast, preserves user profile descriptions when it delivers
its daily tweet sample, providing a historical record of self-descriptions. Profiles
in tweets delivered via streaming sample for a particular user thus comprise a
timeline of user self-descriptions. We represent each user’s collected self-labels
as the set of hashtags held in the timeline of changes to their user profile.
Our user cohort is designed to study those who are active and engaged in
maintaining their identities on Twitter. To satisfy these criteria, we start with
an initial user pool of nearly 2 million English-language, non-bot users known
to have actively maintained their profiles between 2012 and 2014. We harvest
the decahose tweets of these same users occurring from August 2017 through
December 2019, keeping only the roughly 1.1 million users actively maintaining
2their profiles in this time frame, establishing multi-year engagement. We filter
out non-personal organization accounts and retain only users who share at least
one hashtag with another user. Our final collection contains 85,839 non-bot,
non-organization users actively engaged in maintaining and updating their self-
descriptions (see methods section for details). We specifically end collection
before 2020 to avoid any influence from the COVID pandemic.
Mapping Collective Identity through Self-labeling
Alignment
To capture groups of individuals with similar self-labeling behavior, yet distinct
from other such groups, we create a graph model of shared identity with vertices
representing users, and edges between users representing whether they hold
hashtags in common. When individuals hold more hashtags in common, their
declared identities are more similar; therefore, partitioning the resulting user
graph into clusters of dense connections produces groups of users with aligned
identities. To capture identity alignment from the edge weights of the resulting
graph, we partition the graph via modularity-maximization, because of its focus
on clusters with high edge concentration[14]. Given a partition of the user
graph into clusters, we can leverage our knowledge of the hashtags from which
each edge was induced, and the definition of modularity, to rank self-labels by
their individual contribution to a given cluster’s modularity score. The top-n
ranked self-labels that contribute the most to a cluster’s alignment are deemed
“prototypical”, i.e. suitable descriptors of the cluster’s core collective identity
(see methods section).
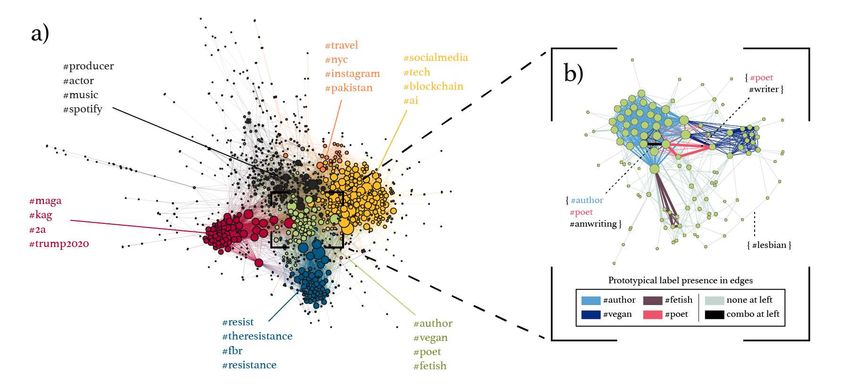
To illustrate how the alignment of self-labeling hashtags in individual user
profiles can reveal the structure of collective identity online, we perform a case
study for a subset of users with the highest follower counts in our data. Due to
their online visibility, these users are more likely to shape collective self-labeling
behavior. We create a hashtag co-use graph of the top 2,500 most-followed
individuals and isolate its giant component, shown in Figure 1a (1,072 ver-
tices, 12,178 edges, density=0.02). We use vertex color to differentiate clusters,
which are annotated semantically using their top-4 ranked prototypical iden-
tity hashtags. Of note in this visualization is the separation of clusters based
on political affiliation (#maga/#kag and #resist/#theresistance) versus those
based on careers (#producer/#actor ), and interests (#travel, #instagram, #ve-
gan, #fetish, #tech, #blockchain). In Figure 1b we illustrate how prototypi-
cal self-labels arise naturally from the edge density within the exemplar (#au-
thor/#vegan/#poet/#fetish) cluster. Edge colors here represent the presence,
but not necessarily complete composition, of prototypical hashtags within edges.
For example, pink edges indicate the presence of #poet in the absence of any of
#author, #vegan, or #fetish, as exemplified in the {#poet, #writer } edge anno-
tation. This entire cluster breaks down neatly into edge collections for each of
the 4 prototypical tags, with some within-edge combination of these prototypical
3tags indicated with black edges (example edge annotated with {#author, #poet,
#amwriting}, combining #author and #poet). Figure 1b thus provides visual
evidence of how the top-n ranked hashtags by modularity score tend to concen-
trate in the highest-weighted and densest edges in in this cluster, as opposed
to the example of the more peripheral {#lesbian} edge. These hashtags can
be considered prototypical because of their importance in binding this cluster
together (see methods section for full description).
From the small-sample graph visualization in Figure 1 we see how more
specific semantic self-labels, not necessarily connected through their semantics
(#author vs. #fetish), can still be associated through the clustering of indi-
viduals with similar self-concepts. This hints at a hierarchical structure emerg-
ing from self-labeling behavior, where a more specific concept integrates into a
broader structure of affiliated concepts in the context of self-professed identity:
for instance, the sexuality of #fetish and #lesbian labels resides inside the en-
tire (#author/#vegan/#poet/#fetish) cluster, which may espouse the emergent
identity of sexuality and writing.
Hierarchy in the broad identity ecosystem
We investigate how the self-labels of individuals collect into a hierarchical struc-
ture of online identity. The Louvain algorithm[15] is a widely-used graph clus-
tering algorithm that leverages modularity in stages, producing a hierarchical
structure where local clusters aggregate in successive steps culminating in a
global, top-level partition. In this work we quantify the qualities of this hierar-
chy, relating local clusters at the bottom of the hierarchy Cjl to the top-level,
global clusters which contain them Cig (see SI Figure 3). To visualize the entire
identity graph spanning 85,839 users, we present the local clusters Cjl as vertices
in Figure 2, summing edge weights between users in any two clusters. To elimi-
nate clutter in the visualization, we display only edges within a backbone of the
graph[16] (see SI Figure 1 for the full graph). We characterize global clusters
using color and characterize clusters by their prototypical hashtags as before.
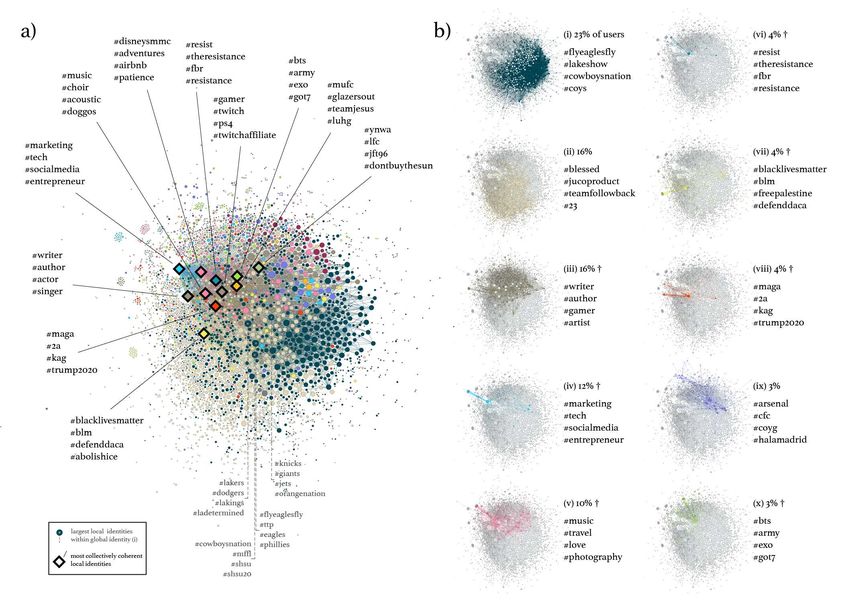
Figure 2a profiles a selection of important and exemplar clusters semantically
at the local level, while Figure 2b pulls out the 10 largest global clusters to be
visualized individually along with their own semantic annotations at the global
level.
We find 4,086 local clusters, collected into 18 global ones. A quick visual
inspection shows the dominance in coverage by some global clusters, indicated
by color. Sports fandom is a clearly dominant global identity, covering 23% of
users in dark blue and characterized in cluster (i) of Figure 2b. Its semantic
annotation covers American and British sports teams (the latter referred to by
#coys, “come on you spurs”). However, the Louvain-derived hierarchy captures
more details of how identity collectives assemble. The largest 4 local clusters
within the sports cluster (i), labeled in Figure 2a, indicate the strong effect of
regionalism on these sports fans: in ranked order of local cluster user size, these
identities are Philadelphia, Los Angeles, Texas, then New York (state) sports
4Figure 1: Left: Visualization of user identity-sharing graph for the giant com-
ponent of the top 2,500 most-followed users. Vertices represent users, with size
indicating vertex degree; edges represent the presence of commonly-held iden-
tity hashtags for the user pair, weighted by the number of tags in common.
Modularity-based clusters are represented by color. Semantic annotations in-
dicate the prototypical hashtags that contributed most to the modularity, and,
therefore, to the degree of identity alignment, of each cluster. Right: Detail of
the #author /#vegan identity cluster at left, showing inner structure and com-
position of self-label co-use in edges. Edge colors here represent the presence of
exactly one, a combination, or none of the four prototypical labels for the cluster,
illustrating the modularity-derived importance of each label for this complete
identity cluster. Dotted lines point to specific edge composition annotations.
fans (see SI for a glossary of hashtags).
The local cluster composition of each global cluster varies widely. At one
end of a spectrum lie global clusters with high user coverage diffused over a
wide base of their local clusters, like clusters (i-iii) in Figure 2b and exemplified
by the global sports cluster (i) already discussed. On the other end of the
spectrum we find highly concentrated clusters like global clusters (iv, vi-viii, or
x) (Figure 2b), with only one or two obvious clusters dominating the local level.
All 10 global clusters shown lie on this conceptual spectrum, i.e. the degree to
which local identity clusters are more or less integrated or diffused with respect
to this hierarchical composition.
5Characterizing the strength of collective identi-
ties
One consequence of aligning with an identity is that the individual becomes
identifiable in the landscape of collective identity. We approach the effects of
self-definition on “identifiability” in two ways, both of general interest for a user
establishing identity online. The first focuses on the coherence of any particular
collective identity: is my particular local identity only one facet of a broad
identity type, or are my local and global identities nearly indistinguishable?
The second focuses on the very act of self-labeling: if I use the self-labels of
my particular local identity, how conspicuous am I among the sea of identifiers?
To unify our treatment of these questions, we take an information-theoretic
approach, as has been used to measure the divergence of language use in recent
works[17, 18, 19].
Coherence: From Figures 1 and 2, we see evidence that encompassing iden-
tity clusters can assemble from more semantically specific, constituent identities.
The sports cluster (i) in Figure 2 exemplifies this, incorporating local fandom
into a wide cluster of sports enthusiasts. But, how coherent is any global iden-
tity as a whole? Is being a Texas sports fanatic indicative of being a sports fan
in general, at a global level? Given our peek into the diversity of local, regional
sports clusters in global cluster (i), the answer would seem to be no. However,
it seems that rabidly consuming K-pop in a local sense does seem to reflect
global K-pop fandom (global cluster (viii) in Figure 2, compared to its local
counterpart). In other words, the collective K-pop identity (global cluster (x))
seems to be more coherent between its local and global levels than the collective
sports identity.
And therefore, binary knowledge of a user’s membership in that local K-
pop identity – whether they are or are not members – drastically reduces the
uncertainty we have on their global identity membership. We call this uncer-
tainty reduction for a given cluster its collective coherence, measuring it with
the mutual information between binary local identity membership Zkl and global
g l g l
identity membership C : MI Zk , C , where Zk distinguishes between member-
ship in local identity Ckl versus all others C¬kl
= j6=k Cjl , C g is the categorical
S
distribution of global identities weighted by their user fraction, and k is the in-
dex of the local identity. When compared to the mutual information measured
similarly for all other local identities, we create a comparative measure of iden-
tity coherence for each first-level, local identity shown in our map (Figure 2a).
We highlight the top 11 most collectively coherent local identities in this visual-
ization with diamond markers, taken from the pronounced tail in the collective
coherence distribution (see SI Figure 2); their global counterpart identities are
marked with †.
Conspicuousness: Given the highly connected nature of our graph, local
identities quite often share labels with other identities across identity bound-
aries. So although a collective identity may be coherent, its average member
might not stand out from the general population as belonging to that specific
6identity. Users from such an identity would be highly conspicuous due to the
identity’s typical vocabulary diverging from all others. This conspicuousness
against the throng is readily measured using information-theoretic techniques.
In this case, we measure how easy it is to determineSthe binary distinction Zkl
between local cluster Ckl versus the others C¬k l
= j6=k Cjl after observing a
single label from the cluster’s vocabulary probability mass function V , embod-
ied in the mutual information MI(Zkl , V ). This is equivalent to the Jensen-
Shannon divergence of V vs. the same for vocabulary of all local identities not
Ckl , a measure used to establish “distinguishability” between different vocabu-
lary usages[20, 17, 19] (see methods section). This measurement can be made
similarly for every local identity, creating a comparative measure of identity
conspicuousness.
Figure 3 plots these conspicuousness measurements for every local identity,
versus their size (number of users). Conspicuousness for small clusters ap-
proaches 1, its upper limit, which makes sense given the construction of the
graph; if these clusters shared more vocabulary with other users, they would
likely be lumped into another local cluster by the resulting sharing of edges.
Overall the trend to less conspicuousness with size points to a susceptibility of
larger clusters to share more vocabulary with others. Of note, however, some
clusters can buck the trend, such as the K-pop cluster labeled in Figure 3 (#bts,
#army).
We establish a base of comparison for these conspicuousness measurements
with a null model preserving user self-labeling behavior but destroying the spe-
cific, empirical label selections each user makes. Behavior here refers to (a)
any user’s predilection for self-labeling, as well as (b) any bias toward using
more popular labels. We separate users into cohorts by how many self-labels
they accrue, each with the associated pool of empirical labels used. For each
cohort, we randomize the labels from its pool across its users, preserving the
label count per user. Once all cohorts are randomized we construct the graph
of label co-use over all cohorts as for the empirical data, finding its hierarchical
cluster structure and measuring the conspicuousness of all local clusters. Fig-
ure 3 shows the 95% confidence interval band over cluster size from 31,190 null
simulations. CI values represent the 2.5 and 97.5 percentiles of conspicuousness
distributions per group size bin interval of 100: [1, 100], [101, 200], etc. 31,190
simulations guaranteed over 100 conspicuousness values generated per bin (see
SI Figure 4). This behavior-preserving null largely captures empirical conspic-
uousness at low cluster size, but does not explain that of most larger identities.
This discrepancy hints at additional processes in collective self-labeling which
could produce these more conspicuous vocabularies not created by this null.
Discussion
Our chosen model of collective identity, leveraging simple graph structure and
concentration of common self-labels into unique clusters per user, shows remark-
able semantic results when considering the prototypical hashtags per cluster. On
7Figure 2: Visualization of collective identity label-sharing graph for over 85,000
users. Vertices represent local (bottom-level) clusters in a Louvain-derived clus-
ter hierarchy; color represents global (top-level) cluster. (a): Total visualization,
with the most collectively coherent identities labeled with diamond markers and
annotated, as well as an illustrative labeling of the largest local clusters within
the global sports cluster (i) in (b). (b): Individual visualizations of the top 10
largest global clusters with user coverage percentages. † indicates high collec-
tive coherence with the corresponding local cluster marked with a diamond in
(a). We observe marked difference in the coherence of local clusters with respect
to their global status. The “tech professional” global cluster (iv) semantically
matches and is dominated by its lone local counterpart in (a); a coherent identity
from local to global levels of the hierarchy. Other global clusters, such as (i-iii),
are diffuse in comparison, a difference we measure using information-theoretic
methods.
81.0 95% null CI #lucifer
#ouat #bts
empirical #army
0.9 #flyeaglesfly
#ttp
#blacklivesmatter
Conspicuousness
0.8 #gamer #blm
#twitch
#lakers #maga #marketing
#2a #resist
0.7 #dodgers
#theresistance
#tech
#ynwa #writer
0.6 #lfc #author
#disneysmmc
#mufc #adventures
0.5 #glazersout
#music
#choir
0.4
0.3 0 2000 4000 6000 8000 0 2000 4000 6000 8000
First-level group size First-level group size
Figure 3: Conspicuousness vs. size for local identities. Conspicuousness mea-
sures the ease of recognizing a user’s identity group given its vocabulary. Con-
spicuousness generally decreases with increasing group size, pointing to an in-
creased tendency for larger groups to use vocabulary shared in common over
multiple groups. A simulated null model preserving users’ predilection for self-
labeling, but randomizing specific label selection, shows a similar tendency with-
out explaining conspicuousness levels for larger groups. This discrepancy points
to additional processes in collective self-labeling which could create these more
conspicuous identity vocabularies. Identities with over 600 users are annotated
with the 2 self-labels contributing the most to the clustering of the identity.
the other hand, each cluster shares many labels with others across the cluster
landscape. This is one indication of how multifaceted a user can be in affiliation
to different identity groups. Although placed in a primary cluster with a hard
boundary, users in aggregate share many self-labels with users in their own sep-
arate, primary clusters. Further work in mapping the structure of self-labeling
in identity could include overlapping clusters.
As for the characterization of the collective identities in this work, it is inter-
esting to consider what our two measures mean. First: we consider coherence.
The procedure for creating the binary variable Zkl for a particular local identity
l g
and then measuring coherence MI Zk , C is an expression for how broad that
identity is. In essence, it is how much we can instantly know about how diverse
a user’s overall chosen identity is, integrating from local to global levels, in the
landscape of identities. All of the annotated identities in Figure 2a are highly
coherent with respect to their global counterparts in Figure 2b, distinct in co-
herence from the rest of the cluster population (SI Figure 2). It is worth noting
9the presence of highly coherent identities corresponding to significant political
movements of the time of data acquisition: #maga, #resist, and #blacklives-
matter. Especially in the context of the binary political environment associated
with the movements, one might expect #blm and #resist identities to coalesce,
but here both are coherent identities unto themselves. Other broad categories
of these highly coherent identities could be considered lifestyle- or interest-
driven (#gamer /#twitch, #disneysmmc/#adventures, or #music/#choir in
Figure 2a), vocation- or aspiration-driven (#writer /#author, #marketing/#tech),
or associated with notoriously avid fandoms (#bts/#army, #mufc/#glazersout,
and #ynwa/#lfc – the latter two identities relate to different football clubs, see
SI Section 1).
Second, we consider conspicuousness MI(Zkl , V ): the average ease an ob-
server has identifying a particular identity source vs. all other identities given
a single self-label[17]. To capture a specific scenario of a newcomer to online
identities, we make this newcomer naive to the probability of encountering a
self-label from any specific identity (see methods section). The divergence of
empirical conspicuousness against our null simulations is quite interesting – here
the location outside a 95% CI is not indicative of any kind of “significance” of
the measurement. Instead, it indicates a difference in outcome from what could
be expected given the behavioral characteristics preserved in the null model.
In this case, preserving user characteristics of quantity and choice for niche vs.
widespread self-labels does not produce the greater levels of conspicuousness
observed. Further work could involve the addition of other dynamics involv-
ing choice of self-labels, such as diachronic processes involving the assembly of
self-labels for users establishing public identities.
The connection to Social Identity Theory (and specific subset Self-Categorization
Theory (SCT)) of this work is loose, focusing on elements of our system of study
that could plausibly represent elements of these theories. Briefly, in SCT so-
cial groups are maintained by two actions of member individuals: i) increasing
personal characteristics similar to other members in-group, and ii) decreasing
personal characteristics similar to individuals outside their group[9]. In this
work, self-labeling via hashtags could be thought of as a mechanism for the for-
mer, increasing in-group similarity of identity. We empirically define identity as
the emergence of common patterns of self-labeling, found via graph clustering.
We also use linguistic tokens as actions in group identity maintenance, a per-
spective more common in earlier manifestations of SCT; although recent calls
have been made to reintroduce language-based practices into SCT[9].
Conclusion
In this work, we collect an unprecedented data set of self-labeling on Twitter,
harvesting labels inherently connected to a user’s sense of identity from their
presence in designated self-descriptions. We take a straightforward approach
with an empirical mapping of collective identity via label co-use and unsu-
pervised identity alignment using modularity-maximization. The hierarchical
10identity structure we obtain exposes variation in how users collect into identi-
ties through the process of self-labeling: our coherence measure documents a
spectrum of collective identity behavior. We find that some collective identities
are more collectively coherent, including the notable examples of political move-
ments during the time period. In a parallel analysis, we measure how conspicu-
ous each collective identity is compared to the overall identity landscape. The
conspicuousness of larger communities is not explained by a behavior-preserving
null model of self-labeling. An interesting followup study would investigate di-
achronic processes in self-labeling behavior that could produce the empirical
conspicuousness seen in this work.
Methods
Our research project does not involve human participants. We collected the
relevant Twitter data without subject interaction, using only data that already
existed and that was collected for a reason other than use in this research study.
Our data collection and analysis has been reviewed and deemed “Exempt” by
the Indiana University Institutional Review Board (Protocol 1707249405). Our
Twitter data is furthermore de-identified by the removal of all individual identity
markers, stored on a secure server, and subsequently analyzed in the aggregate
without references to the identities of individual Twitter users.
All tweet records harvested for this work come from the Twitter streaming
“decahose”, a quasi-random sample of 10%[21] of all daily tweets, through the
OSOME service[11]. The user profiles are held in the “user” object within each
tweet’s JSON record provided, under the “description” field. Bots are removed
from this sample using Botometer[22, 2], a service which examines an account’s
content and other meta-data arriving at an accurate estimation of its probability
of being a bot or a person. After consultation with the creators of Botometer,
standard practice is to classify any user with a score > 0.5 as a bot (score ranges
from 0 to 1). To increase our accuracy, we consider any user with an English
bot score > 0.4 to be a bot.
Of great importance is the difference between the timing of the tweet record
and the timing of the profile description provided within the tweet record.
Specifically, the tweet provides exact timing information of the tweet itself,
but only an upper bound for the timing of profile description creation. Any
user can alter their profile description at any time, and the change is not repre-
sented in API-derived data until the next time that user tweets and the tweet
is provided in the streaming sample. We are interested in a cohort of users who
actively maintain their profiles. Therefore, we sort all tweets harvested for a
user chronologically, then retain only tweet objects where the profile changes
from the one harvested before (via difference of token sets). This necessarily
excludes the earliest profile description harvested for any user, and establishes
that all subsequent profiles were edited and therefore actively maintained in the
given period of time.
We apply the following methodology to create our user sample: we pre-
11screen existing decahose samples from 2012, 2013, and 2014 for users exhibiting
active profile maintenance, defined as at least one profile edit within each year,
producing an initial user pool of 10,737,093. Using Botometer scores we exclude
users with bot scores higher than the mentioned conservative threshold (based
on their latest 3,200 tweets up to Fall 2019), producing an potential user pool
of over 4,755,274. We then harvest the decahose tweets of these same users
occurring from August 2017 through December 2019, creating 2,089,173 user
profile change timelines derived from their retrieved tweets. Of these, 1,972,863
have only English as their specified language in their user metadata. 347,252
of these users have profiles containing hashtags, and 121,084 have timelines
certain to lie in 2017-08-01 through 2020-12-31 after discarding their initial
profile description (described above). Furthermore, we exclude organization
accounts marked by the Humanizr classifier[23], retaining 113,034 user accounts
that were not deemed organizational but belonging to individuals, then create
a graph with the remaining 89,647 users who share at least one hashtag with
another user. The final cohort contains the 85,839 users retained after removing
those sharing hashtags with only a single other user.
We create a graph model G, with the vertex set denoting users and an
adjacency matrix A representing edge weights between users. The edge weight
Aij for any connected pair of users (i, j) is the number of identical hashtags that
their profiles both contain. In addition, we recover which hashtags contribute
to each edge weight via the function T : (i, j) 7→ {φ : φ ∈ Φ}, mapping edges
to their associated subsets of hashtags within encompassing tag superset Φ. To
maximize alignment in shared identity held in the edge weights of G, we partition
the graph via modularity-maximization because of its focus on clusters with P high
edge concentration. Given edge weight Aij the degree of vertex i is ki = j Aij
k k
and modularity per edge Bij = Aij − 2m i j
. Using partition variable ci to label
vertex i with its cluster membership and Kronecker δij = 1 if ci = cj and 0
otherwise, total modularity of graph Q can be written[14]:
1 X 1 X
Q(B, c) = Bij δci ,cj − Bij (1 − δci ,cj )
4m ij 4m ij
X X
= qwithin (i, j, c) − qbetween (i, j, c). (1)
ij ij
Because δij = 1 only when both vertices i and j are within the same cluster,
the formulation of Eq. 1 emphasizes the positive contribution to modularity for
edges (i, j) within clusters vs. the negative contribution of edges between them.
This is an expression of the accumulation of modularity, or identity align-
ment, over each and every edge, given a partition c. But, edges are comprised
of identity labels, so we can re-frame the sum as an accumulation of modularity
over the identity labels present proportionally in each edge. In particular, we
can constrain the sum and consider the identity alignment contributed by only
a specific label if present in any edge. We define this alignment contribution by
label φ as
12X X
K(φ, B, c) = Tijφ qwithin (i, j, c) − Tijφ qbetween (i, j, c), (2)
ij ij
where Tijφ is the fraction of weight given to edge (i, j) by φ: Tijφ = |T (i, j) ∩
{φ}|/|T (i, j)|. Given a partition c into clusters that maximizes modularity Q, we
can find how much each hashtag φ contributes to Q of the entire graph using K.
We can also focus on a specific cluster, considering only edges with at least one
vertex belonging to that cluster. The hashtags with highest Kc calculated using
only this limited edge set are the ones most important to identity alignment
of the cluster of interest. The prototypical hashtags used to annotate specific
clusters throughout this work are those with highest Kc for the community c
being described. Force-directed layout of G and its presentation were produced
via Gephi software. We prune user vertices with degree 1 in the full user-user
network before applying the Louvain algorithm. The multiscale backbone was
calculated using a significance threshold α = 0.001[16].
In the main text we allude to the equivalence of MI(Zkl , V ) and Jensen-
Shannon divergence, which we show here. We have binary variable Zkl dis-
tinguishing outcomes from cluster k or not. In general, we can take a binary
Z ∼ Bernoulli(α), with outcomes {z0 , z1 }. We consider the probability of label v
given one outcome of Z as p(V = v|Z = z0 ) = p0 (v), written similarly for p(V =
v|Z = z1 ), with total probability for v ∈ V as p(v) = αp0 (v) + (1 − α)p1 (v).
Mutual information MI(Z, V ) = H(Z)−H(Z|V ), where PH refers to the Shannon
entropy. Starting with the second term, H(Z|V ) = − z,v p(z, v)log2 p(z|v) and
using identity p(z|v) = p(v|z)p(z)/p(v):
X p(v|z)p(z)
H(Z|V ) = − p(v|z)p(z)log2
z,v
p(v)
X p0 (v)
=−α p0 (v)log2 α
v
p(v)
X p1 (v)
− (1 − α) p1 (v)log2 (1 − α)
v
p(v)
= − αlog2 (α) − (1 − α)log2 (1 − α)
X p0 (v) X p1 (v)
−α p0 (v)log2 − (1 − α) p1 (v)log2 .
v
p(v) v
p(v)
The first two terms represent H(Z), so the original mutual information is equiv-
alent to the Jensen-Shannon Divergence (JSD):
MI(Z, V ) = JSD(p0 , p1 , α) = αKL(p0 |p) + (1 − α)KL(p1 |p),
where
P KL(p|q) is the relative entropy of probability mass functions p & q:
v p(v)log2 (p(v)/q(v)). Specifically for this case, the JSD is the expected rela-
tive entropy with respect to the total vocabulary distribution over both cluster
13and non-cluster sources weighted by the probability of observing the cluster it-
self, α. We elect to embody an unbiased observation approaching this identity
landscape with no knowledge of how prominent any identity cluster is. Then,
Zkl is uniform, i.e. α = 21 [24, 20, 17, 19].
References
[1] De Kosnik, A. & Feldman, K. #identity: Hashtagging Race, Gender, Sex-
uality, and Nation (University of Michigan Press, 2019).
[2] Varol, O., Ferrara, E., Davis, C. A., Menczer, F. & Flammini, A. On-
line Human-Bot Interactions: Detection, Estimation, and Characterization
(2017).
[3] Conover, M. D., Ferrara, E., Menczer, F. & Flammini, A. The Digital
Evolution of Occupy Wall Street. PLoS ONE 8, e64679 (2013).
[4] Jackson, S. J., Bailey, M., Welles, B. F. & Lauren, G. #HashtagActivism:
Networks of Race and Gender Justice. The MIT Press (MIT Press, 2020).
[5] Fukuyama, F. Identity: The Demand for Dignity and the Politics of Re-
sentment (Farrar, Straus and Giroux, 2018).
[6] Comfort, N. How science has shifted our sense of identity. Nature 574,
167–170 (2019).
[7] Hogg, M. A., Terry, D. J. & White, K. M. A tale of two theories: A critical
comparison of identity theory with social identity theory. Social Psychology
Quarterly 255–269 (1995).
[8] Stets, J. E. & Burke, P. J. Identity theory and social identity theory. Social
Psychology Quarterly 224–237 (2000).
[9] Hogg, M. A. Chapter 5 Social Identity Theory (Stanford University Press,
2020).
[10] Chwe, M. S.-Y. Rational Ritual. Culture, Coordination, and Common
Knowledge (Princeton University Press, 2013).
[11] Davis, C. A. et al. OSoMe: the IUNI observatory on social media. PeerJ
Computer Science 2, e87–21 (2016).
[12] Ratkiewicz, J. et al. Truthy: Mapping the Spread of Astroturf in Microblog
Streams. In Proceedings of the 20th International Conference Companion
on World Wide Web, 249–252 (Association for Computing Machinery, New
York, NY, USA, 2011).
[13] Yang, K. C. et al. Arming the public with artificial intelligence to counter
social bots. Human Behavior and Emerging Technologies 1, 48–61 (2019).
14[14] Newman, M. E. J. Modularity and community structure in networks. Pro-
ceedings of the National Academy of Sciences 103, 8577–8582 (2006).
[15] Blondel, V. D., Guillaume, J.-L., Lambiotte, R. & Lefebvre, E. Fast un-
folding of communities in large networks. Journal of Statistical Mechanics:
Theory and Experiment 2008, P10008 (2008).
[16] Serrano, M. Á., Boguñá, M. & Vespignani, A. Extracting the multi-
scale backbone of complex weighted networks. Proceedings of the National
Academy of Sciences 106, 6483–6488 (2009).
[17] Klingenstein, S., Hitchcock, T. & DeDeo, S. The civilizing process in Lon-
don’s Old Bailey. Proceedings of the National Academy of Sciences 111,
9419–9424 (2014).
[18] Murdock, J., Allen, C. & DeDeo, S. Exploration and exploitation of Vic-
torian science in Darwin’s reading notebooks. Cognition 159, 117–126
(2017).
[19] Barron, A. T. J., Huang, J., Spang, R. L. & DeDeo, S. Individuals, institu-
tions, and innovation in the debates of the French Revolution. PNAS 115,
4607–4612 (2018).
[20] DeDeo, S., Hawkins, R. X. D., Klingenstein, S. & Hitchcock, T. Boot-
strap Methods for the Empirical Study of Decision-Making and Information
Flows in Social Systems. Entropy 15, 2246–2276 (2013).
[21] Pfeffer, M. K. . M. F., J. Tampering with twit-
ter’s sample api. EPJ Data Science 7 (2018). URL
https://doi.org/10.1140/epjds/s13688-018-0178-0.
[22] Davis, C. A., Varol, O., Ferrara, E., Flammini, A. & Menczer, F. BotOrNot.
In the 25th International Conference Companion, 273–274 (ACM Press,
New York, New York, USA, 2016).
[23] McCorriston, J., Jurgens, D. & Ruths, D. Organizations are users too:
Characterizing and detecting the presence of organizations on twitter. In
Proceedings of the 9th International AAAI Conference on Weblogs and So-
cial Media (ICWSM) (2015).
[24] Lin, J. Divergence measures based on the Shannon entropy. IEEE Trans-
actions on Information Theory 37, 145–151 (1991).
Acknowledgments A.T.J.B. and J.B. are grateful for support from the Na-
tional Science Foundation Social, Behavioral and Economic Sciences [SBE]
Grant 1636636. A.T.J.B. was partially funded by the National Science
Foundation NRT grant 1735095, “Interdisciplinary Training in Complex
Networks and Systems.” Any opinions, findings, and conclusions or rec-
ommendations expressed in this material are those of the authors and do
not necessarily reflect the views of the National Science Foundation.
15Contributions A.T.J.B. and J.B. defined the research methodology. A.T.J.B.
collected the data and performed the analyses. A.T.J.B. and J.B. inter-
preted the results and co-authored the manuscript text.
Competing Interests The authors declare that they have no competing fi-
nancial interests.
Correspondence Correspondence and requests for materials should be ad-
dressed to A.T.J.B. (email: atbarron@iu.edu).
16Supplementary Files
This is a list of supplementary les associated with this preprint. Click to download.
quantifyingcollectiveidentityfromselfde ninglabelsSciRepsubmitSI.pdfYou can also read