Racially Polarized Voting Analysis for the Virginia Redistricting Commission
←
→
Page content transcription
If your browser does not render page correctly, please read the page content below
Racially Polarized Voting Analysis
                        for the Virginia Redistricting Commission

                                    Maxwell Palmer and Benjamin Schneer

                                                         8/31/2021

Executive Summary
We analyzed racially polarized voting (RPV) in Virginia using recent statewide elections. We find that while
there is evidence of racially polarized voting in Virginia at the state level, there is significant variation in the
level of polarization, including geographic areas where voting is not polarized. Minority voters, including
African American, Hispanic, and Asian voters, vote cohesively for Democratic candidates. On the other hand,
support for Democratic candidates by White voters varies across the state. Areas with no or very low levels
of racially polarized voting include much of Northern Virginia and parts of Central Virginia and Hampton
Roads.

What is Racially Polarized Voting?
The landmark case Thornburg v. Gingles set forth a three-part test to determine violations of Section 2 of
the Voting Rights Act due to vote dilution. Section 2 prohibits voting practices that deny groups of citizens
an equal opportunity to elect candidates of their choice, and, post Thornburg v. Gingles, Section 2 challenges
must show “(a) that the minority group at issue is ‘sufficiently large and geographically compact to constitute
a majority in a single member district,’ (b) that the minority group is ‘politically cohesive,’ and (c) that the
surrounding majority group usually votes as a bloc to defeat the minority’s preferred candidate.”1
In this report, our concern is not with vote dilution in general but rather with racially polarized voting, which
could be said to comprise parts (b) and (c) of the above test. Racially polarized voting (RPV) occurs when the
majority group and a minority group vote differently, for example when “Black voters and White voters vote
differently.”2 Importantly, all that RPV requires is for a racial minority to systematically prefer one candidate
while a majority group prefers another — this can and does occur without any racially discriminatory intent
on the part of voters, officials or anyone else.
In practice, identifying RPV will amount to answering two key questions. First, is each group of interest
cohesive in their voting behavior? To determine this, we identify whether clear majorities of a minority
group support the same candidate — that is, we seek to determine if the minority group(s) of interest in a
geographic location have a candidate of choice.
Second, conditional on the existence of a candidate of choice for Minority voters, do White voters support or
oppose this candidate and to what extent are they cohesive in doing so?
Given these questions, efforts to identify the extent of RPV in the Commonwealth of Virginia require
understanding how different racial groups vote. In a world without secret ballots, such an effort would be
   1 Yishaiya Abosch, Matt A. Barreto, and Nathan D. Woods, “An Assessment of Racially Polarized Voting for and against

Latino Candidates in California,” Voting Rights Act Reauthorization of 2006: Perspectives on Democracy, Participation, and
Power, (2007): p. 108.
   2 See Bernard Grofman, “Multivariate Methods and the Analysis of Racially Polarized Voting: Pitfalls in the Use of Social

Science by the Courts,” Social Science Quarterly 72, no. 4 (1991): p. 827. This is itself a quote from Thornburg v. Gingles at 53
n. 21.

                                                               1
straightforward; we could simply tally up candidate totals by voters’ race for the state and for any geographic
regions we chose. However, because under a secret ballot we do not observe individual vote choices we
must instead estimate group-level voting behavior from the available aggregate-level data from precincts and
localities.
To estimate group-level voting behavior from aggregate vote and population totals in precincts, we employ
ecological inference (EI), a well-known and widely accepted statistical method.3 We use ecological inference
techniques to estimate the share of each ethnic group that votes for each candidate (and we account for but
do not report the share of each group that votes, e.g., turnout).4

How to Use This Analysis
Below, we discuss the data used in this analysis and then present key results. We begin with statewide
results, and then show variation across Virginia by region, congressional district, state legislative district, and
locality. Our complete results, including for individual districts not shown in this report, are included in a
supplementary data file.
This report and the supplementary data can be used to identify where there is racially polarized voting across
the Commonwealth of Virginia. This can be useful when drawing minority opportunity districts. In places
with high levels of racially polarized voting, a larger minority population may be needed in order to create
a district where the minority group can successfully elect their candidates of choice. In contrast, in places
where there are low levels of racially polarized voting, or where there is no racially polarized voting, the
minority group can be a smaller share of the district and still elect their candidates of choice.

Data Sources
To perform ecological inference for the RPV analysis, we draw upon two key sources of data: (1) Historical
election results recorded in each precinct, and (2) historical citizen voting age population (CVAP) data,
which allows us to ascertain the composition of the population in each precinct. Due to changes to precinct
boundaries that occur over time, linking election results to precinct shape files can be time consuming and
difficult, and is not feasible in all cases.

Elections Data
We estimate ecological inference models using several different statewide elections at different levels of
geography, including by region, congressional district, state legislative district, and locality.5 We focus
primarily on the 2016 presidential election, the 2017 elections for governor, lieutenant governor, and attorney
general, and the 2018 election for U.S. Senate. We also include a more limited analysis of the 2020 presidential
and U.S. Senate elections. In addition to analyzing general election results, we also include the 2017
Democratic primary for lieutenant governor. Primaries can have limited utility for analyzing racially polarized
voting, because the existence of RPV in the primary does not mean that there is RPV in the general election,
and the lack of RPV in the primary also does not mean that there is not RPV in the general election.
Furthermore, the electorates in partisan primaries and in general elections are very different. However, the
presence of RPV in primaries may be useful to the Commission when considering different ways to draw
particular districts.
   3 GaryKing, A Solution to the Ecological Inference Problem (Princeton University Press, 2013).
   4 Formore details on ecological inference, see Appendix A.
   5 When estimating models at the district level, such as for a single congressional district, we use statewide election results,

but we only include precincts located in that particular district. This allows for comparability across districts, because the
candidates are the same in each model.

                                                                2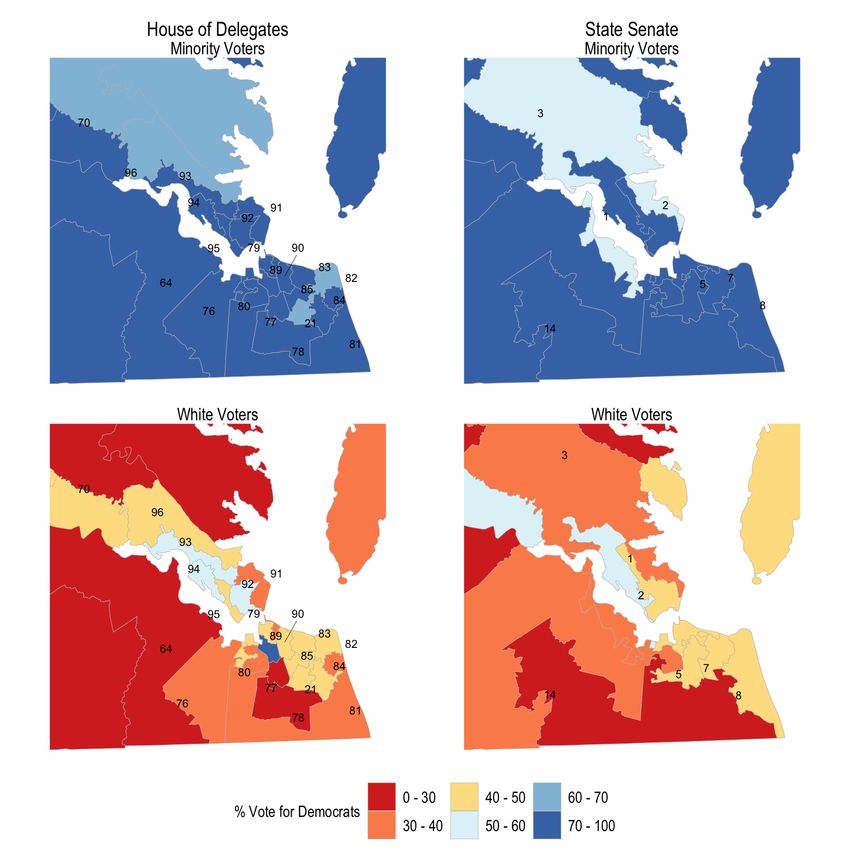
For the 20166 , 20177 , and 20188 elections, we use precinct-level election results and shape files from the
Voting and Election Science Team (VEST). These files include general election results. To examine the
2017 Democratic Primary election, we obtained precinct-level primary election results from the Virginia
Department of Elections.9 Following the method used in the VEST data, we allocated absentee votes
(recorded only at the locality level) to precincts in proportion to the number of non-absentee votes cast in
each precinct. For 2020, in which we analyze results based on election totals at the locality level, we also
used data from the Virginia Department of Elections.10

Population Data
We use citizen voting age population (CVAP) data from the American Community Survey (ACS) to determine
population by race in each precinct.11 The ACS reports CVAP data by block-group, which we aggregate to
precincts for each year. For the 2020 elections, we use locality-level population data.
We define racial groups for our analysis in two ways. First, for statewide analyses, we include four different
racial/ethnic groups: White, Black, Hispanic, and Asian voters. The Hispanic group includes people of all
races who identify as Hispanic. Second, for regional and district-level analyses, we include only two groups:
White and Minority voters, where Minority includes all groups except non-Hispanic Whites.12

Racially Polarized Voting Results
At the state level, elections in Virginia exhibit consistent racially polarized voting. Figure 1, below, plots the
ecological inference results for five statewide elections. In the plot, the estimated level of support for the
Democratic candidate for each group is marked with a circle. The horizontal lines on either side of the circles
mark the bounds of the 95% confidence intervals, which reflect uncertainty in the estimate. We interpret
these plots in two steps. First, the cluster of points on the right side of the plot show that large majorities
of African American, Hispanic, and Asian voters supported the Democratic candidate in each election. For
example, in the 2016 presidential election, we estimate that about 92% of African American voters supported
Hillary Clinton. The results are similar across all five elections. This is evidence that African American,
Hispanic, and Asian voters have a clear candidate of choice in each election. Additionally, large majorities
of voters of all three groups support the same candidate in each election, indicating that these groups vote
together cohesively.
Second, we examine voting patterns among White voters. In each election, a minority of White voters
supported the Democratic candidate (the candidate of choice of African American, Hispanic, and Asian
voters), and a majority voted against this candidate and supported the Republican candidate. This is evidence
of racially polarized voting. However, it is also important to note the degree of opposition to the minority
groups’ candidate of choice in each election. In the 2016 presidential election, 36% of White voters supported
the Democratic candidate. In contrast, in the 2018 Senate election, 44% did so.
We now turn to racially polarized voting across different regions in Virginia. We present results for seven
of the eight regions defined by the Virginia Redistricting Commission.13 We exclude the Southwest region,
because it is more than 90% White.
   6 Voting and Election Science Team, 2018, “2016 Precinct-Level Election Results”, https://doi.org/10.7910/DVN/NH5S2I,

Harvard Dataverse, V67
   7 Voting and Election Science Team, 2019, “2017 Precinct-Level Election Results”, https://doi.org/10.7910/DVN/VNJAB1,

Harvard Dataverse, V5
   8 Voting and Election Science Team, 2019, “2018 Precinct-Level Election Results”, https://doi.org/10.7910/DVN/UBKYRU,

Harvard Dataverse, V45
   9 Virginia Department of Elections, Historical Election Results, available at https://apps.elections.virginia.gov/SBE_CSV/E

LECTIONS/ELECTIONRESULTS/
  10 We provide a full explanation for this approach later in our report.
  11 U.S. Census Bureau, 2021. “Citizen Voting Age Population by Race and Ethnicity”.
  12 Combining groups is necessary due to the small number of precincts in some districts, as well as the very small populations

of some racial/ethnic groups in many areas of the state.
  13 Virginia Redistricting Commission Public Hearings FAQs, p.4

                                                               3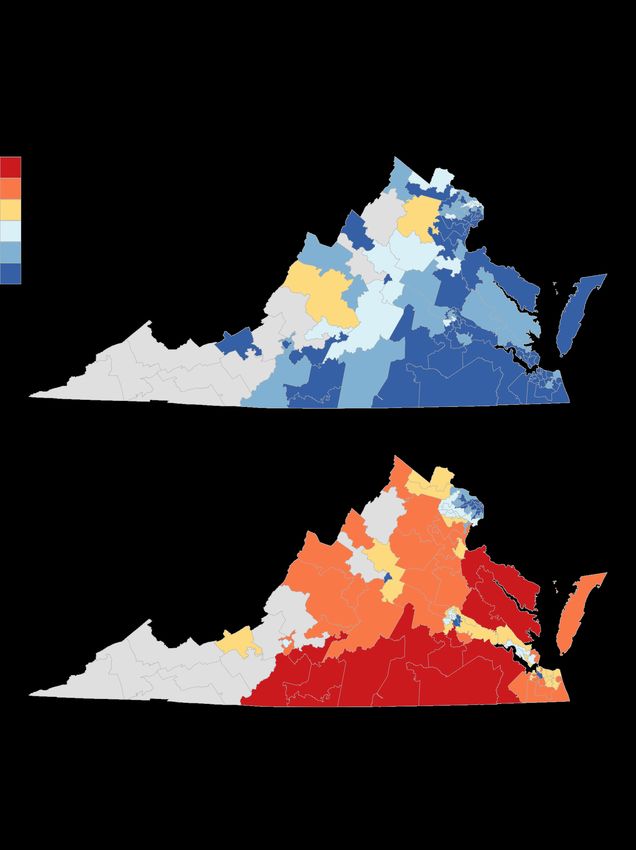
2016 President
  2017 Attorney General
         2017 Governor
      2017 Lt. Governor
      2018 U.S. Senate
                          0%                  25%                    50%                  75%                      100%
                                                                                          % Voting for Democratic Candidate

                                                                                      Asian    Black     Hispanic    White

                                  Figure 1: Ecological Inference Results — Statewide

Figure 2, below, presents two maps. The top map shows the average percentage of Minority voters supporting
the Democratic candidate across the 2016–2018 statewide elections. The bottom map shows the average
percentage of White voters supporting the Democratic candidate. Comparing the two maps illustrates where
there is racially polarized voting.14
First, the top map is uniformly blue, indicating that on average more than 70% of Minority voters supported
the Democratic candidate. This is evidence that Minority voters in every region have clear candidates of
choice, and are cohesive in supporting these candidates.
In contrast, there is significant variation in the bottom map. We see very low levels of support for Democratic
candidates in the Eastern and Southside regions, low levels of support in the Valley, West Central, and
Hampton Roads regions, 40-50% support in the Central region, and 50-60% support in Northern Virginia.
This indicates that voters are not polarized in Northern Virginia, and only a small majority of White voters
support Republican candidates in the Central region.
We see a similar pattern when looking at results by Congressional District in Figure 3. Minority voters
consistently support Democratic candidates, but support from White voters varies. In the 1st, 5th, 6th, and
7th Districts, White voters support Democratic candidates with 30-40% of the vote. In contrast, in the 2nd,
3rd, 4th, and 10th Districts, White voters are close to split; they support Democratic candidates with 40-50%
of the vote. Finally, in the 8th and 11th Districts, a majority of White voters support Democratic candidates
and there is no evidence of racially polarized voting.15
Figure 4 and Figure 5 present average levels of support for Democratic candidates from Minority voters and
White voters by State Senate and House of Delegates districts. Appendix B provides zoomed-in maps focusing
on the districts in each region. As before, Minority voters consistently support Democratic candidates.
The maps of White voters, however, show variation in support for Minority-preferred candidates across the
legislative districts.16

  14 All maps in this report present the average results for the five statewide general elections included in this analysis. Results

for each individual election for each region or district are available in the supplementary data.
  15 We exclude the 9th Congressional District, which is more than 90% White.
  16 We exclude all districts that are more than 90% White.

                                                                 4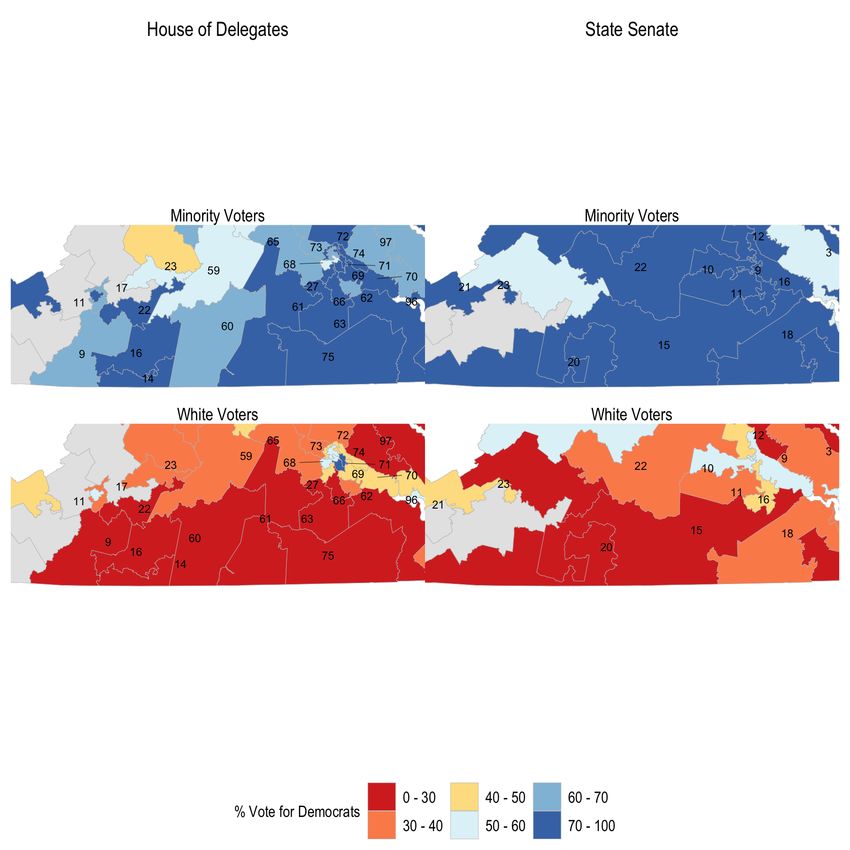
Figure 2: Ecological Inference Results — Regional

                       5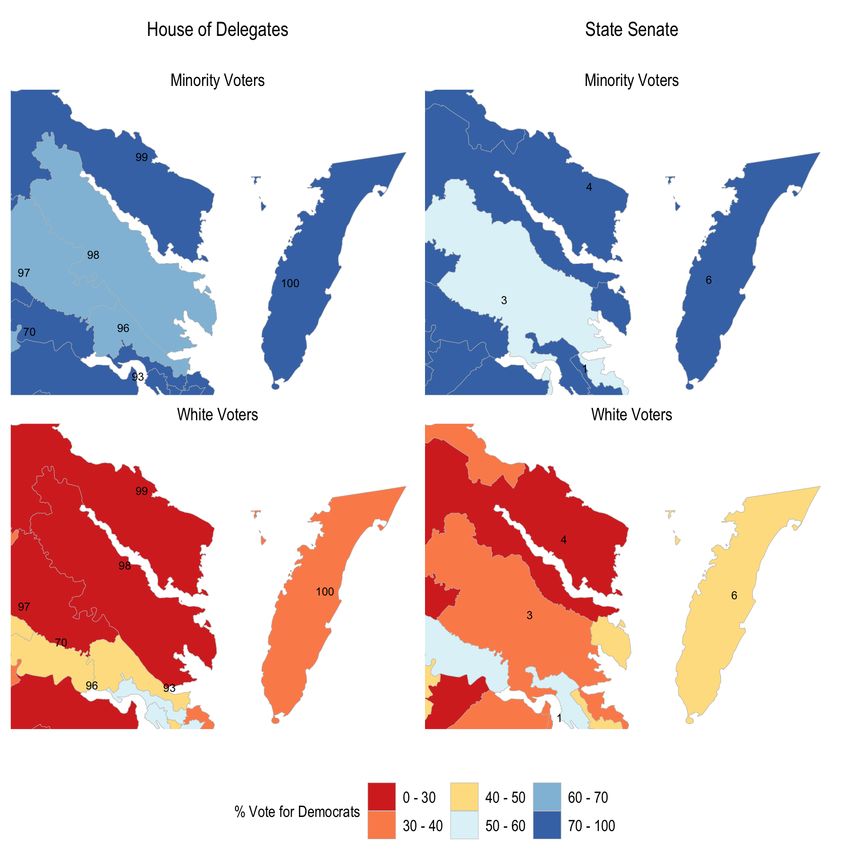
Figure 3: Ecological Inference Results — Congressional Districts

                               6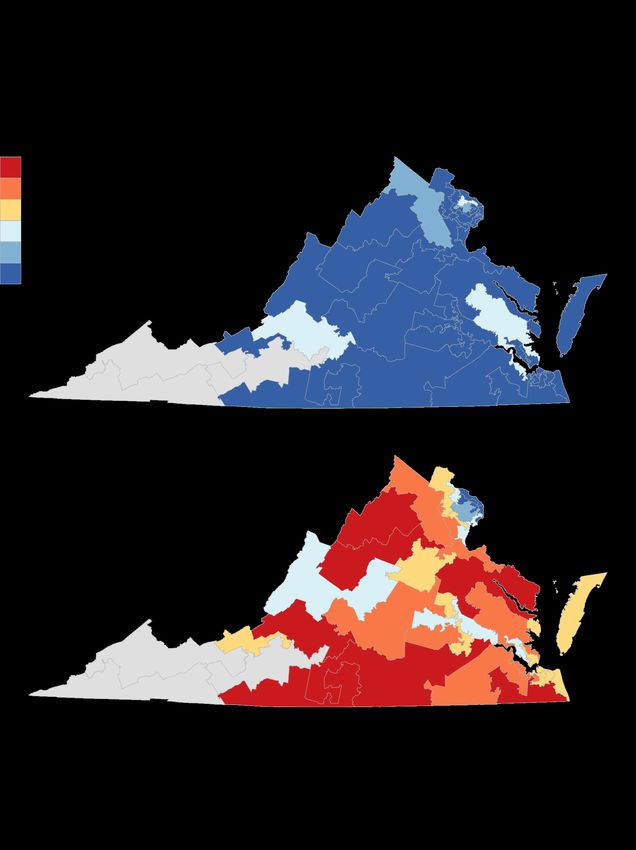
Figure 4: Ecological Inference Results — Senate Districts

                           7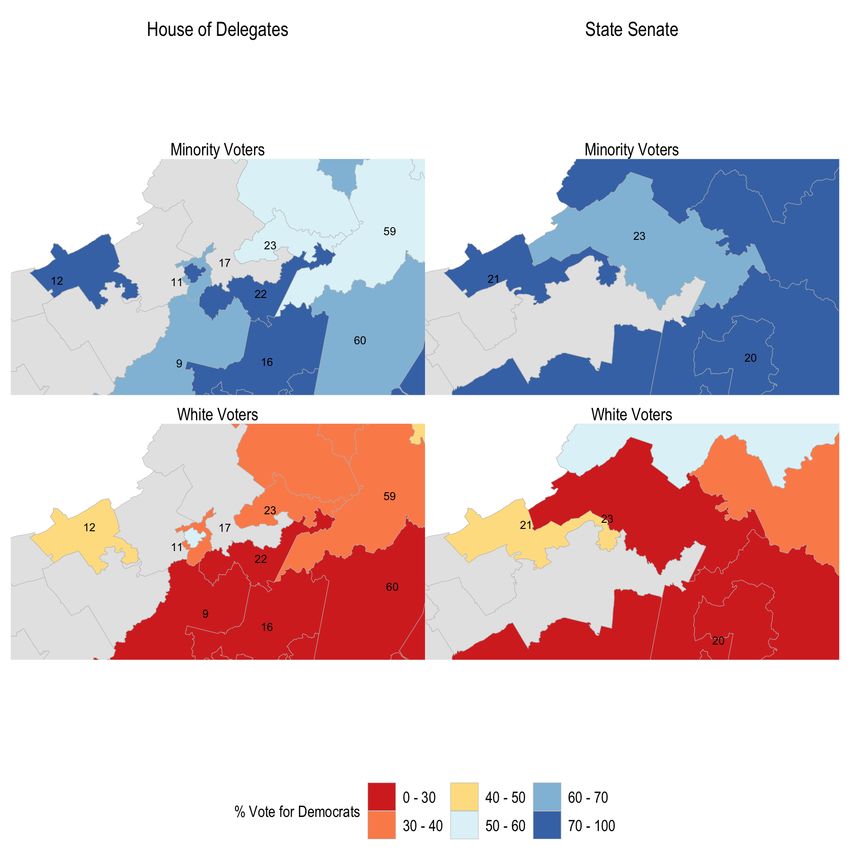
Figure 5: Ecological Inference Results — House Districts

                           8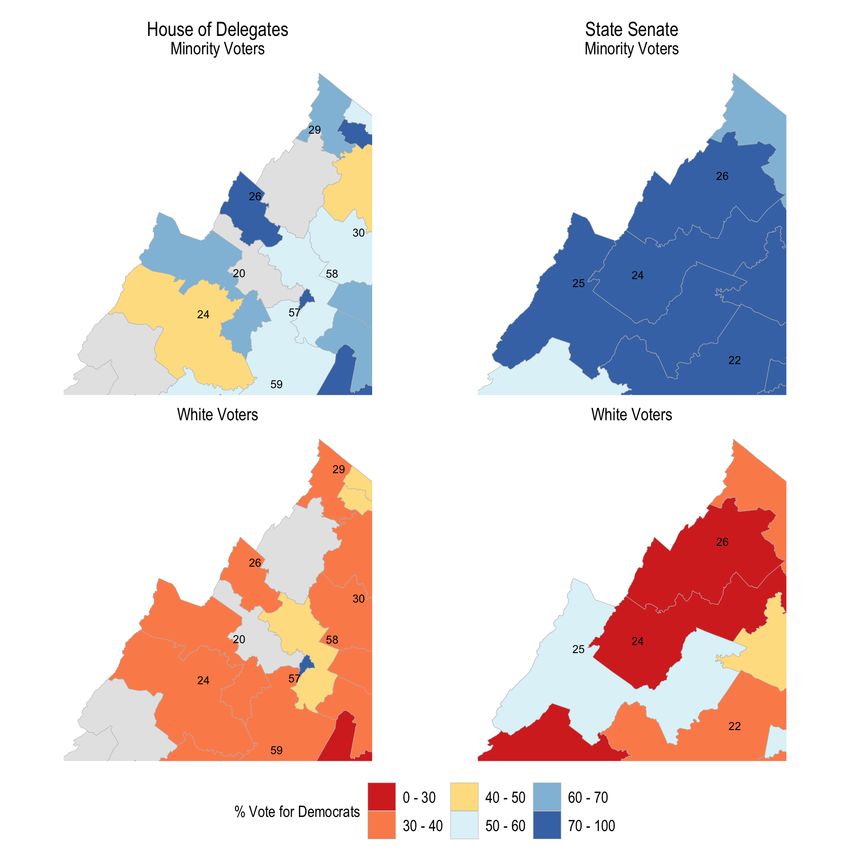
To more clearly illustrate the variation in racially polarized voting across the congressional and state state
legislative districts, we plot the average percentage of voters supporting the Democratic candidate across the
2016–2018 statewide elections in Figure 6, below, for each congressional district with at least 40% Minority
voting age population.17 As in Figure 1, the average estimate for each group is represented by a circle, and
the horizontal lines on either side indicate a 95% confidence interval reflected uncertainty in the estimate.
For the congressional districts, the plot shows that majorities of Minority and White voters in districts 8
and 11 both supported the Democratic candidate. In contrast, in districts 3, 4, and 10, there is evidence of
somewhat racially polarized voting as a majority of White voters opposed the Minority candidate of choice.

                          Figure 6: Ecological Inference Results — Congressional Districts

Figure 7 shows the same results for State Senate districts. For many of the estimates, the error bars here are
much larger, and in some cases as so wide that it is hard to say anything meaningful about polarization in
the district. This is due to the smaller number of precincts in each district or the distribution of Minority
voters within the district. For example, in District 35, the confidence interval for Minority voters is very wide.
However, the confidence interval from White voters is narrower and above 50%, indicating that a majority of
White voters supported the Democratic candidate in that district. In Districts 30 and 39, we estimate that
majorities of both groups support Democratic candidates, indicating no racially polarized voting. In Districts
33, 9, 36, 1, 29, 13, 6, 7, 5, 16, and 2, a clear majority of Minority voters support the Democratic candidate,
but the confidence interval for White voters spans across 50%. We cannot draw a confident conclusion about
the level of racially polarized voting in these districts from this election. Finally, in District 18, we see clear
evidence of racially polarized voting.
We see similar patterns in the results for House of Delegates districts in Figure 8. In some districts, such as
71, 69, 89, and 44, we see clear evidence that majorities of both groups support Democratic candidates. In
most of the other districts in the top and middle part of the figure, the confidence intervals are too broad to
draw a conclusion about racially polarized voting in the districts. For most of the districts at the bottom of
the figure, we see evidence of racially polarized voting.
Finally, Figure 9 shows the same analysis for localities with at least 30 precincts and at least 20% Minority
voting age population. Across all localities in the figure, we see that a large majority of Minority voters
support the Democratic candidate. In Arlington County, Richmond City, and Fairfax County, a majority of
White voters also supported the Democratic candidate. In Norfolk City, Loudoun County, Hampton City,
Newport News City, Henrico County, Prince William County, and Portsmouth City, the confidence interval
for the percentage of White voters supporting the Democratic candidate spans the 50% line. In the remaining
localities in the lower past of the figure, majorities of White voters oppose the Minority candidate of choice,
 17 Voting   age population data from the 2020 Census. Results for all districts available in the supplementary data file.

                                                                9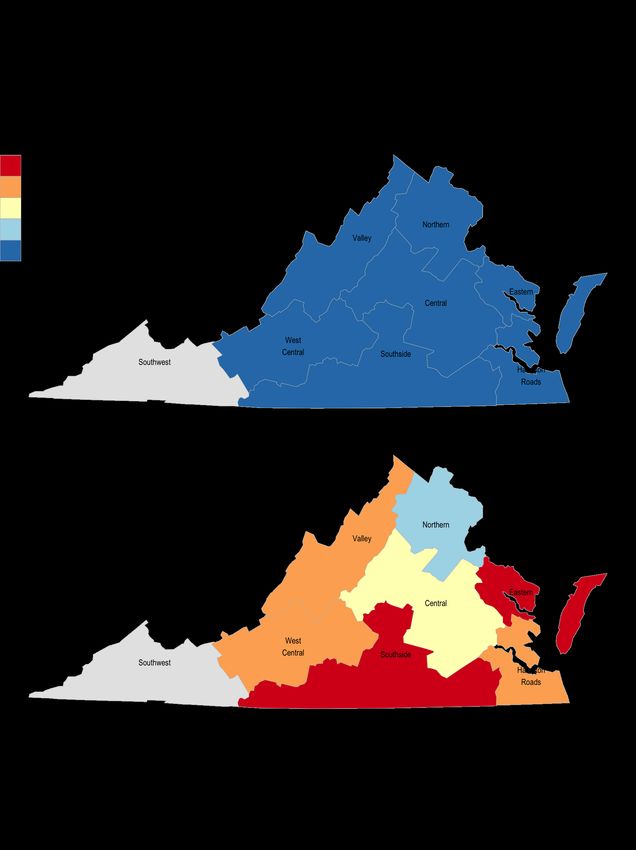
Figure 7: Ecological Inference Results — State Senate Districts

                              10
Figure 8: Ecological Inference Results — House of Delegates Districts
11indicating racially polarized voting, with the exception of Spotsylvania County where the confidence interval
for minority voters overlaps the 50% line.
Figure 9: Ecological Inference Results — Localities
122020 Election Results
The 2020 General Election in Virginia was unprecedented due to the share of voters who voted by mail rather
than at a polling place. From 2016 to 2018, an average of 12% of voters cast absentee ballots; in 2020 the
number was 63%.18 This presents a unique challenge for making sound ecological inferences because absentee
ballots in Virginia are tracked at the locality level rather than by precinct. As a result, we have much less
information available to us about the geographic patterns of voter turnout and vote choice for the 2020
election. Given these limitations, we present our estimates for 2020 separately and with a word of caution
that they contain additional uncertainties as compared to earlier years.
With less data available to us in 2020, we think it prudent to also estimate fewer parameters. We report
results only at the state-wide level and just using two racial groups: White and Minority voters. We estimate
that 64% of Minority voters supported the Democratic candidate in the presidential election. This is a large
enough margin to conclude that Minority voters at the state-wide level were relatively cohesive in their
support for the Democratic candidate. However, since 51% of White voters also voted for the Democratic
Candidate, Minority voters did not meaningfully oppose the candidate of choice among Minority voters.
There does not appear to be sufficient evidence to say that RPV occurred at the state-wide level in the 2020
Presidential Election.
For the 2020 Senate election, we estimate that 52% of White voters voted for the Democratic candidate
in the U.S. Senate election and that 67% of Minority voters did so. Again, a majority of both White and
Minority voters supported the Democratic candidate. Therefore, there is not sufficient evidence to conclude
the existence of RPV in the 2020 Senate election at the state-wide level.
However, we urge caution at interpreting these results as amounting to a change in patterns of racially
polarized voting at the state level when compared to earlier years. The use of locality-level data instead
of precinct-level data may hide important within-locality variation that could provide evidence of racially
polarized voting. Additionally, using this aggregate data prevents us from analyzing variation across the
state.
2020 President
2020 U.S. Senate
0% 25% 50% 75% 100%
% Voting for Democratic Candidate
Minority White
Figure 10: Ecological Inference Results 2020 General Election — Statewide
18 Calculated from Virginia Department of Elections Data using elections for President, U.S. Senate, and U.S. House.
132017 Primary Election Results
The 2017 Democratic Primary Election for Lieutenant Governor provides a unique opportunity to examine
RPV because it pitted a Black candidate, Justin Fairfax, against two White candidates, Susan Platt and
Gene Rossi, in an open-seat race. Fairfax ultimately won the primary election race with 49% of the vote.
Platt received 39% of the vote, and Rossi received 12%. This election allows us to analyze whether voter
preferences generally follow the same patterns in a Democratic primary with Black and White candidates.
We estimate that 67% of Black voters supported Fairfax in this election. In fact, at the state-wide level,
Black voters supported Fairfax at substantially higher rates than any other racial group did. Asian voters
also preferred Fairfax, with 49% supporting him in comparison with 42% support for Platt and the remainder
for Rossi.
2017 Lt. Gov Primary
0% 25% 50% 75% 100%
% Voting for Fairfax
White Black Hispanic Asian
Figure 11: Ecological Inference Results 2017 Democratic Primary Election — Statewide
When examining variation in support for Fairfax by region, Minority voters gave a plurality of their support
to Fairfax in every region, according to our estimates. Even in regions where less than 50% of Minority voters
supported Fairfax, these voters still supported Fairfax at a higher rate than either of the other two candidates.
In Hampton Roads, where the Minority population comprises slightly over 40% of the citizen-voting age
population, we estimate that Fairfax received 68% of the vote among Minority voters.
Central West Central
2017 Lt. Gov Primary
Southside Hampton Roads
2017 Lt. Gov Primary
Eastern Southwest
2017 Lt. Gov Primary
Northern Valley
2017 Lt. Gov Primary
0% 25% 50% 75% 100% 0% 25% 50% 75% 100%
% Voting for Fairfax
White Minority
Figure 12: Ecological Inference Results 2017 Democratic Primary Election — Regions
14Appendix A
Ecological inference combines the method of bounds,19 which produces deterministic bounds on the share
of a minority group voting for a given representative, and ecological regression,20 which makes use of how
candidate support across precincts varies with a racial group’s population share. Ecological inference stands
out as a method that incorporates both deterministic information (e.g., from method of bounds) as well as
statistical information (e.g., from ecological regression) when seeking to estimate group-level voting behavior
from aggregate data.
There are several different methods for estimating racially polarized voting using ecological inference. We
use the RxC method, which allows us to estimate voting patterns for multiple groups (such as White,
Black, Hispanic, and Asian voters) and actions (such as voting for the Democratic candidate, voting for the
Republican candidate, or not turning out to vote).
An example helps illustrate the utility of ecological inference for determining RPV. Table 1 reports the
state-wide citizen voting age population shares (CVAP) in Virginia along with the aggregate two-party vote
share for the 2016 Presidential Election. For 2016, in each locality we observe aggregate vote shares and
aggregate population shares (e.g., the bottom-most row and right-most columns in the table), but not the
group level voting behaviors (e.g., the interior cells in the table). We use ecological inference to estimate the
interior cells. With these group-level estimates in hand, we are in a position to evaluate the extent of RPV
for the 2016 Presidential Election in Virginia.
Table 1: Virginia 2016 Presidential Election Ecological Inference,
Two-Party Vote Shares
D R CVAP Pct.
White 36.3% 63.7% 70.7%
Black 92.2% 7.8% 19.4%
Hispanic 90.0% 10.0% 5.2%
Asian 94.3% 5.7% 4.7%
Total 52.8% 47.2%
We estimate that 92% of Black voters voted for Hillary Clinton, the Democratic candidate in the election.
Given the high level of support for the candidate, it would appear non-controversial to say that Clinton
was the candidate of choice for Black voters in Virginia in the 2016 Presidential election. Furthermore, the
high degree of support for this candidate among Black voters would suggest cohesion. Among White voters,
we estimate that 36% supported Clinton and 64% supported Trump. While in general RPV should not be
thought of in binary or absolute terms, the gap in this example between the behavior of Black and Minority
voters is sufficiently large as to suggest evidence of racially polarized voting at the state-wide level in this
election.21
19 OtisDudley Duncan and Beverly Davis. “An alternative to ecological correlation.” American sociological review (1953).
20 Leo A. Goodman, “Some alternatives to ecological correlation.” American Journal of Sociology 64, no. 6 (1959): 610-625.
21 Each of these estimates have confidence intervals only a few percentage points wide. For sake of clarity, we do not report the
95% confidence intervals in this table. They are (91%, 93%) for Black voters and (36%, 38%) for Minority voters.
15Appendix B
Northern Region
Figure 13: Ecological Inference Results — Northern Region
16Valley Region
Figure 14: Ecological Inference Results — Valley Region
17Central Region
Figure 15: Ecological Inference Results — Central Region
18Eastern Region
Figure 16: Ecological Inference Results — Eastern Region
19Hampton Roads Region
Figure 17: Ecological Inference Results — Hampton Roads Region
20Southside Region
Figure 18: Ecological Inference Results — Southside Region
21West Central Region
Figure 19: Ecological Inference Results — West Central Region
22Southwest Region
Figure 20: Ecological Inference Results — Southwest Region
23You can also read