35th INTERNATIONAL COTTON CONFERENCE BREMEN 2021
←
→
Page content transcription
If your browser does not render page correctly, please read the page content below

35th INTERNATIONAL COTTON CONFERENCE BREMEN 2021

                                                     PRESENTATION + PAPER

Session:          Cotton – a Wider View (C3)

Title:            A Technical & Financial Comparison of Machine and Hand Harvested Cottons
                  in the Manufacture of Knitted Garments

Author:           Roger Gilmartin, Cotton Council International, USA

Presentations are available on the conference archive: https://baumwollboerse.de/en/cotton-conference/lectures/
Conference Organization
Faserinstitut Bremen e.V., Bremen, Germany. E-Mail: conference@faserinstitut.de
Bremer Baumwollboerse, Bremen, Germany. E-Mail: info@baumwollboerse.de
A Technical & Financial
Comparison of Machine and Hand
   Harvested Cottons in the
Manufacture of Knitted Garments
  Roger Gilmartin, Special Advisor, CCI

    International Cotton Conference
       Bremen, 17–18 March, 2021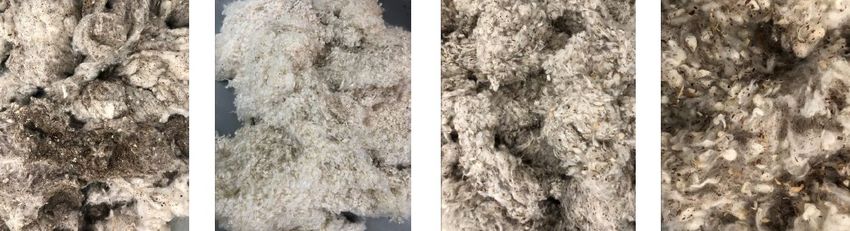
Introduction

 o Cotton Council International (CCI), the export promotion arm of the National
   Cotton Council of America (NCC), is a non-profit trade association that promotes
   U.S. cotton fibre and manufactured cotton products around the globe with the
   COTTON USA Trademark.
 o Every year we commission research projects to
   investigate aspects of US cotton that our customers
   have raised with us during our mill visits or during
   the various promotional events that we hold in our
   main markets.
 o We always have these projects undertaken by
   reputable, independent, third party, textile industry
   consultants.
Introduction

 o We often hear complaints from our customers
   about the high content of Neps that they find in   Mecha-
   their deliveries of US Upland cotton.              nical
 o Last year, one of the projects we commissioned     neps
   was to look in more detail at the technical impact
   that Neps, both biological and mechanical, have in
   the manufacture of both carded and combed
   yarns and their transformation into dyed, knitted
   garments.                                            Seed
                                                      coat
                                                      neps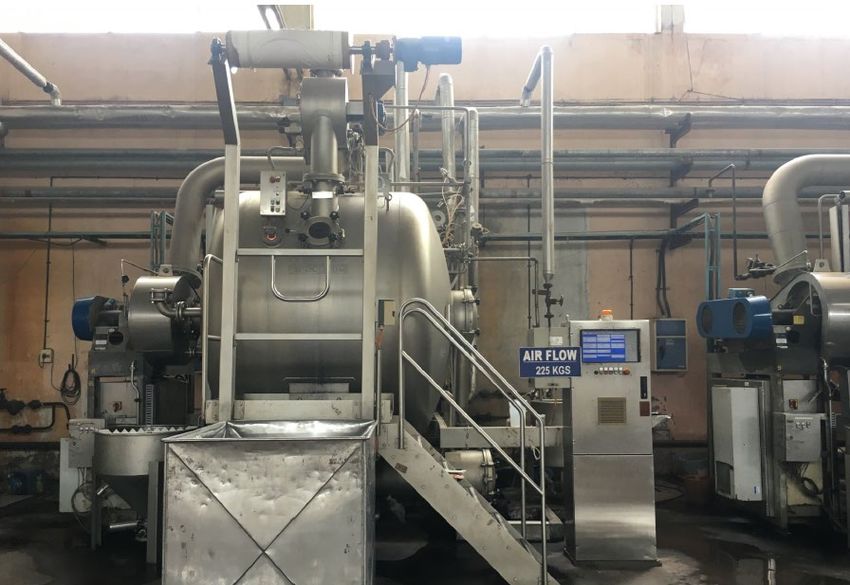
Introduction
o Previous independent research projects had demonstrated
  the technical and financial advantages of using US Upland
  cotton in the manufacture of high quality knitted garments.
o In last year’s study we wanted to take that earlier work and
  go deeper into the impact that neps have on yarn and
  fabric quality and indirectly highlight the impact of neps
  created due to harvesting systems (machine versus manual
  picking) and ginning methods (Roller and saw ginning).
o The consultants compared cotton from four different
  origins in their study, US, Sankar 6 from India, Brazil and
  West African PLEBE.

Introduction

 Indian and
 West African                             Brazil and
 cottons                        Project   US cottons
                              conducted
                               in India
 West                                                  Less aggressively
 African,        Normally                 Indian       roller-ginned –
 Brazilian and   saw-ginned               cottons      fewer Neps than
 US cottons                                            saw-ginned.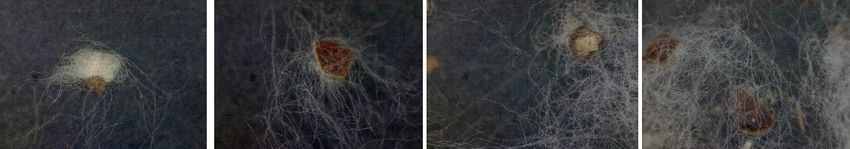
Introduction
o Yarn manufacturing took place at a large, well-established mill producing high
  quality carded and combed, compact spun ring yarns.

                                                                  Combing
  Carding
                                                                  machine
  machine

o The processes from knitting to garment manufacturing were monitored at one
  of the yarn mill’s customers producing high quality knitted garments.
o Both companies were considered leaders in their fields.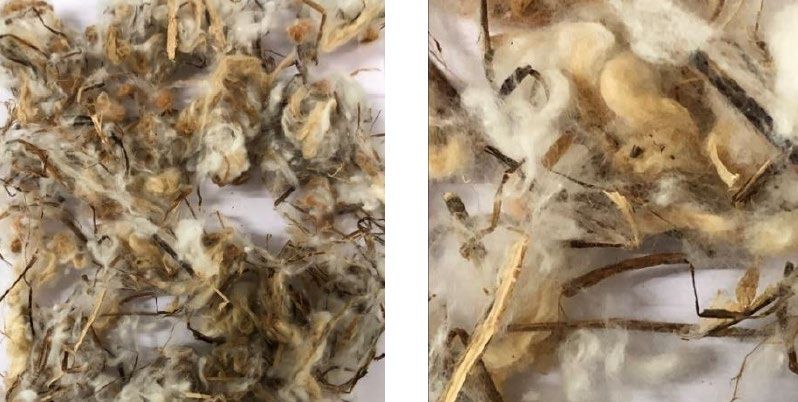
Methodology

         Research      High quality work
      conducted by
     team of senior
       consultants
    PT Sriwijaya Tex
    Tech Solution of
        Indonesia      Well known to CCI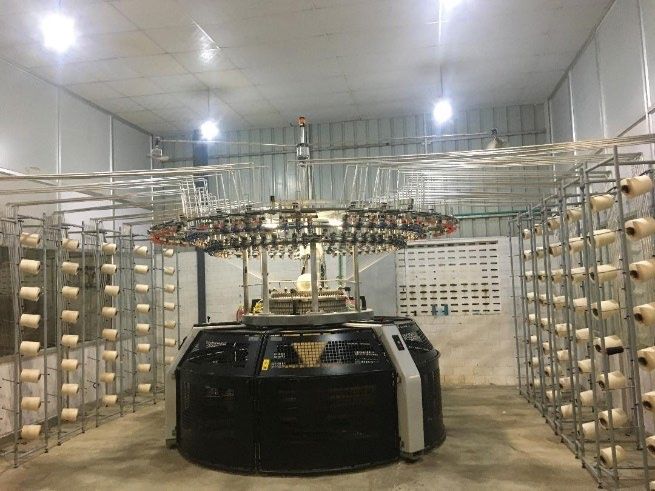
Methodology

                     Consultant’s report
 Technical data in
                     contained detailed
report personally                           Technical results
                     technical results of
   collected by                              then quantified
                      the performance
 consultants who                            financially based
                       of four cottons
  had monitored                              on true costs of
                     compared at every      the partner mills
and supervised all
                          process –          where research
     stages of
                        blowroom to            conducted.
  manufacturing
                           garment
     process.
                        manufacture.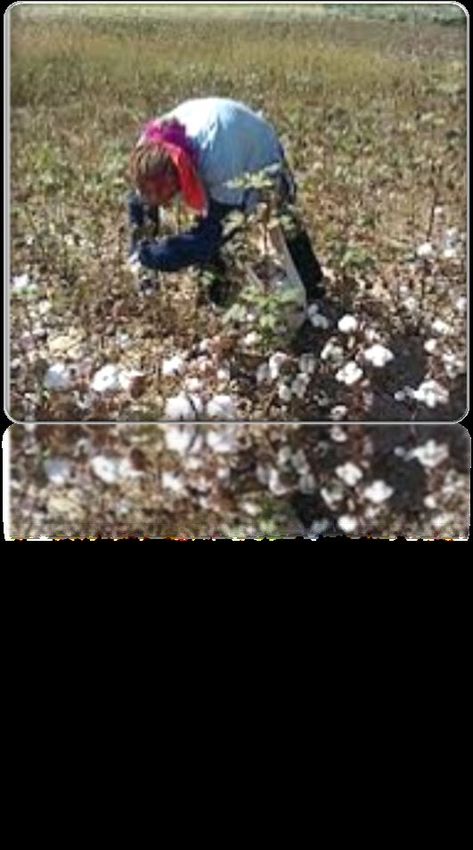
Yarn Manufacturing

o The cottons compared in the study were those used in regular production by the
  spinning partner, to spin carded and combed knitting yarns of count Ne 30/1,
  with the exception of the Brazilian fibre that was purchased especially by the
  partner for the trial.

o As expected, the Neps per gram and the SFC were higher in the three saw-
  ginned cottons (US/Brazil/W Africa) than the hand-harvested, roller-ginned
  Indian Sankar 6.
o In the blow-room and carding, the testing results showed that with the
  appropriate machine settings, all the Neps in the saw-ginned cottons were easily
  removed.
Yarn Manufacturing
  Description     IPI Value Origin     Description          IPI Value Origin
                    143     US                                 14     US
   Ne 30/1          194     W Africa     Ne 30/1               21     W Africa
 CARDED yarn        288     Brazil     COMBED yarn             16     Brazil
                    539     Sankar 6                           19     Sankar 6

                  11.38%    US           Consultants
                                         observed that
  Waste lost in
                  12.42%    W Africa     Brazilian cotton
 blow-room and
                                         contained a
    carding       15.48%    Brazil       high volume of
                  12.24%    Sankar 6     trash and bark
Yarn Manufacturing
W Africa
US Brazil Sankar 6 (Indian)
(PLEBE)
TRASH CONTENT 3.12% 2.82% 5.00% 3.38%
OVERALL CLEANING EFFICIENCY in the blow-room and carding ranged from 93.25% with
US cotton to a low of 82.4% with Brazilian cotton.
NEP REMOVAL
85.98% 80.43% 77.63% 69.13%
EFFICIENCY
SCN (Seed Coat Neps) REDUCTION in carding was also superior with all the saw-ginned
fibres:
90.77% 75.41% 86.44% 64.42%Yarn Manufacturing
W Africa Sankar 6
US Brazil
(PLEBE) (Indian)
With the same machine settings in COMBING, there was a significant difference in the
NOIL PERCENTAGES extracted from the four fibres:
13.90% 15.87% 18.13% 16.87%
SFCn REDUCTION
achieved during 55.80% 54.40% 51.20% 47.90%
combing
Even though the volume of mechanical Neps is higher in saw-ginned cottons, they are
easily removed in carding and combing and result in higher yarn quality as the
following yarn test results show.Yarn Manufacturing
o With the Ne 30/1 carded yarns, the IPI results achieved with US cotton were remarkable
considering that in the blow-room the US fibre had the highest Nep Count/g (324.13) of the
four cotton sources tested.
Cotton Cops - Neps +140%/km Total IPI Normal/km Results
US 626 US 143
W Africa PLEBE 713 W Africa PLEBE 194
Brazil 1141 Brazil 288
Indian Sankar 6 1642 Indian Sankar 6 539
o The total IPI normal/km results for the four cottons confirmed the superiority of the US
cotton.
o The US cops had a total IPI normal of 143 compared to the 539 for the hand-harvested,
gentler ginned Sankar 6.Yarn Manufacturing
o For many of the critical yarn quality parameters, the US yarn test results were below
the 5% curve on the 2018 Uster statistics for Ne 30/1 carded yarns.
o The Sankar 6 30/1 carded yarns were the equivalent of only 63% on the Uster curves.
o With the same count (Ne30/) combed yarns, for many of the tested parameters there
was no significant difference in the results for the Indian, West African and Brazilian
yarns. US 14
o The US combed yarn had the lowest Total IPI normal result BRAZIL 16
of the other fibres: SANKAR 6 19
PLEBE 21
o Once again, for many of the key parameters, the yarn test results for the US combed
cops placed them below the 5% curve on the Uster statistics compared to
approximately 20% for the other three cottons.Yarn Manufacturing
o In Winding, the clearer cuts per 100 kms in all Classimat Tests
categories were lower with the US cotton than Carded Yarn Results
any of the other fibres. US v. Competitors
o With the Ne 30/1 combed yarns, there was very
little difference in the cuts per 100km results +68%
between all four cottons.
o In the Classimat tests, on both the carded and US v
combed yarns, the US yarns performed Sankar
+48%
significantly better than the competitors, US v
+33%
especially on the carded yarns (see picture). Brazil
US v
o In the ring-frames, the consultants monitored
the performance of all four cottons in terms of PLEBE
end breaks per 1000 spindle hours and Pneumafil
waste percentages.Yarn Manufacturing
W Africa Sankar 6
US Brazil
(PLEBE) (Indian)
CARDED YARNS - end breaks 20.2 38.3 29.9 37.0
per 1000 spindle hours
Pneumafil waste recorded 0.15% 0.30% 0.25% 0.30%
COMBED YARNS - end breaks 32.0 42.5 49.9 54.0
per 1000 spindle hours
Pneumafil waste recorded 0.15% 0.35% 0.35% 0.40%Yarn Manufacturing o Finally, the results of the waste losses recorded by the consultants for both yarn types, carded and combed from bale to cop were: o The report confirmed that in almost every aspect of yarn manufacturing, the machine harvested, saw-ginned cotton out-performed the hand harvested, roller ginned fibre.
Knitting
o The single jersey fabrics chosen for the project were knitted on a circular weft
  knitting machine with the following specifications:
   • Diameter 32 inches
   • Gauge 28
   • Total Needles 2808
   • Number of Feeders 102
o For the trials:
   • The Fabric Width was 30 inches
   • The Loop Length was 27.5 cm
   • The machine speed was 39 rpm.
Knitting

o The consultants monitored the performance of the machine used for the
  knitting trials in terms of machine stops per roll of fabric produced, translated
  into stops per 100 kgs of yarn knitted for each of the four fibres.

      Stops per 100 kgs                       W Africa               Sankar 6
                                     US                     Brazil
      during knitting                         (PLEBE)                (Indian)
     Ne 30’s Carded yarn             4.5         9.4        19.3       10.8

     Combed yarns                    2.0         3.3        13.5        6.8
Knitting o The consultants commented that the majority of stops were caused by yarn breaking on the cones or by “fluff” (fibre loss) building up in the slub catchers on the machines. o They observed that the fibre loss with the US cotton was significantly less than the other three cottons although, with the exception of the Brazilian yarn, fibre loss in all the cottons during knitting was minimal, probably due to the yarns being Compact spun. o They commented that the majority of the Brazilian stops were caused by trash still present in the yarns. o The knitted, undyed fabric was inspected using the standard 4-point system based on frequency and size (diameter & length) of the defect.
Knitting

                                            W Africa            Sankar 6
     Greige Inspection Results       US                Brazil
                                            (PLEBE)             (Indian)
   CARDED YARNS - points per 100
                                     2.4      4.6       4.5       4.9
   square yards fabric knitted
   Translated into points per 100
                                     16.9     31.2     32.6       31.9
   kg of yarn knitted

   COMBED YARNS - points per
                                     1.3      1.7       5.2       2.6
   100 square yards fabric knitted
   Translated into points per 100
                                     9.7      11.7     36.6      18.2
   kg of yarn knitted
Dyeing & Finishing
o The consultants dyed 50% of the fabric knitted into a White
colour, 25% into Navy Blue and the remaining 25% into a Red White
shade. 50%
o The partner mill had installed Then Air Flow technology
machines from Fongs. Navy
o The fabrics were stentered, using the partner’s standard Blue
25%
settings for the fabric, on a Brückner machine.
o The dyed fabrics in all colours were examined using the Red
partner’s 4-point inspection system. shade
25%
o The fabrics were also tested for Shrinkage, Spirality, Colour
Fastness and the Delta-Values for each dye recipe.Dyeing & Finishing o The Partner’s 4-Point system graded any fabric with a points value of greater than 28 points per 100 square yards inspected as a REJECT. o None of the fabric processed from any of the four fibre sources failed the inspection process in any colour. The results were: 30’s Carded Red Fabric Results – Points per 100 sq yds US 1.92 Sankar 6 4.7 Brazil 5.3 PLEBE 16.65 30’s Carded Navy Blue Fabric Results – Points per 100 sq yds US 0 Sankar 6 12.9 Brazil 5.8 PLEBE 11.3 o Both the consultants and the Partner’s inspection teams commented on the low presence of Neps and “white spots” in the finished fabrics.
Dyeing & Finishing
The consultants took 25 square centimetre samples from each fabric and
physically counted the Neps and the White Spots in each sample. The results were:

                           US         W Africa (PLEBE)       Brazil      Sankar 6 (Indian)
WHITE Samples        3 Neps/0 Spots 6 Neps/0 Spots 4 Neps/0 Spots 5 Neps/0 Spots
RED Samples          3 Neps/0 Spots 24 Neps/0 Spots 5 Neps/0 Spots 20 Neps/1 Spot
NAVY BLUE Samples*    2 Neps/1 Spot 4 Neps/2 Spots 5 Neps/1 Spot 10 Neps/2 Spots
                  * Technically the most difficult of the three colours to dye and finish
o AS IN YARN MANUFACTURING, THE D&F RESULTS SHOWED THAT IN TERMS OF BOTH FABRIC
  QUALITY AND THE IMPACT OF NEPS, THE FABRICS KNITTED WITH MACHINE PICKED, SAW-
  GINNED COTTONS, OUTPERFORMED THE HAND-HARVESTED, ROLLER-GINNED INDIAN FIBRE.
Dyeing & Finishing
All four fibres met the Partner’s 5% Spirality and
Shrinkage standards.
The US cotton produced the best results in
both these tests.
The “Whiteness Index” results for all four fibres were
good.
There was no significant difference in the testing results
for Colour Fastness and the Delta-E values between any
of the four fibres being tested.Garment Manufacturing
o The consultants manufactured T-shirts produced with the carded and combed
yarns spun from each fibre source in White, Navy Blue and Red.
o For the partner mill, an important measure of performance is “Yarn to Garment
Realization” percentage.
o This is calculated by monitoring and measuring fibre loss from bale to garment.
“Yarn to Garment Realization” PercentageGarment Manufacturing o The consultants commented that poor Brazilian results with both carded and combed yarns was due mainly to the fibre losses during yarn manufacturing and knitting. o After their completion, all the garments produced during the trial were inspected to the partner’s normal quality standards. The partner had three grades of inspection, Pass, B Grade and Rejection.
Garment Manufacturing
o For Combed yarns, the percentage of garments that achieved a Pass level in all 3
  colours were:

o The consultants commented that the hand-harvested cottons, PLEBE and Sankar 6,
  contained very high levels of contamination in both carded and combed garments.
o The second most frequent cause of a B grade rating was thick and thin yarns.
o No garments in any of the four cottons were rejected or graded B for NEPS.
Financial Comparison

o For the four cottons compared in
  this study, the yarn manufacturing
  partner paid the following prices
  per pound in US dollars.
o Using the cost data of the two
  project partners, the consultants
  calculated the profit per garment
  generated by each of the four
  compared cottons.
Financial Comparison
o Based on an exchange rate of 1US$ to 74 Indian Rupees, the profit per garment
  in US dollars was:

       Carded Yarn Garments                    Combed Yarn Garments
Summary o In comparing the price of the local Sankar 6 cotton, with the price of the imported American fibre, it may surprise many members of today’s audience that the more expensive imported US cotton (8 US$ cents per pound higher) can produce a garment that generates more profit per garment for the manufacturer. o In the case of carded yarn garments, the profitability gap between the Sankar6 and the US garments is 9 US cents per garment. o The gap is even greater with combed yarn garments with a 22 US cents per garment advantage for the US. o Independent research sponsored by CCI over the last three years has consistently proved that the common practice of many mills to buy their cotton based on price is a huge mistake!
Summary
o Significantly, the consultant’s report has confirmed that although
  machine harvested, saw-ginned cottons have more Neps and a
  higher short fibre content than their gentler hand harvested, roller-
  ginned competitors, these negative characteristics have had NO
  IMPACT on down-stream processing or garment profitability.
o In this study, the hand-harvested, roller-ginned cotton has been
  OUTPERFORMED at every stage of processing and in every
  parameter monitored and measured by the consultants.
o AMONGST THESE MACHINE PICKED, SAW-GINNED RIVALS, THE ALL-
  ROUND PERFORMANCE OF THE US FIBRE HAS BEEN
  EXCEPTIONAL IN EVERY CATEGORY.
THANK YOU…

    …FOR YOUR KIND ATTENTION

                               33
A TECHNICAL & FINANCIAL COMPARISON OF MACHINE AND HAND HARVESTED COTTONS IN THE MANUFACTURE OF KNITTED GARMENTS R Gilmartin CText ATI, Manchester, England ABSTRACT CCI’s paper will present the results of a research project conducted by a team of independent, specialist, textile consultants commissioned by CCI last year (2020). The project’s primary objective was to evaluate the impact of Neps in US and Non- US cottons on the processing, quality and cost of ring spun yarns and knitted garments. The study was conducted with similar quality cottons from Brazil, India, West Africa and the USA. A secondary objective was to compare the performance of hand harvested, roller- ginned cottons with cottons that were machine picked and saw-ginned at all stages of the process, from bale to garment. Indian and West African cottons were selected for the hand harvested varieties, Brazilian and US fibres for machine picked cottons. The Indian cotton had been roller-ginned, the West African, Brazilian and US cottons saw-ginned. The research was carried out at two mills in the Indian sub-continent chosen by the consultants. For yarn manufacturing, they selected one of India’s leading spinning mills producing high quality yarns for both knitting and weaving. For the knitting to garment making segment of the project, they selected a company who was an important customer of their spinning mill partner producing high quality knitted garments with facilities for knitting, dyeing, printing and embroidery, as well as garment making. The project work itself was divided into two main parts. First, a technical evaluation covering all aspects of manufacturing from raw material testing, yarn manufacturing, knitting, dyeing and finishing through to final garment inspection. Then, a cost/benefit analysis of the performance of the four fibres to be compared. We will present from the consultant’s detailed and extensive 108-page report, the key data and information that support the observations and conclusions that we have drawn from the consultant’s work.
INTRODUCTION

Cotton Council International (CCI), the export promotion arm of the National Cotton
Council of America (NCC), is a non-profit trade association that promotes U.S. cotton
fibre and manufactured cotton products around the globe with the COTTON USATM
Trademark.

Every year we commission research projects to investigate aspects of US cotton that
our customers have raised with us during our mill visits or during the various
promotional events that we hold in our main markets. We always have these projects
undertaken by reputable, independent, third party, textile industry consultants.

We often hear complaints from our customers about the high content of Neps that
they find in their deliveries of US Upland cotton.

Last year, one of the projects we commissioned was to look in more detail at the
technical impact that Neps, both biological and mechanical, have in the manufacture
of both carded and combed yarns and their transformation into dyed, knitted
garments. (See examples of Neps Figure 1 and Figure 2.)

Figure 1 – Mechanical Neps removed from card waste samples

Figure 2 – Seed Coat Neps removed from waste samples

Previous independent research projects had demonstrated the technical and financial
advantages of using US Upland cotton in the manufacture of high quality knitted
garments.

In last year’s study we wanted to take that earlier work and go deeper into the impact
that Neps have on yarn and fabric quality and indirectly highlight the impact of Neps
created due to harvesting systems (machine versus manual picking) and ginning
methods (Roller and saw ginning).
The consultants compared cotton from four different origins in their study:

•   USA
•   India - Sankar 6
•   Brazil
•   West Africa - PLEBE

Indian and West African cottons are normally harvested by hand, Brazil and US
cottons are normally machine picked.

West African, Brazilian and US cottons are normally saw-ginned. Indian cottons are
less aggressively roller-ginned and should contain fewer Neps than the saw-ginned
varieties.

The project was conducted in India.

Yarn manufacturing took place at a large, well-established mill producing high quality
carded and combed, compact spun ring yarns.

The processes from knitting to garment manufacturing were monitored at one of the
yarn mill’s customers producing high quality knitted garments.

Both companies were considered leaders in their fields.

METHODOLOGY

The research was done by a team of senior consultants from PT Sriwijaya Tex Tech
Solution of Indonesia. Their quality of work and the members of their team were well
known to CCI. All the technical data contained in their report had been personally
collected by the consultants who had monitored and supervised all stages of the
manufacturing process.

The main body of the consultant’s report contained the detailed technical results of
the performance of each of four cottons being compared at every process, from blow-
room to garment manufacture.

The technical results were then quantified financially based on the true costs of the
partner mills where the research was conducted.

YARN MANUFACTURING

The cottons compared in the study were those used in regular production by the
spinning partner to spin carded and combed knitting yarns of count Ne 30/1, with
the exception of the Brazilian fibre that was purchased especially by the partner for
the trial.
As expected, the Neps per gram and the SFC were higher in the three saw-
ginned cottons (US/Brazil/W Africa) than the hand-harvested, roller-ginned
Indian Sankar 6.

In the blow-room and carding, the testing results showed that with the
appropriate machine settings, all the Neps in the saw-ginned cottons were
easily removed.

The IPI values of the Ne 30/1 Carded and Combed yarns spun are shown in Table I
and Table II below.

Table I

Description       IPI Value       Origin
                     143          US
 Ne 30/1             194          W Africa
 CARDED
 yarn                288          Brazil
                     539          Sankar 6

Table II

Description       IPI Value      Origin
                     14          US
 Ne 30/1
                     21          W Africa
 COMBED
 yarn                16          Brazil
                     19          Sankar 6

Machine settings in the blow-room and carding were identical for all the four cottons
being studied. Normally these would be fine-tuned to suit the fibre.

Waste lost in the blow-room and carding is shown in Table III.

Table III

                    11.38%      US
 Waste lost in      12.42%      W Africa
 Blow-room
 and Carding        15.48%      Brazil
                    12.24%      Sankar 6
Examples of Fine Cleaner waste are shown in Figure 3.
Figure 3
The consultants observed that the Brazilian cotton contained a high volume of trash
and bark. Examples of barks are shown in Figure 4.
Figure 4
The Trash content in each cotton was measured (see Table IV). The overall
cleaning efficiency in the blow-room and carding ranged from 93.25% with US
cotton to a low of 82.4% with Brazilian cotton. A Nep removal efficiency of 85.98%
was achieved with the US fibre. The SCN (Seed Coat Neps) reduction in carding was
also superior with all the saw-ginned fibres (See Table IV for details.)
Table IV
W Africa Sankar 6
US (PLEBE) Brazil (Indian)
Trash Content 3.12% 2.82% 5.00% 3.38%
Nep Removal Efficiency 85.98% 80.43% 77.63% 69.13%
SCN Reduction in Carding 90.77% 75.41% 86.44% 64.42%With the same machine settings in Combing, there was a significant difference in the
Noil percentages being extracted from the four fibres (see Table V), with Brazil
being the highest at 18.13%.
Table V
W Africa Sankar 6
US (PLEBE) Brazil (Indian)
Noil Percentages Extracted 13.90% 15.87% 18.13% 16.87%
SFCn Reduction achieved
55.80% 54.40% 51.20% 47.90%
during Combing
Even though the volume of mechanical Neps is higher in saw-ginned cottons, they
are easily removed in carding and combing and result in higher yarn quality as the
yarn test results in the following paragraphs show.
With the Ne 30/1 carded yarns, the IPI results achieved with US cotton were
remarkable considering that in the blow-room the US fibre had the highest Nep
Count/g (324.13) of the four cotton sources tested. (See Table VI).
Table VI
Cotton Cops - Neps +140%/km - Carded Yarn
US 626
W Africa PLEBE 713
Brazil 1141
Indian Sankar 6 1642
The total IPI normal/km results for the four cottons confirmed the superiority of
the US cotton. The US cops had a total IPI normal of 143 compared to 539 for the
hand-harvested, gentler ginned Sankar 6. (See Table VII.)
Table VII
Total IPI Normal/km Results
US 143
W Africa PLEBE 194
Brazil 288
Indian Sankar 6 539For many of the critical yarn quality parameters, the US yarn test results were below the 5% curve on the 2018 Uster statistics for Ne30/1 carded yarns. The Sankar 6 30/1 carded yarns were the equivalent of only 63% on the Uster curves. With the same count (Ne30/1) combed yarns, for many of the tested parameters there was no significant difference in the results for the Indian, West African and Brazilian yarns. The US combed yarn had the lowest Total IPI normal result of the other fibres, (see Table VIII). Table VIII Total IPI Normal/km Results – Combed Yarn US 14 W Africa PLEBE 21 Brazil 16 Indian Sankar 6 19 Once again, for many of the key parameters, the yarn test results for the US combed cops placed them below the 5% curve on the Uster statistics compared to approximately 20% for the other three cottons. In Winding, the clearer cuts per 100kms in all categories were lower with the US cotton than any of the other fibers. With the Ne 30/1 combed yarns, there was very little difference in the cuts per 100km results between all four cottons. In the Classimat tests, on both the carded and combed yarns, the US yarns performed significantly better than the competitors, especially on the carded yarns where the results were 33% lower than the PLEBE yarns, 48% lower than Brazil and 68% better than the Sankar 6. In the ring-frames, the consultants monitored the performance of all four cottons in terms of end breaks per 1000 spindle hours and Pneumafil waste percentages.
For carded and combed yarns the end breaks per 1000 spindle hours and the
Pneumafil waste were recorded as shown in Table IX below.

Table IX

                                                  W Africa                 Sankar 6
                                        US                      Brazil
                                                  (PLEBE)                  (Indian)
 CARDED YARNS - end breaks
                                       20.2         38.3         29.9          37
 per 1000 spindle hours
 Pneumafil waste recorded for
                                      0.15%        0.30%        0.25%        0.30%
 each cotton

 COMBED YARNS - end breaks
                                       32.0         42.5         49.9         54.0
 per 1000 spindle hours
 Pneumafil waste recorded for
                                      0.15%        0.35%        0.35%        0.40%
 each cotton

Finally, the results of the waste losses recorded by the consultants for both yarn
types, carded and combed from bale to cop were as shown in Table X and Table
XI.

Table X

 CARDED YARNS - YIELD % ACHIEVED

 US                               88.50%
 W Africa (PLEBE)                 87.20%
 Brazil                           84.70%
 Sankar 6 (Indian)                87.40%

Table XI

COMBED YARNS - YIELD % ACHIEVED

 US                               74.60%
 W Africa (PLEBE)                 71.30%
 Brazil                           66.10%
 Sankar 6 (Indian)                70.50%
The report confirmed that in almost every aspect of yarn manufacturing, the
machine harvested, saw-ginned cotton out-performed the hand harvested,
roller ginned fiber.
KNITTING
The single jersey fabrics chosen for the project were knitted on a circular weft knitting
machine with the following specifications:
• Diameter 32 inches
• Gauge 28
• Total Needles 2808
• Number of Feeders 102
For the trials:
• The Fabric Width was 30 inches
• The Loop Length was 27.5 cm
• The machine speed was 39 rpm.
The consultants monitored the performance of the machine used for the knitting trials
in terms of machine stops per roll of fabric produced, translated into stops per 100
kgs of yarn knitted for each of the four fibers (Table XII below).
Table XII
W Africa Sankar 6
US Brazil
(PLEBE) (Indian)
Ne 30's CARDED yarn, stops per 100
4.5 9.4 19.3 10.8
kgs during knitting
COMBED yarns - stops per 100 kgs 2.0 3.3 13.5 6.8
The consultants commented that the majority of stops were caused by yarn
breaking on the cones or by “fluff” (fiber loss) building up in the slub catchers on
the machines.
They observed that the fiber loss with the US cotton was significantly less than
the other three cottons although, with the exception of the Brazilian yarn, fiber loss in
all the cottons during knitting was minimal, probably due to the yarns being Compact
spun.They found that the majority of the Brazilian stops were caused by trash still
present in the yarns (an example is shown in Figure 6 below).
Figure 5
The knitted, undyed fabric was inspected using the standard 4-point system based
on frequency and size (diameter & length) of the defect.
For carded and combed yarns, the greige inspection results were as shown in Table
XIII below.
Table XIII
W Africa Sankar 6
GREIGE INSPECTION RESULTS US Brazil
(PLEBE) (Indian)
CARDED YARNS - points per 100
2.4 4.6 4.5 4.9
square yards fabric knitted
Translated into points per 100 kg of
16.9 31.2 32.6 31.9
yarn knitted
COMBED YARNS - points per 100
1.3 1.7 5.2 2.6
square yards fabric knitted
Translated into points per 100 kg of
9.7 11.7 36.6 18.2
yarn knitted
DYEING & FINISHING
The consultants dyed 50% of the fabric knitted into a White colour, 25% into Navy
Blue and the remaining 25% into a Red shade.
The partner mill had installed Then Air Flow technology machines from Fongs. The
fabrics were stentered, using the partner’s standard settings for the fabric, on a
Brückner machine. The dyed fabrics in all colours were examined using the partner’s4-point inspection system. The fabrics were also tested for Shrinkage, Spirality,
Colour Fastness and the Delta-Values for each dye recipe.
The Partner’s 4-Point system graded any fabric with a points value of greater
than 28 points per 100 square yards inspected as a reject.
None of the fabric processed from any of the four fiber sources failed the
inspection process in any colour. The results are shown in Table XIV.)
Table XIV
30's CARDED FABRIC RESULTS - POINTS PER 100 SQ YDS
W Africa Sankar 6
US Brazil
(PLEBE) (Indian)
RED Fabric 1.92 16.65 5.3 4.7
NAVY BLUE Fabric 0 11.30 5.8 12.9
Both the consultants and the Partner’s inspection teams commented on the
low presence of Neps and “white spots” in the finished fabrics.
The consultants took 25 square centimeter samples from each fabric and physically
counted the Neps and the White Spots in each sample. The results are shown in
Table XV.
Table XV
Sankar 6
US W Africa (PLEBE) Brazil
(Indian)
WHITE Samples 3 Neps/0 Spots 6 Neps/0 Spots 4 Neps/0 Spots 5 Neps/0 Spots
RED Samples 3 Neps/0 Spots 24 Neps/0 Spots 5 Neps/0 Spots 20 Neps/1 Spot
NAVY BLUE
2 Neps/1 Spot 4 Neps/2 Spots 5 Neps/1 Spot 10 Neps/2 Spots
Samples*
* Technically the most difficult of the three colours to dye and finish
As in Yarn Manufacturing, the D&F results showed that in terms of both fabric
quality and the negative impact of Neps, the fabrics knitted with machine
picked, saw-ginned cottons, outperformed the hand-harvested, roller-ginned
Indian fibre.
• All four fibers met the Partner’s 5% Spirality and Shrinkage standards.
• The US cotton produced the best results in both these tests.
• The “Whiteness Index” results for all four fibers were good.• There was no significant difference in the testing results for Colour Fastness and
the Delta-E values between any of the four fibers being tested.
GARMENT MANUFACTURING
The consultants manufactured T-shirts produced with the carded and combed yarns
spun from each fiber source in White, Navy Blue and Red. For the partner mill, an
important measure of performance is “Yarn to Garment Realization” percentage.
This is calculated by monitoring and measuring fiber loss from bale to garment.
The results obtained are shown in Figure 6 and Figure 7.
Figure 6
Figure 7
The consultants commented that poor Brazilian results with both carded and combed
yarns was due mainly to the fiber losses during yarn manufacturing and knitting.
After their completion, all the garments produced during the trial were inspected to
the partner’s normal quality standards. The partner had three grades of inspection,
Pass, B Grade and Rejection.The percentages of carded yarn garments graded as a Pass are shown in Table XVI
and the percentages of carded yarn garments rejected are shown in Table XVII.
Table XVI
%'s Carded Yarn Garments Passed
US 94.50%
Brazil 87.60%
Sankar 6 86.10%
PLEBE 79.10%
Table XVII
%'s Carded Yarn Garments Rejected
US 0.98%
Sankar 6 2.57%
Brazil 2.66%
PLEBE 3.18%
For Combed yarns, the percentage of garments that achieved a Pass level in all 3
colours are shown in Table XVIII.
Table XVIII
%'s Combed Yarn Garments Passed
(All 3 colours)
US 95.00%
Brazil 90.50%
PLEBE 79.64%
Sankar 6 75.40%The percentage of Combed yarn garments that were rejected are shown in Table
XIX.
Table XIX
%'s Combed Yarn Garments Rejected
US 0.95%
Brazil 2.76%
PLEBE 3.20%
Sankar 6 2.72%
The consultants commented that the hand-harvested cottons, PLEBE and Sankar
6, contained very high levels of contamination in both carded and combed
garments.
The second most frequent cause of a B grade rating was thick and thin yarns.
No garments in any of the four cottons were rejected or graded B for Neps.
FINANCIAL COMPARISON
For the four cottons compared in this study, the yarn manufacturing partner paid the
following prices per pound in US dollars:
US $0.79
PLEBE $0.78
Brazil $0.77
Sankar 6 $0.71
Using the cost data of the two project partners, the consultants calculated the profit
per garment generated by each of the four compared cottons. Based on an
exchange rate of 1US$ to 74 Indian Rupees, for the carded yarn garments, the
profit per garment is shown in Table XX.
Table XX
CARDED YARN GARMENTS
PROFIT PER GARMENT
US $0.75
Brazil $0.66
Sankar 6 $0.66
PLEBE $0.60For the combed yarn, the results are shown in Table XXI.
Table XXI
COMBED YARN GARMENTS
PROFIT PER GARMENT
US $0.88
Brazil $0.80
PLEBE $0.71
Sankar 6 $0.66
SUMMARY
In comparing the price of the local Sankar 6 cotton, with the price of the
imported American fiber, it may surprise many members of today’s audience
that the more expensive imported US cotton (8 US$ cents per pound higher)
can produce a garment that generates more profit per garment for the
manufacturer.
In the case of carded yarn garments, the profitability gap between the Sankar 6
and the US garments is 9 US cents per garment.
The gap is even greater with combed yarn garments with a 22 US cents per
garment advantage for the US.
Independent research sponsored by CCI over the last three years has
consistently proven that the common practice of many mills to buy their cotton
based on price is a huge mistake!
Significantly, the consultant’s report has confirmed that although machine
harvested, saw-ginned cottons have more Neps and a higher short fiber
content than their gentler hand harvested, roller-ginned competitors, these
negative characteristics have had NO IMPACT on down-stream processing or
garment profitability.
In this study, the hand-harvested, roller-ginned cotton has been
OUTPERFORMED at every stage of processing and in every parameter
monitored and measured by the consultants.
Amongst these machine picked, saw-ginned rivals, the all-round performance
of the US FIBRE HAS BEEN EXCEPTIONAL IN EVERY CATEGORY.You can also read