Rates continue to climb as the economy shows some slowing - September 2022 Housing market has weakened, but the Fed is unlikely to alter its rate ...
←
→
Page content transcription
If your browser does not render page correctly, please read the page content below
September 2022

Rates continue to
climb as the economy
shows some slowing
Housing market has weakened,
but the Fed is unlikely to alter
its rate tightening path

The market rally falters

History says to expect the
unexpected
Economic & Financial Market Monthly Review | September 2022

                           Economic Review
                           Housing market has weakened, but the Fed is unlikely to
           4               alter its rate tightening path
                           The economy continues to show signs of slowing with the housing market, which is on the front
                           lines as the Fed raises interest rates, leading the downtrend. Demand remains strong in many
                           industries, however, with payroll gains still far above the long-run average and inflation not in the
                           same ballpark as the Fed’s 2.0 percent goal — likely prompting another outsized rate hike by the
                           Fed this month

                           Financial Markets
           5               The market rally falters
                           After climbing by 17 percent from mid-June to mid-August, the S&P 500 index fell off sharply to
                           end August as recession concerns and expectations of higher interest rates rattled investors. No
                           market capitalization was spared from the markets’ wrath as almost all sectors except energy
                           fell. Fixed income investors also felt the pain as the Treasury yields across the curve spiked
                           again. The international story continues to be the strength of the dollar, which defied the recent
                           weakness in oil and is hurting U.S. exports.

                           The Outlook

           6               History says to expect the unexpected
                           Federal Reserve tightening cycles haven't always resulted in recessions, but they have in recent
                           decades invariably given rise to market strains that have often arisen unexpectedly. Similar
                           dislocations are likely as the Fed continues to push rates higher in this cycle, in turn eliciting a
                           less hawkish stance from the central bank itself.

           7-11            Charts & Commentaries

           12              Forecast

  Produced by Nationwide Economics
  Bryan Jordan, CFA                         Daniel Vielhaber, MA             Brian Kirk
  Deputy Chief Economist                    Economist                        Communications Consultant

  Ben Ayers, MS                             Scott Murray, CFA
  Senior Economist                          Financial Markets Economist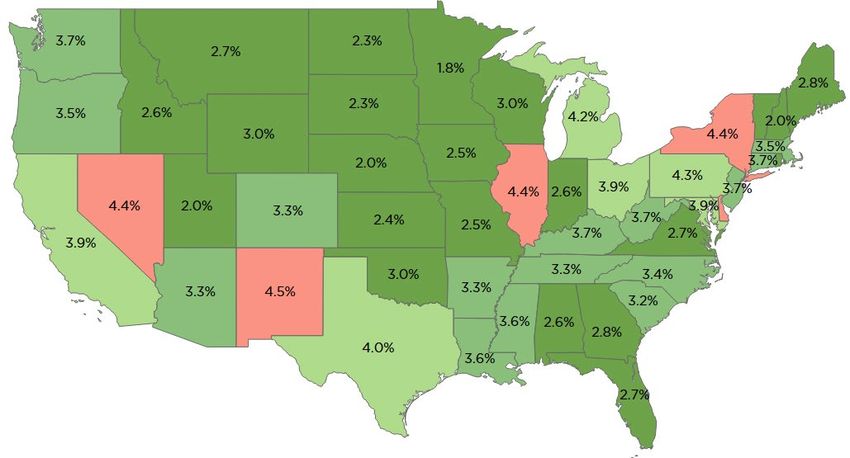
Economic & Financial Market Monthly Review | September 2022

                                                                                       The current economic expansion is
                                                                                       more than two years old, with the Covid
                                                                                       recession having ended in April 2020.
     Business                                                                          Since then, the economy has seen rapid
                                                                                       economic growth on average with rising

        Cycle                                                                          inflation worsened by supply chain
                                                                                       problems and the impact on energy and
      As of September 2022                                                             food prices from the Russian invasion.

                                                                                       The Federal Reserve has responded by
                                                                                       starting a significant tightening cycle.
                                                                                       Sharply rising inflation and interest
                                                                                       rates, along with Fed tightening, are
                                                                                       usually later-cycle phenomena. While
                                                                                       overall growth has slowed, we do not
                                                                                       expect this expansion to end this year —
                                                                                       but the odds of a downturn next year
                                                                                       have risen significantly.

             Yield
                                One of the best predictors of an economic downturn is a fully inverted yield curve, when
                                short-term interest rates are above long-term rates for a sustained period.

            Curve               The spread between 10- and 1-year Treasury note yields remained inverted over August and
                                into September — flashing a yellow warning light for continued growth. But the entire yield
                                curve has not inverted yet, with federal funds rate still lower than longer duration Treasuries.
            Spread between
                                Further aggressive rate tightening by the Fed in September and later this year could cause a
          10-year and 1-year
                                full inversion of the yield curve, although historically the curve would need to be inverted for
         U.S. Treasury yields
                                several months in order to be a clear recession signal.
                                Percentage points

                                                                                  Sources: Bureau of Labor Statistics; Haver Analytics
                                                                                             Shaded areas depict recessionary periods

 Nationwide Economics                                                                                                                    3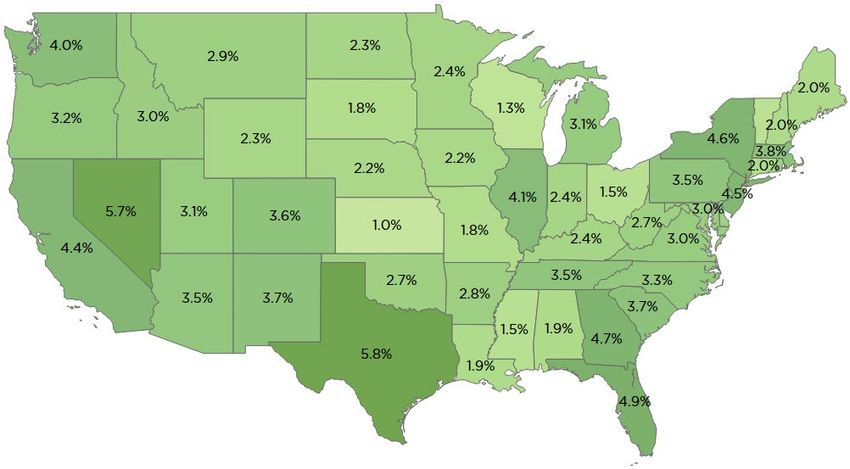
Economic & Financial Market Monthly Review | September 2022

  Housing market has weakened, but the Fed is
  unlikely to alter its rate tightening path
  The economy continues to show signs of slowing with the housing         another weak month for the overall CPI (although a modest
  market, which is on the front lines as the Fed raises interest rates,   acceleration in the core rate is expected).
  leading the downtrend. Demand remains strong in many
                                                                          Energy prices have fallen significantly over the last two months,
  industries, however, with payroll gains still far above the long-run
                                                                          but services inflation — particularly rents, medical services, and
  average and inflation not in the same ballpark as the Fed’s 2.0
                                                                          transportation services — has picked up due to sky-high home
  percent goal — likely prompting another outsized rate hike by the
                                                                          prices and an extremely tight labor market which is pushing up
  Fed this month.
                                                                          wages. Home price growth is expected to fall from its lofty current
  Job growth slowing, but labor market still tight                        rates soon (the housing market is discussed in more detail below),
  Nonfarm payrolls grew by 315,000 in August, a sign that hiring          while wages should decelerate slowly over time as higher interest
  activity, while still elevated, is beginning to slow. August’s number   rates decrease demand for labor across the economy. Still, even
  was roughly in line with recent months when excluding July’s            with healing supply chains and sharp Fed rate hikes acting to slow
  surge, but downward revisions from prior months amounting to            inflation, the march to price stability is expected to be protracted;
  roughly 100,000 jobs mean total payrolls were lower in August           inflation readings will be highly elevated into early 2023 and could
  than expected. Significant job gains were seen in retail,               approach more normal levels by the end of next year.
  professional and business services, and health care as labor
  demand continues to be high in the service sector.                      The housing market is struggling
                                                                          Existing home sales have fallen every month since January and
  The unemployment rate increased to 3.7 percent in July, although
                                                                          July’s pace was the slowest since May 2020, while new home sales
  for positive reasons as the labor force participation rate climbed
  to a post-Covid peak. The size of the labor force grew to an all-       dropped below the trough of the Covid shutdown and were the
  time high as workers aim to take advantage of rising wages and          weakest since January 2016. An early housing slowdown is typical
  widespread job opportunities. However, with job openings still          as the sector is at the forefront of the Fed’s attempt to slow the
  outnumbering job-seekers 2-to-1 and total job openings only a tad       economy with mortgage rates climbing to the highest levels since
  below the all-time high from March, the labor market remains            2008. In conjunction with sharply higher house prices over the
  extremely tight. Although the unemployment rate moved higher,           past two years, the National Association of Realtors’ housing
  the August jobs report should do little to dissuade the Fed from        affordability index plummeted to its lowest level since 1989
  hiking rates sharply again at its upcoming September meeting.           (although it is still much higher than the record low seen in the
                                                                          early ‘80s when mortgage rates were extremely high).
  The inflation fever may have passed
  The 12-month change in the consumer price index (CPI) fell to a         It’s likely that we haven’t seen the floor for home sales this year.
  three-month low of 8.5 percent in July and, barring unforeseen          Pending home sales fell further in June and July (a negative signal
  shocks, may have peaked when it hit 9.1 percent in June. The sharp      for existing sales in August and September), while the NAHB’s
  drop in gasoline prices led the way, but core prices (excluding         housing market index for August painted a dour outlook from
  food and energy) were weaker in July, too. The slower inflation         homebuilders for future new sales and homebuyer traffic.
  trend could continue into August as current forecasts suggest

                                                           Housing Affordability Index
                 250

                200

                 150
        Index

                 100                                                                                                          Rising mortgage
                                                                                                                              rates and house
                                                                                                                              prices have
                  50                                                                                                          caused the NAR
                                                                                                                              housing
                                                                                                                              affordability
                                                                                                                              index to plummet
                   0                                                                                                          this year.
                    1977         1982        1987          1992   1997    2002       2007        2012        2017

                Source: National Association of Realtors

 Nationwide Economics                                                                                                                             4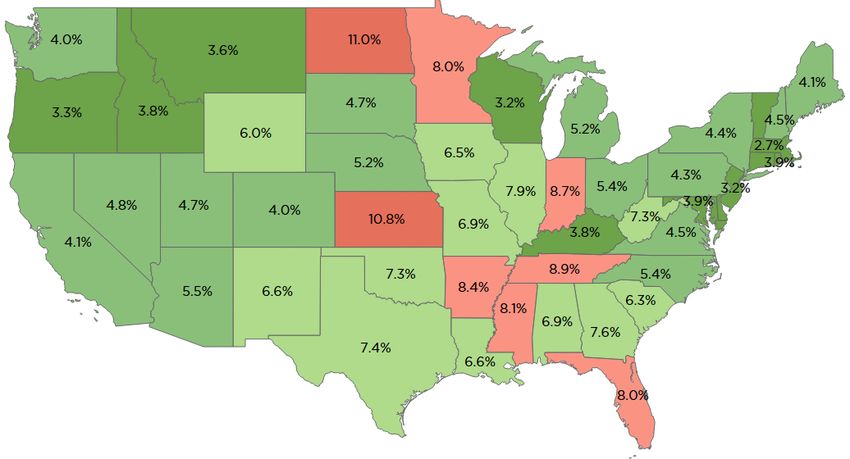
Economic & Financial Market Monthly Review | September 2022

  The market rally falters
  After climbing by 17 percent from mid-June to mid-August, the S&P         negative by 1.0 percent (signaling that the expectation for inflation
  500 index fell off sharply to end August as recession concerns and        over the next 10 years surpassed the yield on the U.S. Treasury
  expectations of higher interest rates rattled investors. No market        note), but the negative real rate has been reversed. As September
  capitalization was spared from the markets’ wrath as almost all sectors   began, the real rate had climbed to almost one percent, the highest
  except energy fell. Fixed income investors also felt the pain as          since early 2019 — also showcasing the positive long-term prospects
  Treasury yields across the curve spiked again. The international story    for the economy.
  continues to be the strength of the dollar, which defied the recent
  weakness in oil and is hurting U.S. exports.                              The decline in equities and rise in interest rates gave investors
                                                                            little place to hide in August. This is the fifth month this year that
  Which way?                                                                the performance of the S&P 500 index and long-term Treasuries
  While equities have staged a few comebacks this year, the                 were both negative. The century’s previous high was in 2009 and
  downtrend continues to carry the day with the S&P 500 index only          2015 when there were three monthly negative returns for both
  modestly above year-lows in early September. Gone is the optimism         asset classes. With four months left, diversification between fixed
  that pushed the market up for seven consecutive months in 2021 —          incomes and equities has been a struggle so far this year.
  an ascent that was driven by high earnings growth. Pessimism
  abounds for future earnings expectations as waning consumer               The U.S. dollar rally continued in August. For 2022, the dollar has
  demand and higher interest rates weigh on growth prospects. The           appreciated more than 15 percent. Weak growth and energy
  tide turned in mid-August as fears over the impact of higher interest     concerns in Europe have pushed the euro below parity for the first
  rates altered sentiment, causing stocks to fall.                          time since the early 2000s. Potential further tightening from
                                                                            global central banks and the extended conflict in Ukraine have
  Market volatility spiked again in the late-August decline. For most of    further hurt sentiment for the euro and international equities.
  the second quarter, the VIX index, a measure of anticipated short-
  term market volatility, traded above 25. The early third-quarter          Some relief from oil
  decline in volatility, which seemed to signal an improved                 Oil prices fell under $90 recently, back to the level last seen in
  environment for equities, evaporated quickly as the VIX spiked            February. The end of the summer driving season and concerns
  above 25 once again — as is typical in the later cycle period.            about a global recession reduced demand. More domestic and
                                                                            OPEC+ supply allowed consumers to see relief at the pump, but
  Interest rates follow the Fed                                             the recent talk of supply cuts from OPEC+ reminds markets of the
  Expectations of further sharp tightening by the Fed caused                fragility of the energy complex.
  interest rates to rise rapidly in August. The 10-year Treasury note
  yield shot past 3.00 percent (near 3.30 percent as this was               Financial markets continue to price in further aggressive Fed
  written), erasing a short trek to nearly 2.50 percent. The 2-year         tightening through year-end, helping to drive some of the volatility
  yield saw a similar increase over August, keeping the important 2-        in equity markets. But there remains much uncertainty for 2023
  10 Treasury spread in an inverted state.                                  where expectations are split on whether the Fed will tighten
                                                                            further or start to ease policy in response to weakening economic
  Real interest rates, nominal less inflation, continue to rise. At the     conditions or even signs that a recession is building.
  start of the year, the U.S. Treasury Inflation-Protected note yield was

                                                                               1-month     6-months   12-months

    Asset Class                                                                                                          Index measuring equity performance
                                                                                                                     1

                                S&P Composite 500 Index                       -4.08%       -8.84%      -11.23%            of developed markets outside of the
                                                                                                                          U.S. and Canada
   Performance                  S&P Midcap 400 Index                           -3.10%      -7.89%     -10.37%
                                                                                                                     2   Federal Reserve trade-weighted
                                                                                                                         broad currency index
   Total returns represented                                                                                         3   Commodity Research Bureau; CRB
       as of August 31, 2022    S&P Smallcap 600 Index                         -4.39%      -9.33%      -12.12%           spot index
                                                                                                                     4   Index of 1-year to 10-year Treasury
                                EAFE1                                         -4.99%      -15.54%     -21.89%            notes
                                                                                                                     5   Index of 10-year and longer Treasury
                                                                                                                         notes and bonds
                                U.S. Dollar Index2                            -4.08%       -8.84%      -11.23%       6   Index of U.S. investment-grade
                                                                                                                         corporate bonds
                                CRB Commodity        Index3                    0.44%       -4.01%      4.53%

                                Intermediate Treasuries4                       -2.01%      -4.82%      -7.57%

                                Long Treasuries5                               -4.43%     -18.20%     -22.64%

                                Investment-grade Corporate Bonds6              -2.93%      -9.41%     -14.91%       Sources: Bloomberg; Haver Analytics

 Nationwide Economics                                                                                                                                           5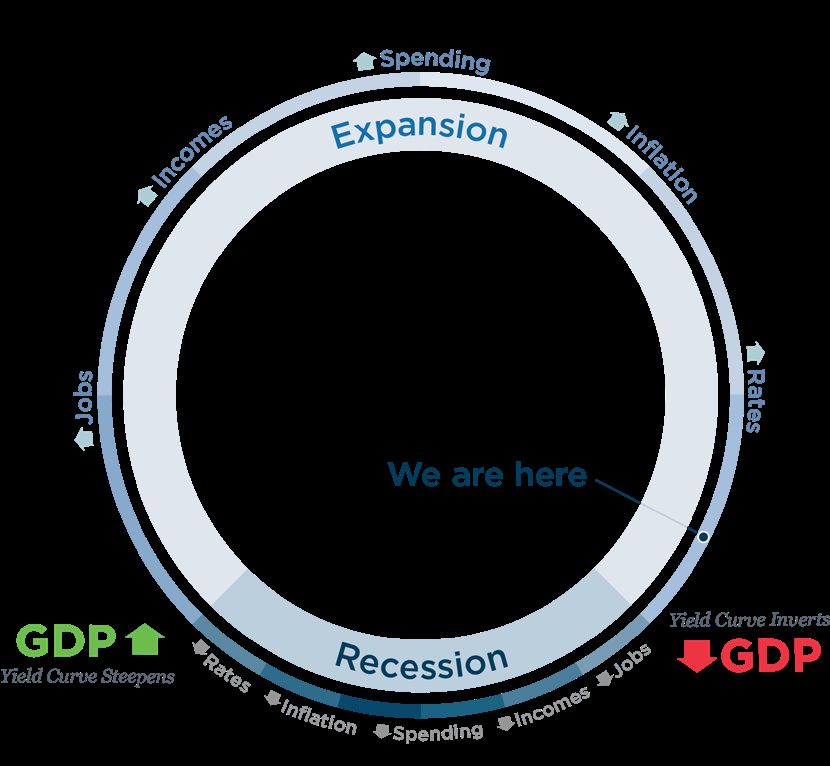
Economic & Financial Market Monthly Review | September 2022

  History says to expect the unexpected
  The effects of the Federal Reserve’s tightening cycle are already                       tide goes out do you discover who’s been swimming naked”).
  being felt in the real economy, as the housing market has slumped                       Even the reversals in tech stocks and the housing market, which
  under the weight of higher mortgage rates. The impact, however,                         may appear to be have been predictable in hindsight, were not so
  has been more pronounced in the financial markets, with Treasury                        obvious in real time, at least in terms of timing, given the
  yields and the dollar spiking higher and equity prices retrenching.                     robustness of the booms from which they arose.

  Tighter policy leads to financial strain                                                Market breakages are not always recessionary
  Asset prices do not always move as might be expected when the                           These episodes are also not necessarily recessionary. The
  Fed is hiking rates — note that the S&P 500 has risen across every                      economy continued growing even after what was at the time the
  complete tightening cycle since the mid-1970s — but these                               largest bank failure in U.S. history in the mid-1980s and similarly
  periods invariably give rise to strains that weigh on markets for a                     remained in expansion in the mid-1990s despite a credit crunch
  time. The Continental Illinois failure in 1984, the savings and loan                    and severe recession south of the border. In both cases, the
  crisis of the late 1980s and early 1990s, the Mexican peso crisis in                    Federal Reserve paused rate hike cycles and provided liquidity,
  1994-95, the Nasdaq bust of 2000-02, the housing crash of the                           through the discount window after the Continental Illinois collapse
  mid-2000s, and the spike in overnight repo rates in 2019 can all be                     and via FX swap lines during the peso crisis, in order to maintain
  traced either directly or indirectly to more restrictive monetary                       market functioning (the Fed, of course, also eased in the wake of
  policies. While there are idiosyncrasies involved with each of these                    the S&L crisis, the Nasdaq plunge, and the housing slump,
  episodes, most share the underlying theme of a buildup in                               although it was unable to forestall contractions in these cases).
  leverage during the preceding phase of Fed accommodation and a                          The hawkish rhetoric of late notwithstanding, then, it is to be
  subsequent unwinding (sometimes untidily) once policy is no                             expected that the inevitable strains stemming from the tightening
  longer supportive.                                                                      to date could, for a time, elicit a more supportive policy stance.
                                                                                          The Fed currently has a green light to continue pushing
  Market dislocations tend to come unexpectedly                                           benchmark interest rates higher given the largely healthy
  But while dislocations are to be expected as a consequence of                           economic backdrop, but the tightening cycle itself ensures that
  central bank tightening, they are generally difficult to pinpoint in                    the decision-making won’t be so clear-cut moving forward.
  advance (as Warren Buffett famously quipped, “Only when the

                           Annualized Changes in the S&P 500 during Federal Reserve Tightening Cycles

               8

               6

               4

               2
     Percent

               0

               -2

               -4

               -6

               -8
                       3/72-5/74         12/76-5/81        5/83-8/84        12/86-2/89       2/94-2/95      6/99-5/00      6/04-6/06       12/15-12/18

                    Sources: Standard and Poor's and Federal Reserve Board of Governors

 Nationwide Economics                                                                                                                                           6
Economic & Financial Market Monthly Review | September 2022
Job growth is slowing, but remains solid, in
most states
• Annual job growth was slower
for 42 states in July compared
with three months prior as hiring
Vermont decelerates across the labor
1.4%
market — mainly due to a lack of
available workers rather than a
reduction in demand from
employers.
Rhode Island
2.6%
• Job gains were strongest over
Delaware the past year in Texas and
2.7%
Nevada (with Florida, Georgia,
and New York not far behind) —
areas that have led growth for
much of the pandemic recovery.
Sources: Bureau of Labor Statistics; Haver Analytics
Twelve-month growth rate in nonfarm payroll employment, July 2022
Very tight labor markets in many parts of
the country
• The unemployment rates in 22
states were at-or-below 3.0
percent as of July — a very low
Vermont
2.1% level which is placing strong
upward pressure on wages as
employers compete for the few
unemployed workers.
Rhode Island • Only nine states (including
2.7%
Alaska, not shown) have
Delaware
4.4% unemployment rates above 4.0
percent — a relatively low level —
as labor markets remain very
tight across the country.
Sources: Bureau of Labor Statistics; Haver Analytics
Civilian unemployment rate, July 2022
Nationwide Economics 7Economic & Financial Market Monthly Review | September 2022
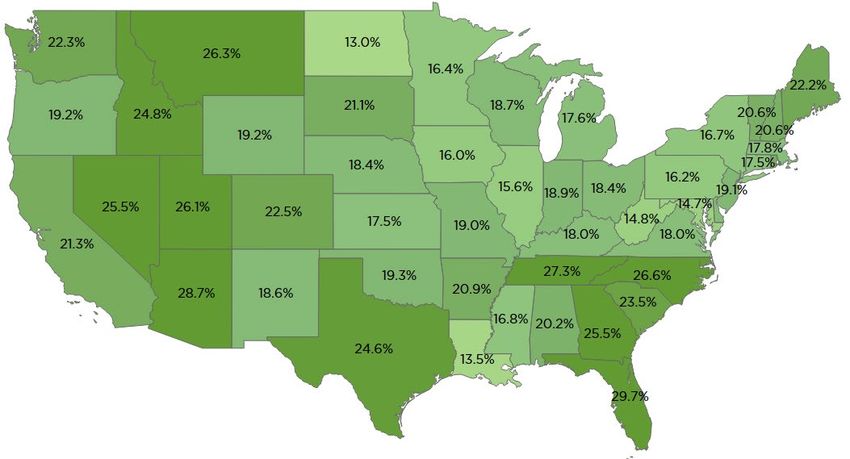
House price gains in many states likely
peaked in mid-2022
• House prices had climbed by at
least 20 percent over the past
year in 22 states as of the second
quarter, an exceptionally fast
pace. Every state saw gains of at
least 13 percent in response to
the widespread supply/demand
imbalance in the market.
• While demand for single-family
housing has cooled sharply in
recent months, supply remains
tight and should keep prices
elevated for some time, albeit
slowing from current peaks.
Sources: Federal Housing Finance Agency (FHFA); Haver Analytics
Four-quarter change in the FHFA House Price Index, 2022Q2
Demand for rental housing remains high in
most markets
• The national rental vacancy rate
dropped to a 38-year low in the
second quarter at 5.6 percent,
but many states show tighter
rental markets than that
(especially in the Pacific
Northwest and the Northeast).
• As the housing market shifts
back to rental housing in
response to affordability
concerns for single-family
homes, asking rents could
continue to climb in many states
with few vacant units.
Sources: Census Bureau; Haver Analytics
Rental vacancy rate, 2022Q2
Nationwide Economics 8Economic & Financial Market Monthly Review | September 2022
Slower, but still solid, job gains for August
• Nonfarm payrolls rose by
315,000 for August, a sizable
drop-off from July’s rapid pace.
The 3-month average for job
gains remains strong at 378,000
but has decelerated from earlier
Change in nonfarm
payroll employment (L)
this year.
Civilian unemployment • The U-3 unemployment rate rose
Millions
Percent
rate: 16 years+ (R) to 3.7 percent, the first increase
since January. But this was
mostly caused by a spike in the
labor force, a positive sign for
improved labor supply.
Sources: Bureau of Labor Statistics; Haver Analytics
Monthly change in nonfarm payroll employment; level of the civilian U-3 unemployment rate, August 2022
Demand for labor remains very strong
• The number of job openings
increased to 11.2 million in July
and is only modestly below the
all-time high from March as
employers across nearly all
sectors are looking for workers.
• While layoffs have occurred in a
few limited pockets of the
workforce, job opportunities
Millions
remain plentiful — suggesting
that most laid off workers are
able to find new jobs quickly.
Source: BLS; Haver Analytics
Job openings, July 2022
Nationwide Economics 9Economic & Financial Market Monthly Review | September 2022
Leading indicators on the cusp of a recession
signal
• The 12-month change in the Index
of Leading Economic Indicators
(LEI) fell to zero in July.
Historically, a negative reading for
Percent change, year-over-year
the LEI has led the next economic
downturn by about a year or so.
• There have been several times
when the LEI was flat or slightly
negative for a short period before
climbing again, but this would
require a quick rebound from
several consumer and business
indicators in coming months.
Sources: Conference Board; Haver Analytics; Shaded areas depict recessionary periods
12-month change in the Index of Leading Economic Indicators; July 2022
Consumer growth expectations are at
recessionary levels
• Within the LEI, consumer
expectations have been the
weakest component as high
inflation and Fed tightening have
increased concerns about a
potential recession.
• But these very poor survey
readings run counter to solid
spending and business activity to
Index
date — with continued growth in
retail sales and industrial
production through July.
Current level
Sources: Conference Board; Haver Analytics; Shaded areas depict recessionary periods
Average consumer expectations for business and economic conditions; July 2022
Nationwide Economics 10Economic & Financial Market Monthly Review | September 2022
Actual Estimate Forecast
As of September 2022 2020 2021 2022 2023 2024 2025 2026
Real GDP 1
-3.4% 5.7% 1.8% 0.7% 1.2% 1.9% 2.0%
Unemployment Rate 2,7
8.1% 5.4% 3.7% 4.5% 4.9% 4.8% 4.7%
Inflation (CPI) 5
1.2% 6.7% 7.0% 3.0% 2.2% 2.3% 2.4%
Total Home Sales 3,7
6.47 6.89 5.75 5.01 5.45 6.20 6.70
S&P/Case-Shiller Home Price Index 9
10.3% 18.8% 9.2% 1.6% 2.8% 3.2% 3.5%
Light Vehicle Sales 3,7 14.5 14.9 13.8 15.3 16.0 16.3 16.5
Federal Funds Rate 2,4,6
0.00% 0.00% 3.75% 3.50% 2.50% 2.25% 2.25%
1-Year Treasury Note 2,4
0.10% 0.39% 3.65% 3.60% 2.75% 2.50% 2.50%
5-Year Treasury Note 2,4
0.36% 1.26% 3.40% 3.30% 2.85% 2.80% 2.70%
10-Year Treasury Note 2,4
0.93% 1.52% 3.25% 3.10% 2.95% 2.85% 2.80%
30-Year Fixed-Rate Mortgage 2,4
2.67% 3.11% 5.35% 5.10% 4.95% 4.80% 4.70%
Money Market Funds 2,8
0.47% 0.14% 2.15% 3.84% 2.90% 2.47% 2.28%
Major forecast changes from last month
With the yield curve nearing a full inversion and further signs of slowing from consumers and businesses, economic growth is
expected to be very weak in 2023. A deeper recession is still not expected in coming years, with the odds favoring a modest
“growth recession” — if the period is deemed to be a downturn at all. The unemployment rate should climb through 2024,
although not close to the peaks seen over the past two recessions.
A further 75 basis point rate increase from the Fed is expected at the September FOMC meeting in response to high inflation and
strong job gains — with further tightening in subsequent meetings lifting the federal funds rate to the 3.75-4.00 percent range by
year-end. While the Fed could tighten a bit more in early 2023, we expect that it will start to ease monetary policy in the second
half of the year due to much weaker growth and slower inflation.
New auto sales remain highly constrained by production shortages with little-to-no inventory at dealerships. While the supply of
microchips has improved, limited output from automakers is expected to weaken sales into 2023 — lowering our estimates for
2022 and next year. Sales should accelerate thereafter in response to pent-up demand from over the past few years.
1Percent change year-to-year 5 Percent change Q4-to-Q4 9 Percent change Dec-to-Dec
2 Percent 6 Target rate, lower limit
3 Million units 7 Year average
4 Year end 8 Annual return
Sources: Haver Analytics (actuals); Nationwide Economics (estimates and forecasts); except Money Market Funds (all data from Nationwide Economics)
Economic & Financial Markets Monthly Review | Nationwide Economics
The information in this report is provided by Nationwide Economics and is general in nature and not intended as investment or economic advice,
or a recommendation to buy or sell any security or adopt any investment strategy. Additionally, it does not take into account the specific
investment objectives, tax and financial condition or particular needs of any specific person.
The economic and market forecasts reflect our opinion as of the date of this report and are subject to change without notice. These forecasts
show a broad range of possible outcomes. Because they are subject to high levels of uncertainty, they may not reflect actual performance. We
obtained certain information from sources deemed reliable, but we do not guarantee its accuracy, completeness or fairness. Nationwide, the
Nationwide N and Eagle and Nationwide is on your side are service marks of Nationwide Mutual Insurance Company. ©2022 Nationwide
NFM-11356AO.3You can also read