Recovering-Innovation-Exportation Triangle as an Instrument for Sustainable Development: Proposal for Peruvian Agro-Export Development - MDPI

Page created by Tracy Banks
 
CONTINUE READING
Recovering-Innovation-Exportation Triangle as an Instrument for Sustainable Development: Proposal for Peruvian Agro-Export Development - MDPI
sustainability

Article
Recovering-Innovation-Exportation Triangle as an
Instrument for Sustainable Development: Proposal
for Peruvian Agro-Export Development
David Asmat-Campos 1, * , Ángel Carreño-Ortega 2              and Manuel Díaz-Pérez 2
 1    Grupo de Investigación en Ciencias Aplicadas y Nuevas Tecnologías, Universidad Privada del Norte,
      Trujillo 13007, Peru
 2    Escuela Superior de Ingeniería, Universidad de Almería, 04120 Almería, Spain; acarre@ual.es (Á.C.-O.);
      madiaz@ual.es (M.D.-P.)
 *    Correspondence: david.asmat@upn.edu.pe or davidasmat88@hotmail.com
                                                                                                       
 Received: 10 January 2019; Accepted: 18 February 2019; Published: 21 February 2019                    

 Abstract: This study aims to investigate one of the most traditional Peruvian income generators:
 the agricultural sector, addressing specifically endogenous fruits. Based on sales data related to
 local and external markets, it is shown that nowadays farmers from several regions and towns have
 changed the practice of sowing endogenous fruits for the trading of lands and the sowing of other
 types of products. This has caused the farmer’s economic and social recoil within the agricultural
 sector. We restrict our study to the case of lucuma (Pouteria Lucuma), an endogenous fruit possessing
 excellent nutritional properties and exotic flavor that can be used for the production of a variety of
 products. These features make it an exportable product with great acceptance in international markets,
 but mainly in its dehydrated form. Therefore, in order to stimulate farmers’ exporting opportunities,
 it is necessary to transform their products by employing clean technologies that, at the same time,
 reduce production costs. In this sense, we propose a set of strategies to revitalize the sowing of
 lucuma in regions where it used to be cultivated, as well as to promote a sustainable business program
 based on the use of an innovative proposal for hybrid solar dehydration process (dehydration process
 that preserves the organoleptic properties, which is different from other processes). This will assist
 the commercialization of farmers’ products in local and international markets, as well as complying
 with the quality standards required for agro-export.

 Keywords: endogenous resources; Pouteria lucuma; solar dehydrator; agro-export; local development

1. Introduction
     There are many elements that promote local development, and these are also strongly related
to the endogenous resources available in a territory. This concept is defined by The United Nations
Development Program as a place in which the interests, the identity and culture of a community
converge, i.e., a place where actions and economic relations take place [1,2]. However, the strategies
for the local economic development [3,4] consider a territory to be an agent for social transformation,
and not only as a place where its social, cultural, and historical features are important aspects.
     Technological progress, as an agent of change towards social and economic development [4], is of
great importance to local development. Moreover, nine categories are usually used to define synergetic
capital [5] (economic, human, cognitive, symbolic, cultural, institutional, social, psychosocial, and civic
capital). These elements and their coordinated action within the public and private sectors are also
referred to as local development enhancers [6].

Sustainability 2019, 11, 1149; doi:10.3390/su11041149                       www.mdpi.com/journal/sustainability
Recovering-Innovation-Exportation Triangle as an Instrument for Sustainable Development: Proposal for Peruvian Agro-Export Development - MDPI
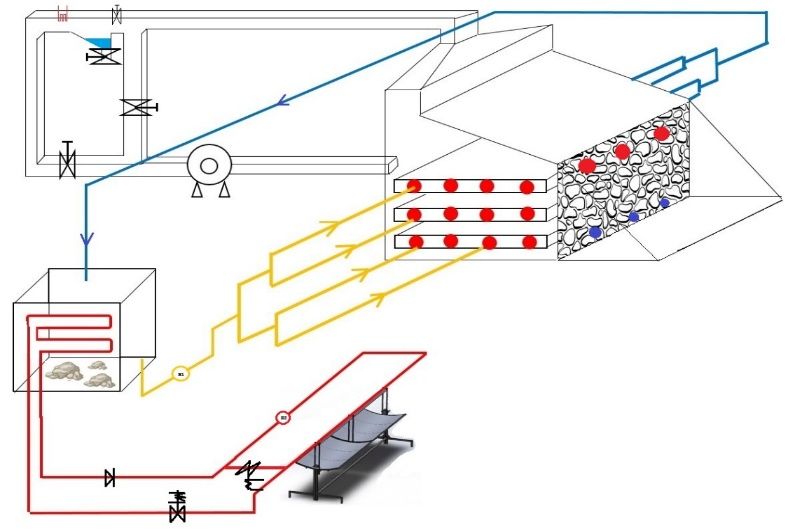
Sustainability 2019, 11, 1149                                                                        2 of 14

     Regarding the globalization process, local society has delayed in adapting to recent leading
processes and transformations. Based on their intrinsic social, economic, and political territorial
features, some initiatives have been proposed [7]. All this relies on the concept of development, which
has been evolving over time, to the point of being part of theories that will be presented here, together
with some perspectives related to this study. Nonetheless, choosing local development requires
achieving consolidation of leading nations and communities. In this regard, some investigations
have claimed that progress does not follow a linear relation, since it relies upon the historical
moment and the perception of reality. Therefore, people might appeal to the exploitation of
endogenous resources through the creation of inclusive production chains with clear goals toward
local development [8]. In addition, other authors refer to local development as a system constituted by
actors (men and women) with specific roles and features that develop interrelated and interdependent
activities surrounding the evolution of a product, from its production to its consumption, to further
local development [9]. To do this, a series of development strategies that contemplate economic
and non-economic dimensions [10] must be established. Considering the aforementioned, local
development can be understood as a set of actions that, taken from inside the territory, improve the
incomes, the employment opportunities, and the quality of life of its inhabitants [11].
     Nowadays, several products are submitted to drying processes for volume/weight reduction or
for preservation purposes [12]. The latter is essential to ensure high-quality products for international
markets, although non-traditional drying processes are preferred. This is because when food is
exposed to drying processes, its nutritional properties tend to be reduced. This is especially true for
fruits whose organoleptic properties (color, flavor, smell, and texture) can be lost easily [13]. In fact,
the lyophilization technique is the most viable method for this purpose, but it significantly increases
the production costs [14]. On the other hand, it has been proven that industrial development based
on agricultural activity plays a crucial role in the economic development of a country [15]. In fact,
several agricultural industries have accelerated their growth by directing their production towards
exportation. This creates employment opportunities for rural and urban inhabitants [16], including
non-agricultural activities such as processing, handling, packaging, among others [17,18]. Hence,
the industrial development based on agricultural activities has a significant impact on the economic
development of urban communities, especially rural ones [16].
     Regarding the lucuma fruit, it is originally from the Peruvian Andean valleys, having as its main
features a delicious flavor and a wealth of vitamins. In addition, chroniclers and historians have
reported the abundance of lucuma in ancient Peru, finding evidence of its cultivation in clay-shaped
representations from the Mochica civilization (2nd to 7th century). This clearly shows how important
the fruit was in the diets of ancient inhabitants from the coast and Andean regions of Peru. Within a
recent context [19], it has been mentioned that outside Peru, lucuma is not well-known, and has a low
demand. This is reflected in the current exportation rates. For example, in 2017, US$1,241,267 worth of
lucuma was exported, which represents a slight increase from the US$1,186,022 worth exported in 2016.
Here, the United States is the country with the highest demand for the fruit, followed by the United
Kingdom, Portugal, Germany, the Netherlands and Australia [20]. This fact clearly shows the lack
of exportable product volume and the standardization of competitive prices to identify international
markets that need, accept and demand the fruit.
     Within the regional context, the production status of lucuma is bleak, since farmers have not been
sowing this fruit, restricting this activity to the regions of Lima, Ica, Arequipa and La Libertad, where
production is mainly for exportation as fruit or frozen pulp. Besides this fact, lucuma production is still
considered scarce due to the lack of an advertisement and especially for not giving it an added value to
increase its value both in domestic and international markets. Moreover, there are several deficiencies
in most of the regions where this fruit is sown, including poor land management by local, regional,
and federal authorities, and alternative use of land such as the extraction of soil to fabricate bricks.
     Socio-economic development is framed as what is known as sustainable development. This
socio-economics paradigm relies on the basics of economic activities that seek to overcome the
Sustainability 2019, 11, 1149                                                                     3 of 14

basic economic problem, i.e., the scarcity of resources against growing societal needs. Thus, it is
desirable to stimulate the creation of companies that satisfy the criteria of sustainability. Moreover,
local development is defined as a process of economic, social, and environmental improvement of
a region, starting from the employment of endogenous resources to improve the quality of life of
the population [21]. To date, several proposals for sustainable cities have been made [22], as well as
referential initiatives that generate sustainable impacts on farmers [23], which reinforces the idea of
betting on sustainable production.
     In fact, the low lucuma production is not enough to supply the increasing international demand,
which seeks the fruit in its dehydrated form and with high standards of quality.
     The present study seeks to spotlight the current production and commercialization indices of a
native Peruvian fruit, the lucuma (Pouteria Lucuma), which has an increasing international demand.
For this purpose, the production records of the last twelve years were used, paying special attention to
the economic impact over the producer population and the hypothetical impact if measures redirected
to provide value are adopted. To do that, some factors, such as an increase in sowing and the
implementation of an innovative and sustainable production system, were analyzed; a set of strategies
to involve Peruvian farmers in the recovery of the sowing activities of lucuma were also implemented,
as well as novel innovative ideas to generate sustainable business development, and consequently,
consolidate their products in international markets. In addition, we proposed the use of an innovative
system for solar dehydration, able to preserve the organoleptic properties of lucuma and significantly
lessen the production costs, while implementing the use of clean technologies.

2. Materials and Methods
      This study contains several strategies and methods to address the past/current status of the
sowing of lucuma (Pouteria Lucuma), whose activity has been losing relevance despite its nutritional
properties and excellent flavor. Currently, the fruit is well-received in Europe and Asia [24], which
clearly spotlights its high demand. However, only a few regions in Peru grow this fruit. Considering
this, it is important to increase farmer’s awareness with respect to the recovery and transformation
of the lucuma and, subsequently, give it added value. The transformation of the product relies on
the process of dehydration, which would be aided by the innovative and sustainable process that is
proposed in this study. The dehydration equipment allows the production of high-quality products
while preserving their organoleptic properties (color, flavor, smell, and texture). Moreover, because
keeping a product under conditions of minimal moisture can greatly increase its lifetime, foreign
companies are primarily interested in dehydrated products [25]. This fact motivates the redirection
of the products to the international market, permitting sustainable development and, consequently,
the improvement of the social and economic status of the producers.
      Based on the available data from the Peruvian Ministry of Agriculture and Irrigation (MINAGRI,
its acronym in Spanish) and the National Institute of Statistics and Informatics (INEI, for its acronym
in Spanish) [26], the trend for the fruit’s scarcity in the face of high international demand has been
identified. Therefore, stimulating its recovery requires the establishment of a series of strategies
that consider different product sales scenarios, the use of available technology to dry the fruits, and
their corresponding economic viability and sustainability. To this end, a multi-criteria methodology
(TEFESAL) is employed. This evaluates, simultaneously, alternatives with respect to their degree
of success for each established objective as a function of weighted criteria. Their results highlight
technological proposals characterized as being innovative for the export market [27]. The export-related
projection used the sensitivity analysis approach, which considers the following variables: production
growth, processing costs, manpower, and taxes, among others, which clearly highlights the real context
and current trends analyzed by our model. The model also provides information regarding the set of
strategies a Peruvian producer must follow to achieve profitability.
Sustainability 2019, 11, 1149                                                                           4 of 14

2.1. Techniques and Tools

Techniques for Obtaining and Processing the Information
     This study employs techniques that rely on concepts of local sustainable development. To this
end, the bibliographical research is without any doubt the starting point. The first step was to achieve
a deep understanding of the content, in order to later address the matter in reality [28].
     The results are summarized in statistical tables and accompanied by their corresponding analyses
and interpretations to draw relevant conclusions.
     It is worth mentioning that the data by itself is of limited usefulness, unless its significance is
highlighted through the proper data interpretation and analysis.
     To validate the innovative proposal of the solar dehydration system, the following Informatics
tools were used: Google Maps (Google LLC, Mountain View, CA, USA), Software (Sun Earth Tools,
Surface Radiation Budget, version 2018, Washington, DC, USA), CO2 calculator (Excel program,
Microsoft Corporation, Albuquerque, NM, USA), and building energy software (DesignBuilder
Software Ltd., London, UK).

2.2. Methods

2.2.1. Multi-Criteria Approach. TEFESAL Analysis
     As previously mentioned, the multi-criteria approach enables us to simultaneously evaluate
alternatives considered in the study as a function of the degree of success and their established
objectives. This is achieved by quantifying a function through a specific weight, and the ordering of
the considered options.
     The method consists of the following: “A”, being the axiomatic set of options to consider:

                                             A = { ai ; i = 1 . . . n }

and “C”, being the axiomatic set of evaluation criteria:
                                                
                                             C = Cj ; j = 1 . . . m

     Each evaluation criterion possesses a field Vj (numeric, i.e., from 0 to 100; ordinals, i.e., 1st, 2nd,
3rd, etc.).
     If an application of the set “A” is done in Vj , it is possible to assign the evaluation yij of the
alternative ai to the criteria c j , and obtain a matrix with the following form:

                                                  c1          cj          cm
                                       a1         y11         y1j         y1m
                                       ...        ...         ...         ...
                                       aj         ...         ...         ...

      During the process of multi-criteria analysis, four phases can be distinguished: (a) definition of
axiomatic set of alternatives, (b) setting of objectives, criteria and indices, (c) partial evaluation of each
alternative as a function of each criterion, (d) adding of the partial evaluations as a function of the
previously weighted criteria.
      In this study, we use the criteria (T) = Technical, (E) = Economic, (F) = Financial, (E) = Environmental,
(S) = Social, (A) = Administrative, and (L) = Legal, which form the abbreviation “TEFESAL”, in which
the most viable option is assigned for the highest obtained punctuation, whose weights and results are
shown in Tables 1 and 2.
Sustainability 2019, 11, 1149                                                                                                      5 of 14

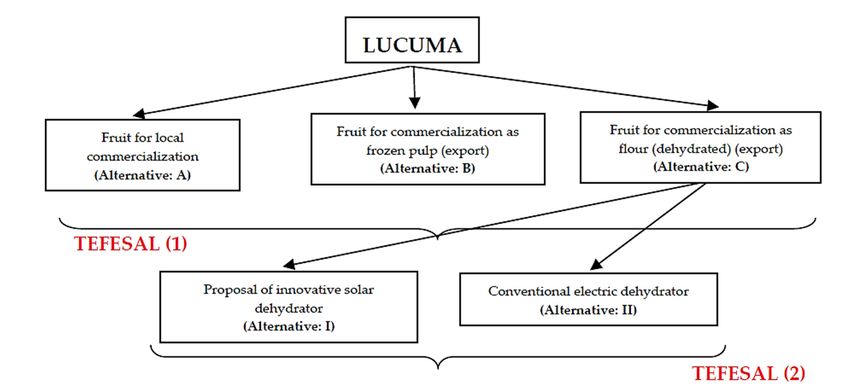
      In the present work, following the scheme below, two fundamental characteristics are analyzed
(see Figure 1):
   Sustainability 2019, 10, x FOR PEER REVIEW                                              5 of 15

                                  Figure
                                Figure      TEFASALmethodology
                                       1.1.TEFASAL  methodologyapplication
                                                                application schema.
                                                                            schema.

2.2.2. Sensitivity Analysis Approach
   2.2.2. Sensitivity Analysis Approach:
      Sensitivity analysis is the first step taken to identify eventual uncertainties. This is crucial, since we
        Sensitivity analysis is the first step taken to identify eventual uncertainties. This is crucial, since
are interested in exploring how the change in one variable might affect the overall result. Additionally,
   we are interested in exploring how the change in one variable might affect the overall result.
oneAdditionally,
     can identifyone   thecanmost   critical
                                 identify   thevariables    or build
                                                 most critical          possible
                                                                   variables         scenarios
                                                                               or build          that
                                                                                          possible     enable that
                                                                                                    scenarios    the analysis
                                                                                                                       enable the  of the
results  under
   analysis   of thedifferent    assumptions
                       results under     different[29].   In short,[29].
                                                    assumptions        the Insensitivity
                                                                                short, the analysis
                                                                                            sensitivityallows
                                                                                                         analysisusallows
                                                                                                                      to measure
                                                                                                                               us to the
change   in  a   result,   given    a change     in a  set   of  variables,    both    in relative  and
   measure the change in a result, given a change in a set of variables, both in relative and absolute    absolute      terms.    It also
improves
   terms. Itthe    quality
                also         of thethe
                      improves       information
                                         quality of sothethat,    for instance,
                                                            information            an investor
                                                                             so that,             possesses
                                                                                        for instance,          additional
                                                                                                       an investor             tools that
                                                                                                                        possesses
take  into account
   additional     tools risks   and into
                         that take    possible
                                           accountprofits
                                                      riskstoandbetter  decide
                                                                    possible       whether
                                                                                profits       or not
                                                                                         to better    to invest
                                                                                                    decide   whetherin a or
                                                                                                                          project
                                                                                                                             not to[27].
   invest
      The in   a project [27].
           importance        of this approach relies on the fact that it provides a referential scenario that can be
used to compare futureofalternatives
        The    importance         this approach     relies
                                                 based   onondifferent
                                                                 the fact that   it provides
                                                                          strategies           a referential
                                                                                         for energetic   andscenario
                                                                                                                agro-exportthat can
                                                                                                                                 policies
   be  used   to   compare     future   alternatives   based     on  different    strategies  for energetic
related to lucuma and its transformation into flour for export. Therefore, the model seeks to predict          and   agro-export
thepolicies  relatedof
     profitability      to the
                            lucuma    and its transformation
                                 production      process of lucuma  into flour   foras
                                                                            flour,    export.
                                                                                         well Therefore,    the model
                                                                                               as to evaluate              seeks to
                                                                                                                   the uncertainties
related to the model to guarantee its reliability and identify eventual variabilities in the model.theTo do
   predict   the    profitability    of  the  production      process    of   lucuma     flour,  as  well  as   to  evaluate
   uncertainties related to the model to guarantee its reliability and identify eventual variabilities in the
so, we considered input parameters, some of them quite variable, such as the number of trees sown as
   model. To do so, we considered input parameters, some of them quite variable, such as the number
a function of lucuma production. We also consider fixed and variable costs in the productive system
   of trees sown as a function of lucuma production. We also consider fixed and variable costs in the
(previously identified).
   productive system (previously identified).
      The
        Theanalysis
               analysiswas wascarried
                                 carried out
                                          out using    thecentered
                                               using the     centeredfinite
                                                                         finitedifference
                                                                                  difference   scheme.
                                                                                             scheme.  Thus,Thus,
                                                                                                               the the   initial
                                                                                                                    initial       values
                                                                                                                             values
(the most
   (the mostlikely   or or
                 likely   frequent)
                             frequent) areare
                                            setset
                                                 upup
                                                    to to
                                                        later
                                                           laterintroduce
                                                                   introduceparameters
                                                                                parametersbasedbasedononaveraged
                                                                                                           averagedstatistical
                                                                                                                         statistical data
according    to   each   particular     case.  Moreover,      each   input    parameter     is subject
   data according to each particular case. Moreover, each input parameter is subject to minor changes,   to  minor    changes,     while
other
   while other input parameters remain constant to their nominal values. Any change in the output is to
       input    parameters       remain    constant    to  their    nominal     values.   Any   change    in the   output     is used
compute
   used tothe     sensitivity
             compute             coefficients,
                           the sensitivity       represented
                                              coefficients,        by partialby
                                                               represented      derivatives    of the output
                                                                                    partial derivatives    of thewith    respect
                                                                                                                     output    withto the
   respect
input       to the input
       parameters            parameters
                         around             around their
                                   their nominal      values.nominal
                                                                   For avalues.
                                                                         modelFor   witha model   with “m”
                                                                                          “m” input           input parameters
                                                                                                        parameters       and only one
   and only
output,  the one     output, coefficients
                sensitivity     the sensitivity   coefficients
                                                can be computed    can be
                                                                        as:computed as:
                                      ∂y / ∂kj = [y (kj + Δkj) – y (kj − Δkj)] j / 2Δkj                                      (1)
                                       ∂y/∂kj = [y (kj + ∆kj) − y (kj − ∆kj)] j/2∆kj                                                  (1)
  Where “y” is the output variable, “kj” is j-th input parameter and (kj + Δkj) and (kj - Δkj) represent
  the value
where  “y” is “y”  when the
              the output      input “kj”
                           variable, parameter     “kj” changes
                                          is j-th input           in “Δkj”.
                                                          parameter            + ∆kj)
                                                                      and (kjThe   precision      ∆kj)computed
                                                                                      and (kjof− the   represent the
  sensitivities
value “y” when  depends  on the
                  the input      change “Δkj”.
                             parameter           In this study,
                                         “kj” changes           we consider
                                                          in “∆kj”.           one input
                                                                     The precision       parameter
                                                                                     of the  computed(m =sensitivities
                                                                                                          1) and
  seven  output   variables to map   out the  increase   in profitability of the operation.
depends on the change “∆kj”. In this study, we consider one input parameter (m = 1) and seven The standardized
  sensitivity
output        coefficients
        variables  to map(Sj)
                            outare
                                thecomputed
                                    increase in to profitability
                                                   ensure that the
                                                                 of sensitivity results
                                                                    the operation.   Thearestandardized
                                                                                             independent sensitivity
                                                                                                           of the
  model’s units as well as to enable the comparison between the effects of different input parameters.
coefficients (Sj) are computed to ensure that the sensitivity results are independent of the model’s
  The “Sj” represent the percentage rate of the most sensitive variables (seven variables) as a
units as well as to enable the comparison between the effects of different input parameters. The “Sj”
  consequence of the percentage rate in the input parameters that oscillate from ± 20% to ± 50%,
Sustainability 2019, 11, 1149                                                                        6 of 14

represent the percentage rate of the most sensitive variables (seven variables) as a consequence of the
percentage rate in the input parameters that oscillate from ±20% to ±50%, depending on the standard
deviations of the statistical sample. Microsoft Excel was used to analyze these parameters.

3. Results
     This section is divided in three parts: In the first one, we deal with the statistical data treatment,
paying attention to the current circumstances of the fruit, especially in its production and current
market cost. The second part is based on the results collected from the multi-criteria approach TEFESAL
(1–2). There, it is proposed to transform the fruit into a dehydrated product, by using innovative solar
dehydration equipment that preserves its organoleptic properties. Finally, we analyze the viability
of exporting the dehydrated product by means of the sensitivity analysis approach, which considers
production indices, fixed and variable costs, and logistics costs, among other things.

3.1. Recovering the Traditional Cultivation of Lucuma
      To date, the production of Lucuma has been restricted to seventeen Peruvian regions (of the
twenty-four in total), with the Lima region being responsible for the highest production. In addition to
this, in recent years, Lima’s annual production has decreased, while other regions have reported slow
growth over the past fourteen years. Utilizing the data from the Peruvian department of agriculture
and irrigation, we created graphics of the annual variation of production as a function of the sales
price for the twelve biggest lucuma producing regions (Figure 2).
      According the Ministry of Agriculture and Irrigation (MINAGRI), in the last twelve years, Peru
has produced, on average, 12,637.33 TN of lucuma, which corresponds to a harvested area of 1453.25 ha
(representing 0.020% of the national agricultural area).
      Considering the vast amount of agricultural land intended for other crops (99.98% of the national
agricultural area), and the deficient production of lucuma, here we propose using the available areas
between cultivation fields. Therefore, we estimated through the Google Earth measurement tools,
the total perimeter length of cultivation fields in the regions dedicated exclusively to crops, obtaining a
value of 2,047,321.56 meters, with 0.1% margin of error. Our proposal is based on the fact that each tree
must have a distance of 4 meters with respect to its neighbor, having an additional zigzag distribution.
This is suggested to guarantee the appropriate solar exposition and root distribution.
      In addition, according the data of MINAGRI, each lucuma tree produces, on average, 500 fruits
per year (between January and May), which is proportionally equivalent to producing 100 fruits per
month. Also, through the produced net mass data (12,637.33 Tn, and the average mass of a single
fruit), we estimate the number of lucuma trees currently existing, obtaining 84,249.
      Considering the current production data for lucuma (mass in TN), we performed a comparative
analysis of the first three situations considered in the TEFESAL approach. Thus, we refer to the
following possibilities:

Multi-Criteria Analysis-TEFESAL (1)
â ALTERNATIVE A: Use of the fruit for commercialization in local markets.
Where the current lucuma sale price per kilogram is about US$0.80 (Ministry of Agriculture and
Irrigation (MINAGRI), (2018). Statistical data of production and sales prices in Peru). Assuming a total
mass of 12,637,330 kg, we obtain a total sale amount of US$10,109,864.
     Based on these results, we noted that if a farmer currently sells a product to local markets, they
may receive a gross annual income (total gross sale or annual gross income. This refers to the net income
without excluding the production costs) of US$10,109,864, during a productive year (7 remaining
months after the harvest). This would mean an average monthly income of US$1,444,266.29. Please
note that this income does not belong to a single population, it is the net income applicable at the level
of the 17 regions that produce this fruit.
Sustainability 2019, 11, 1149                                                                             7 of 14

â ALTERNATIVE “B”: Use of the fruit for commercialization as frozen pulp abroad (exportation).
Where the current lucuma pulp sales price per kilogram is about US$4.51 (Foreign import company:
“El Inti, the Peruvienne boutique”. (www.boutique-peruvienne.com)). For a total mass of 12,637,330 kg,
we obtain a total sale amount of US$56,994,358.3.
      In this case, the increase in the gross total of alternative “A” by 5.63 times is noticeable.
Nevertheless, we should mention that the production cost to process the fruit using this approach is
relatively high, since refrigeration equipment is used. One should also consider the fixed and variable
costs that this approach implies. As in the previous case, this net value does not apply to one person,
but a set of people whose total production reaches the calculated value.

â      ALTERNATIVE “C”: Use of the fruit for commercialization as flour abroad (dehydrated) (export).

      The current sale price per kilogram of lucuma flour is US$18 (Foreign import company from
Spain, http://www.naturitas.es (Retrieved on: 12 November 2018)). Nonetheless, one must consider
the net mass, which can be estimated by knowing that the mass reduction is 61.1%, due to the moisture
removal of the product. With that in mind, this results in a net mass of 5,042,294.7 kg, which represents
total gross sales of US$90,761,305.
      For this alternative, the production costs are much lower than in case “B”, due to the fact that
the solar equipment does not demand expensive initial costs, although another production cost exists
that will be described later. In addition to that, we compare the gross sales, obtaining an increase by
1.59 times with respect to case “B” and 8.97 times compared to case “A”. This clearly highlights the
benefits of alternative “C”.
      By employing adapted data for the multi-criteria analysis TEFESAL (I), in Table 1, we show the
computed results for each case. Use of the fruit for its commercialization as flour (dehydrated) for
export was the chosen alternative (highest score).

                                Table 1. Weights for the multi-criteria analysis TEFESAL (1).

                                                             CRITERIA
                                                                                                RESULTS
          ALTERNATIVES                T        E        F        A            S   A        L
                    A                 3        1        2         3           1   3        3      21.5
                    B                 0        1        0         1           2   1        0      9.5
                    C                 2        3        3         3           3   2        1      26.5
                Weights               1        2       0.5        3           2   0.5      1       –
                                                   Source: Own elaboration.

     Option “C” generates different opportunities for use with this kind of merchandise, which
possesses similar conditions to the merchandise currently commercialized and with only slightly less
desirable physical characteristics.
     Considering the costs and profitability, we can select this alternative as the most viable, since it
permits a reduction in costs and environmental impact which certainly improves local development.
Sustainability 2019, 11, 1149                                                                                                                                                                                                                                                                                                                                                                                                                                                                                                                 8 of 14
Sustainability 2019, 10, x FOR PEER REVIEW                                                                                                                                                                                                                                                                                                   1 of 15

                                                                L IM A                                                                                                                                   LIMA METR OPOLITAN A                                                                                                                         ICA                                                                                                                                                ICA
                            9500                                                                             0.75                                                                                                                                          1.0
                            9000                                                                                                                                                   3000                                                                                                                         2000                                                                                                                                                 2000
                                                                                                                                                                                                                                                                                                                                                                                             0.9                                                                                                                                              0.9
                            8500                                                                             0.70                                                                                                                                                                                               1800                                                                                                                                                 1800
                            8000                                                                                                                                                                                                                           0.8
                                                                                                                                                                                   2500                                                                                                                                                                                                      0.8                                                                                                                                              0.8
                            7500                                                                                                                                                                                                                                                                                1600                                                                                                                                                 1600
                                                                                                             0.65

                                                                                                                                    PRICE IN FARM ($/Kg)

                                                                                                                                                                                                                                                                 PRICE IN FARM ($/Kg)

                                                                                                                                                                                                                                                                                                                                                                                                                    PRICE IN FARM ($/Kg)

                                                                                                                                                                                                                                                                                                                                                                                                                                                                                                                                                     PRICE IN FARM ($/Kg)
                            7000
      PRODUCTION (Tn)

                                                                                                                                                           PRODUCTION (Tn)

                                                                                                                                                                                                                                                                                        PRODUCTION (Tn)

                                                                                                                                                                                                                                                                                                                                                                                                                                           PRODUCTION (Tn)
                                                                                                                                                                                   2000                                                                    0.6                                                  1400                                                                                                                                                 1400
                            6500                                                                                                                                                                                                                                                                                                                                                             0.7                                                                                                                                              0.7
                                                                                                             0.60
                            6000                                                                                                                                                                                                                                                                                1200                                                                                                                                                 1200
                                                                                                                                                                                   1500
                            5500                                                                                                                                                                                                                           0.4                                                                                                                               0.6                                                                                                                                              0.6
                                                                                                             0.55                                                                                                                                                                                               1000                                                                                                                                                 1000
                            5000
                                                                                                                                                                                   1000
                            4500                                                                                                                                                                                                                                                                                 800                                                                                                                                                  800
                                                                                                                                                                                                                                                                                                                                                                                             0.5                                                                                                                                              0.5
                            4000                                                                             0.50                                                                                                                                          0.2
                                                                                                                                                                                                                                                                                                                                                                  PR O DUC TIO N                                                                                                                                     PR O DUC TIO N
                            3500                                                                                                                                                    500                                              PR OD U CTIO N                                                              600                                                                                                                                                  600
                                                                                                                                                                                                                                                                                                                                                                  PR ICE IN FARM                                                                                                                                     PR ICE IN FARM
                                                                                                             0.45                                                                                                                    PR IC E IN FAR M                                                                                                                                        0.4                                                                                                                                              0.4
                            3000                                                 P R O D U C T IO N
                                                                                 P R IC E IN F A R M                                                                                                                                                       0.0                                                   400                                                                                                                                                  400
                            2500                                                                                                                                                      0
                            2000                                                                     0.40                                                                                                                                                                                                        200                                                                     0.3                                                                          200                                                                     0.3
                                2004 2005 2006 2007 2008 2009 2010 2011 2012 2013 2014 2015 2016 2017                                                                                 2004 2005 2006 2007 2008 2009 2010 2011 2012 2013 2014 2015 2016 2017                                                         2004 2005 2006 2007 2008 2009 2010 2011 2012 2013 2014 2015 2016 2017                                                                                2004 2005 2006 2007 2008 2009 2010 2011 2012 2013 2014 2015 2016 2017

                                                                 YE A R                                                                                                                                              YEAR                                                                                                                            YEAR                                                                                                                                               YEAR

                                                                                                                                                                                                                                                                                                                                                                                                                                                                                                          PIURA
                                                       C ER RO DE PASC O                                                                                                                                         AR EQ UIPA                                                                                                                    AYACUCHO                                                                                                                                                                                             0.32
                                                                                                       1.4                                                                          700                                                                                                                                                                                                1.0
                                                                                                                                                                                                                                                                                                                460
                                                                                                                                                                                                                                                           1.0                                                                                                                                                                                                        500                                                                           0.30
                            8000
                                                                                                       1.2                                                                          600                                                                                                                         440                                                                    0.9                                                                                                                                                          0.28
                                                                                                                                                                                                                                                           0.9                                                  420
                                                                                                       1.0                                                                          500                                                                                                                                                                                                                                                                               400                                                                           0.26

                                                                                                                                                                                                                                                                                                                                                                                                                                                                                                                                                                                    PRICE IN FARM ($/Kg)
                            6000                                                                                                                                                                                                                                                                                                                                                       0.8
                                                                                                             PRICE IN FARM ($/Kg)

                                                                                                                                                                                                                                                                 PRICE IN FARM ($/Kg)

                                                                                                                                                                                                                                                                                                                                                                                             PRICE IN FARM ($/Kg)
                                                                                                                                                                                                                                                                                                                400

                                                                                                                                                                                                                                                                                                                                                                                                                                                   PRODUCTION (Tn)
    PRODUCTION (Tn)

                                                                                                                                                                 PRODUCTION (Tn)

                                                                                                                                                                                                                                                                                            PRODUCTION (Tn)
                                                                                                                                                                                                                                                                                                                                                                                                                                                                                                                                                    0.24
                                                                                                       0.8                                                                          400                                                                    0.8
                                                                                                                                                                                                                                                                                                                380
                                                                                                                                                                                                                                                                                                                                                                                       0.7                                                                            300                                                                           0.22
                            4000                                                                                                                                                                                                                                                                                360
                                                                                                       0.6                                                                          300                                                                    0.7                                                                                                                                                                                                                                                                                      0.20
                                                                                                                                                                                                                                                                                                                340
                                                                                                                                                                                                                                                                                                                                                                                       0.6
                                                                                                                                                                                                                                                                                                                                                                                                                                                                      200                                                                           0.18
                                                                                                       0.4                                                                          200                                                                                                                         320
                            2000                                                                                                                                                                                                                           0.6
                                                                           PRODUCTION                                                                                                                                                                                                                                                                                                                                                                                                                                                               0.16
                                                                           PRICE IN FARM                                                                                                                                                                                                                        300                                                                    0.5
                                                                                                       0.2                                                                          100                                            PRO D UCTIO N
                                                                                                                                                                                                                                                           0.5                                                                                                   PRODUCTION                                                                                           100                                                                           0.14
                                                                                                                                                                                                                                   PRICE IN FARM                                                                280                                              PRICE IN FARM
                               0                                                                                                                                                                                                                                                                                                                                                                                                                                                                                           PRODUCTION
                                                                                                       0.0                                                                            0                                                                                                                                                                                                0.4                                                                                                                                                          0.12
                                                                                                                                                                                                                                                                                                                260                                                                                                                                                                                                        PRICE IN FARM
                                                                                                                                                                                                                                                           0.4
                                                                                                                                                                                                                                                                                                                                                                                                                                                                        0                                                                     0.10
                               2004 2005 2006 2007 2008 2009 2010 2011 2012 2013 2014 2015 2016 2017                                                                                  2004 2005 2006 2007 2008 2009 2010 2011 2012 2013 2014 2015 2016 2017                                                        2004 2005 2006 2007 2008 2009 2010 2011 2012 2013 2014 2015 2016 2017
                                                                                                                                                                                                                                                                                                                                                                                                                                                                         2004 2005 2006 2007 2008 2009 2010 2011 2012 2013 2014 2015 2016 2017
                                                               YEAR                                                                                                                                                  YEAR                                                                                                                          YEAR
                                                                                                                                                                                                                                                                                                                                                                                                                                                                                                          YEAR

                                                                                                                                                                                                                                                                                                                                                    J
                                                                                                                                                                                                                                                                                                                                                    U
                                                                                                                                                                                                                                                                                                                                                    N
                                                               ANCASH                                                                                                                                                                                                                                                                                 蚇
                                                                                                                                                                                                                    H
                                                                                                                                                                                                                    U

                                                                                                                                                                                                                           U
                                                                                                                                                                                                                           C
                                                                                                                                                                                                                           O
                                                                                                                                                                                                                     罭                                                                                                                                                                                                                                                                              APURIMAC
                                                                                                                                                                                                                                                                                                                 600                                                                                                                                                  100
                                                                                                                                                                                    240
                             200                                                                                                                                                                                                                                                                                                                                                                                                                                                                                                              0.60
                                                                                                       0.9                                                                                                                                                 0.8                                                                                                                               0.7
                                                                                                                                                                                    220
                                                                                                                                                                                                                                                                                                                 500
                             180
                                                                                                                                                                                                                                                                                                                                                                                                                                                                                                                                              0.55
                                                                                                                                                                                    200
                                                                                                                                                                                                                                                           0.7                                                                                                                                                                                                         80
                                                                                                       0.8                                                                                                                                                                                                                                                                                   0.6
                             160                                                                                                                                                                                                                                                                                 400
                                                                                                             PRICE IN FARM ($/Kg)

                                                                                                                                                                                                                                                                                                                                                                                                                    PRICE IN FARM ($/Kg)

                                                                                                                                                                                                                                                                                                                                                                                                                                                                                                                                                             PRICE IN FARM ($/Kg)
                                                                                                                                                                                                                                                                 PRICE IN FARM ($/Kg)
                                                                                                                                                                                    180                                                                                                                                                                                                                                                                                                                                                       0.50
          PRODUCTION (Tn)

                                                                                                                                                                                                                                                                                              PRODUCTION (Tn)

                                                                                                                                                                                                                                                                                                                                                                                                                                                 PRODUCTION (Tn)
                                                                                                                                                                 PRODUCTION (Tn)

                             140                                                                                                                                                    160                                                                    0.6
                                                                                                       0.7                                                                                                                                                                                                       300                                                                         0.5                                                                                                                                              0.45
                                                                                                                                                                                                                                                                                                                                                                                                                                                                       60
                             120                                                                                                                                                    140
                                                                                                                                                                                                                                                           0.5
                                                                                                                                                                                                                                                                                                                 200                                                                                                                                                                                                                          0.40
                                                                                                       0.6                                                                          120                                                                                                                                                                           PRODUCTION                 0.4
                             100
                                                                                                                                                                                                                                                                                                                                                                  PRICE IN FARM
                                                                                                                                                                                    100                                  PRODUCTION
                                                                                                                                                                                                                                                           0.4                                                                                                                                                                                                         40                                                                     0.35
                              80                                                                                                                                                                                         PRICE IN FARM                                                                           100
                                                                              PRODUCTION               0.5                                                                           80                                                                                                                                                                                                      0.3                                                                                                                       PRODUCTION
                              60                                              PRICE IN FARM                                                                                                                                                                                                                                                                                                                                                                                                                            PRICE IN FARM          0.30
                                                                                                                                                                                                                                                           0.3
                                                                                                                                                                                     60                                                                                                                            0
                              40                                                                     0.4                                                                                                                                                                                                                                                                                   0.2                                                                         20                                                                     0.25
                                                                                                                                                                                      2004 2005 2006 2007 2008 2009 2010 2011 2012 2013 2014 2015 2016 2017
                                2004 2005 2006 2007 2008 2009 2010 2011 2012 2013 2014 2015 2016 2017                                                                                                                                                                                                                 2004 2005 2006 2007 2008 2009 2010 2011 2012 2013 2014 2015 2016 2017                                                                              2004 2005 2006 2007 2008 2009 2010 2011 2012 2013 2014 2015 2016 2017
                                                                                                                                                                                                                     YEAR
                                                               YEAR                                                                                                                                                                                                                                                                                  YEAR                                                                                                                                               YEAR

                        Figure 2. Annual data related to the twelve Peruvian regions with highest production of lucuma from 2005 to 2016. Source: Compiled data collected from the Peruvian
                        Ministry
                      Figure     of Agriculture
                             2. Annual          and Irrigation.
                                        data related to the twelve Peruvian regions with highest production of lucuma from 2005 to 2016. Source: Compiled data collected from the
                      Peruvian Ministry of Agriculture and Irrigation.
Sustainability 2019, 10, x FOR PEER REVIEW                                                                               1 of 15

         Option “C” generates different opportunities for use with this kind of merchandise, which
   possesses similar conditions to the merchandise currently commercialized and with only slightly less
Sustainability 2019, 11, 1149                                                                            9 of 14
   desirable physical characteristics.
         Considering the costs and profitability, we can select this alternative as the most viable, since it
3.2.permits   a reductionSolar
     INNOVATION:              in costs and environmental
                                  Dehydration  of Lucuma impact which certainly improves local development.

   3.2.By taking advantage
        INNOVATION:     Solar of Peru’s solar
                              Dehydration       potential, we propose an innovative solar dehydration
                                           of Lucuma
model that generates a product of high quality that adheres to export standards (certified by
         By taking advantage of Peru’s solar potential, we propose an innovative solar dehydration
Codex Alimentarius) and, at the same time, is able to reduce costs and environmental impact.
   model that generates a product of high quality that adheres to export standards (certified by Codex
      Several studies have demonstrated that use of conventional models of dryers and solar
   Alimentarius) and, at the same time, is able to reduce costs and environmental impact.
dehydrators adversely affects the product’s taste and vitamin quantity, a fact that motivates the
         Several studies have demonstrated that use of conventional models of dryers and solar
novel proposal of innovative solar dehydrator systems.
   dehydrators adversely affects the product’s taste and vitamin quantity, a fact that motivates the novel
   proposal of innovative solar dehydrator systems.
3.2.1. Proposal for an Innovative Solar Dehydrator Model
   3.2.1.
      WeProposal
           propose for       an Innovative
                        a solar  system that   Solar  Dehydrator
                                                  dehydrates    theModel:
                                                                      lucuma while keeping its organoleptic properties
(texture,Wecolor,   flavor
              propose         and system
                           a solar  smell) [13],   which are in
                                             that dehydrates     thedemand
                                                                      lucuma in    international
                                                                                while    keeping itsmarkets,
                                                                                                       organolepticalmost   intact.
                                                                                                                        properties
      Through       a physical     study,   we   developed     a  novel    system     (Patent    number     N  ◦ P201731235) that
   (texture, color, flavor and smell) [13], which are in demand in international markets, almost intact.
increases   the productivity
         Through       a physicallevels
                                     study,ofwedehydrated
                                                   developedfruits    andsystem
                                                                a novel     uses calorific
                                                                                     (Patentenergy
                                                                                               number   byN°
                                                                                                           means     of a cylindrical
                                                                                                               P201731235)      that
parabolic
   increases the productivity levels of dehydrated fruits and uses calorific energy by means of that
             collector     (CPC)   and   a Trombe     wall. The    latter  has  the  capability     to heat  a  wall  of  stones    a
acts as a battery
   cylindrical         of thermal
                  parabolic          energy,
                                collector  (CPC)a phenomenon
                                                    and a Trombe    similar
                                                                       wall. to
                                                                              Thethe   greenhouse
                                                                                    latter             effect. Thetowall
                                                                                           has the capability          heatof   stones,
                                                                                                                             a wall
when   heated,
   of stones      emits
               that   acts infrared    radiation
                            as a battery           to the
                                           of thermal     internal
                                                        energy,       air medium.similar
                                                                  a phenomenon          Since this   kind
                                                                                                to the      of radiation
                                                                                                        greenhouse          transmits
                                                                                                                        effect. The
only  low-energy
   wall  of stones, rates,
                        whenitheated,
                                  is mainly
                                          emitsaccumulated     in the internal
                                                  infrared radiation               region of
                                                                          to the internal    airthe   chamber
                                                                                                  medium.         (since
                                                                                                              Since   thisitkind
                                                                                                                             doesofnot
have   enoughtransmits
   radiation       energy to     be transmitted
                               only                   through
                                      low-energy rates,     it isthe   walls),
                                                                   mainly       and as a consequence,
                                                                             accumulated       in the internal  theregion
                                                                                                                     heat increases
                                                                                                                             of the
andchamber      (since to
     can be stored        it does   notreleased
                             later be    have enough       energy to be chamber.
                                                   to the dehydration         transmitted through the walls), and as a
   consequence,
      To obtain athe        heat increases
                       quality    product, and     can be storedato
                                              we incorporate            later be releasedwhich
                                                                     “Thermobank”,           to the stores
                                                                                                      dehydration      chamber.
                                                                                                              the calorific    energy
         To   obtain    a quality   product,    we  incorporate    a  “Thermobank”,            ◦
                                                                                           which
emitted by the CPC, and thus provides a controlled temperature of 60 C to the dehydrated chamber,   stores  the  calorific  energy
   emittedgradual
allowing      by the CPC,      and thus provides
                         dehydration.      Later, thealucuma’s
                                                        controlledpellets
                                                                      temperature
                                                                              start toofrelease
                                                                                          60 °C to   the moisture,
                                                                                                  their  dehydrated      chamber,
                                                                                                                      which    is then
   allowing    gradual       dehydration.     Later,  the lucuma’s     pellets   start  to release
redirected to a controlled condensation system. The Trombe wall process is performed several          their  moisture,    whichtimes
                                                                                                                                   is
   then redirected
during    a day, as ittoworksa controlled   condensation
                                    as a calorific   energysystem.
                                                              source.The  SinceTrombe
                                                                                  the wallwallofprocess
                                                                                                  stones is  performed
                                                                                                          emits             several
                                                                                                                    calorific  energy
   times during a day, as it works as a calorific energy source. Since the wall of stones emits calorific
continuously during the drying process, the product is able to preserve its organoleptic properties.
   energy continuously during the drying process, the product is able to preserve its organoleptic
This process is monitored through temperature and humidity sensors (Figure 3).
   properties. This process is monitored through temperature and humidity sensors (Figure 3).

        Figure
      Figure 3. 3.Proposal
                   Proposalfor
                             forsolar
                                 solardehydrator
                                       dehydrator model
                                                    model with
                                                          with aa system
                                                                   systemfor
                                                                          forpreserving
                                                                              preservingorganoleptic properties
                                                                                          organoleptic properties
        (Design   in process  of patenting, soliciting number
                                                           ◦   N°   P201731235 (Spanish Patent and  Trademark
      (Design in process of patenting, soliciting number N P201731235 (Spanish Patent and Trademark Office)).
        Office)).
     On the basis of thermodynamics, we are able to get the amount of calorific energy, in watts/hour,
that each system obtains. The Trombe wall emits 420 W/h and the CPC a total of 202.22 W/h. These
results will be used later to analyze the production viability further.
     It should be noted that the calculations presupposed a system working eight hours a day for
seven months (number of months where there is no production). Thus, a total of 182 production
days were estimated for the transformation process (June–December, excluding weekends which are
non-working days according to Peruvian legislation).
Sustainability 2019, 11, 1149                                                                              10 of 14

       Considering the average production for five months (January–May) over the last twelve years,
i.e., 12,637.33 Tn (12,637,330 kg), and considering that during the dehydration process, the fruit would
lose up to 60.1% of its mass as moisture, the estimated net mass is 5,042,294.67 kg (lucuma flour),
which represents the quantity used for commercialization purposes. In what follows, we detail some
calculations to estimate the number of solar dehydrators needed to process the current amount of
lucuma that is mass produced in Peru. Computation of the energy necessary to obtain 5,042,294.67 kg.
                                                                                
                                                                              J
                       E = 5,042,294.67 kg. C p luc. = 5,042,294.67 kg 3430 kg  .k

                                                   E = 1.72 × 10¹⁰ Joule
                                                 1.72×10¹⁰ J                      watts
                                          E=   (182 days)(8 h)
                                                                 = 11,813,186.8    h

     However, the proposed equipment provides a net energy rate of 622.22 watts/h; using this
data, the total number of solar dehydrator units is estimated to be 18,986. Hence, to dehydrate the
12,637,330 kg of lucuma produced annually might require 18,986 solar dehydrator units (distributed in
the 17 regions of Peru where the fruit is produced). In this way, 5,042,294.67 kg of lucuma flour mass
can be produced in eight workday hours over a productive cycle of seven months. Expressing the
results in monthly production, one estimates 720,327.81 kg.

3.2.2. Analysis of Two Models for Dehydration

Multi-Criteria Analysis—TEFESAL (2)
      Currently, there are several types of electric dehydration equipment on the market that ensure
quality products. Nevertheless, due to electricity consumption, as well as preventive and corrective
maintenance, those units increase production costs. To reduce costs and ensure a quality product, we
propose the usage of an innovative piece of solar dehydrator equipment whose viability, with respect
to technological, energetic, and other relevant factors, is tested by the multi-criteria TEFESAL analysis.
In what follows, two options are analyzed: ALTERNATIVE “I”: Innovative solar dehydrator; and
ALTERNATIVE “II”: Electric dehydrator.
      After analyzing the two options, and considering the data related to the following characteristics:
Technological, Economic, Financial, Environmental, Social, Administrative and Legal, we obtained the
proper weights, whose scores are detailed in Table 2.

                                Table 2. Weights for the multi-criteria analysis TEFESAL (2).

                                                             CRITERIA
                                                                                                 RESULTS
         ALTERNATIVES                T         E        F          A       S         A     L
                    I                 2        2        3          3       3          3    3       27
                   II                 0        0        1          1       2          1    0       8.5
               Weights                1        2       0.5        3.5      2         0.5   0.5      –
                                                   Source: Own elaboration.

     After the analysis, the chosen alternative is the use of an “Innovative solar dehydrator”, since it
produces different opportunities for use, reduces costs, and increases profitability; features that qualify
the equipment as viable while also generating low environmental impact.

3.3. VIABILITY ANALYSIS: Lucuma Flour Exportation
     Based on the results regarding the annual production of the fruit (gross mass, net mass,
international sale price of lucuma flour), obtained through the setting of parameters previously defined,
we estimate that there should be 18,986 solar dehydration units (SDU)—distributed throughout the
seventeen Peruvian regions where lucuma is produced—to transform and add value to current
Sustainability 2019, 11, 1149                                                                                         11 of 14

production. This involves conducting a general analysis in which each family that grows lucuma is
assigned one SDU [30–33].
      In addition, considering the sales and production of dehydrated net mass, we estimated an
income of US$90,761,305.00. In this case, the annual and monthly incomes of the 18,986 families (who
would each possess a SDU) with a gross income per family per year of US$4780.43 (US$398.36 per
month). Please note that the latter is gross income, which means that fixed and variable costs need to
be subtracted from it. This calculation will be done in detail by using the sensitivity analysis approach.
      For sensitivity analysis, we considered the variation of the planting of lucuma trees, which
involves making estimates using proportionality rules, the gross mass (non-dehydrated), net mass
(dehydrated), the perimeter length of the cultivation area (in meters), the number of SDU assigned to
each family, the gross sale income of lucuma flour in Europe (Spain) (the sale price for 1kg is taken as
reference. Lucuma flour = US$18 (Spain, 2018)), and the expenditures (fixed and variable production
cost and the corresponding export taxes). The National Minimum Wage (NMW) of 2018 was taken
as a reference for our analysis. In Table 3, the NMW percentage variation is shown, which begins
from rates below the NMW until reaching the target rate, i.e., those in which the families devoted to
exporting lucuma flour obtain a profit of 50% above the NMW.
      Please note that the NMW in Peru has increased by 7.82% on average annually. This is a consequence
of the sustained development of the country in recent years, which indirectly denotes a better scenario
for the consolidation of local development projects spread across the country. The NMW data covers
a range of time from 2000 to 2018. In its last revision (2018), it was fixed at US$281.43. Our analysis
considers the current Peruvian situation, where annual production is estimated to be 12,637,350 kg,
as shown in Table 3. On the basis of our model, this implies that 336,992 m are used for sowing and
18,988 farming families (who would each have a SDU) may be involved. The results indicate that
37.9 kg of lucuma flour can be produced, leaving a profit of US$143.4 (this includes tax retentions and
production costs). This income is compared to the NMW, yielding a negative rate (−98.3%) which
indicates that the income is below the NMW. This means that currently, for a farmer, it is not worth
it to transform the fruit for export purposes. Nevertheless, since our aim is to increase production
and, consequently, the number of families involved in this activity, we systematically increase the
number of planted trees, so we consider it a fundamental variable for simulation purposes. In Table 3,
we show the variation of the number of planted trees and the corresponding production indices.
For the sake of completeness, in Figure 4, the increase in the number of trees is shown, but from
the perspective of the lucuma flour mass obtained, which clearly reflects its growth. Our results
show that by sowing 175,000 trees, a relative income of +4.5% above the NMW can be achieved.
Surprisingly, by increasing the number of trees planted to 500,000, a relative income of +66.6% above
the NMW is reached, involving 18,996 families with a profit of US$850.70 monthly. To achieve such
profit, 1,999,996 meters of cultivated perimeter length is required, which represents 97.69% of the total
perimeter length available in the seventeen regions (from a total of 24) of Peru that produce the fruit
(see Figure 5).

                                  Table 3. Sensitivity analysis for lucuma flour to export.

              Number      Perimeter   Production/Family   Production/Family    Profit   % Respect   Number Families
              of Trees    Used (m)       Annual (kg)        Monthly (kg)       (US$)    to NMW         Involved
               84,249       336,992         265.6               37.9           143.4     −98.3          18,987.7
               100,000      399,996         315.2                45            170.2      −67.1         18,988.0
               150,000      599,996         472.8               67.5           255.3      −11.4         18,989.0
               175,000      699,996         551.6               78.8           297.8      +4.5          18,989.5
               200,000      799,996         630.3                90            340.4      +16.4         18,990.0
               300,000     1199.996         945.4               135.1          510.5      +44.3         18,992.0
               400,000     1599.996        1260.4               180.1          680.6      +58.2         18,994.0
               500,000     1999.996        1575.3               225.0          850.7      +66.6         18,996.0
                                                    Source: Own elaboration.
150 000       599 996                               472.8                  67.5          255.3         −11.4         18 989.0
     175 000       699 996                               551.6                  78.8          297.8         +4.5          18 989.5
     200 000       799 996                               630.3                   90           340.4         +16.4         18 990.0
     300 000     1 199.996                               945.4                  135.1         510.5         +44.3         18 992.0
     400 000     1 599.996                               1260.4                 180.1         680.6         +58.2         18 994.0
Sustainability
     500 000 2019,1 11, 1149
                    999.996                              1575.3                 225.0         850.7         +66.6         18 996.012 of 14
                                                                   Source: Own elaboration.

                                        100

                                         50

                                          0
                                  RMV
                      Comparative RMV          0                  50             100            150                 200
                                         -50
                    % Comparative

                                        -100

                                        -150                                        y = 155.97ln(x) − 732.07
                                        -200                                              R² = 0.9104
                    %

                                        -250

                                        -300

                                        -350
                                                             Dehydrated dough (kg) x month (1 Fam.)

         Figure
      Figure     4. Variation
              4. Variation  of of
                               thethe monthly
                                    monthly    lucumaflour
                                             lucuma    flourproduction
                                                              productionasasaafunction
                                                                               functionof
                                                                                        ofthe
                                                                                           thepercentage
                                                                                               percentage variation
                                                                                                          variation of
         of the National  Minimum     Wage  (%NMW),
      the National Minimum Wage (%NMW), for a family.   for a family.

                                                   (a)                                                (b)
         Figure
      Figure     5. (a)
              5. (a)    Minimum
                     Minimum        amount
                                  amount  ofofsown
                                                sownlucuma
                                                      lucumatrees
                                                              treestotoachieve
                                                                        achieveaaminimum
                                                                                  minimumpositive
                                                                                             positive value
                                                                                                      value of
                                                                                                            of profit
                                                                                                               profit in
         in respect  to  NMW    and  the percentage    of used and   available  perimeter in seventeen
      respect to NMW and the percentage of used and available perimeter in seventeen regions. (b) Maximumregions. (b)
         Maximum      amount   of planted trees  to achieve a 66.6%   profit above the NMW    and  the
      amount of planted trees to achieve a 66.6% profit above the NMW and the percentage of cultivationpercentage  of
         cultivation  field used
      field used and available.   and available.

4. Conclusions
     Considering the current high demand for lucuma, it is possible to increase its production by
using the cultivation fields in different regions of Peru. An instructive exercise using our model
predicted that by planting 175,000 trees, representing only 34% of the available cultivation fields, it is
possible to positively impact 18,989 families who, as a result, could increase their income to 4.5%
above the national minimum wage in Peru. These results are based on the sales data of dehydrated
lucuma, which might be processed by using an innovative proposal for solar dehydration that allows
preservation of the organoleptic properties of the fruit, while also being able to reduce production costs
and stimulate a sustainable production sector. In addition, the different productive regions possess the
minimum requirements of solar radiation intensity for sound production, which was also a parameter
considered in our calculations.
     Our findings show that the innovative solar dehydration equipment also aids in the reduction of
the emission of CO2 . In fact, the annual amount of this pollutant gas that is reduced through the use of
the proposed equipment was estimated to be a value of approximately 8,435,066.5 kg for the use of the
18,986 pieces of equipment in the 17 regions.
Sustainability 2019, 11, 1149                                                                                        13 of 14

5. Patents
     In progress: innovative solar dehydration equipment patent, named: “Equipo Deshidratador
Solar de Frutas, con Sistema de Recuperador de Aromas”, Application: P201731235, in the Spanish
office of trademarks and patents (mediated by Office of transfer of research results, OTRI for its
acronym in Spanish, from the Universidad de Almería, Spain).

Author Contributions: Conceptualization, D.A.-C.; Research, D.A.-C. and Á.C.-O.; Formal analysis, D.A.-C.;
Methodology, D.A.-C. and Á.C.-O.; Project management, D.A.-C.; Validation, D.A.-C. and Á.C.-O.; Drafting-original
draft, D.A.-C., Á.C.-O. and M.D.-P.; Writing-revision and editing, M.D.-P. and D.A.-C., Acquisition of funds, D.A.-C.
Funding: This research received no external funding.
Acknowledgments: The authors thank the National Direction of Research and Development from the Universidad
Privada del Norte (DNID)—Perú; for the support and Ing. Walter Asmat (TECSUP-Peru) for useful discussions
and technical support. We are also particularly grateful to the anonymous referees for reading the article and
giving their comments.
Conflicts of Interest: The authors declare no conflict of interest. The sponsors had no role in the design of the
study, the collection, analysis or interpretation of the data, in the manuscript elaboration and the decision to
publish the results.

References
1.    Programa de las Naciones Unidas para el Desarrollo. Informe de Desarrollo Humano Perú 2009 (1); Programa
      de las Naciones Unidas para el Desarrollo: Lima, Peru, 2009. Available online: http://hdr.undp.org/sites/
      default/files/idh2009-peru-vol1-2.pdf (accessed on 13 August 2018).
2.    Vásquez, A. Las Nuevas Fuerzas del Desarrollo; Editorial Antoni Bosch: Barcelona, Spain, 2005.
3.    Boisier, S. Hay un espacio para el desarrollo local en la globalización? Revista de CEPAL 2005, 86, 54–63.
4.    Sforzi, F. Del distrito industrial al desarrollo local. In Los Sistemas Locales de Empresas y el Desarrollo Territorial:
      Evolución y Perspectivas Actuales en un Contexto Globalizado; Martínez Puche, A., Prieto Cerdán, A., Rodríguez
      Gutiérrez, F., Eds.; Editorial Club Universitario: Alicante, Spain, 2005; Chapter 1; pp. 15–37. Available
      online: http://age.ieg.csic.es/deslocal/actividades/2005_JORNADAS_GTDL_ALICANTE.pdf (accessed on
      12 September 2018).
5.    Boisier, S. El desarrollo territorial a partir de la construcción de capital sinergético. Revista Brasileira de Estudos
      Urbanos e Regionais 2000, 0, 39. [CrossRef]
6.    Vázquez Barquero, A. Desarrollo local, una estrategia para tiempos de crisis. Apuntes del Cenes 2009, 28, 117–132.
      Available online: https://www.redalyc.org/articulo.oa?id=479549575007 (accessed on 12 September 2018).
7.    Alburquerque, F. El Enfoque del Desarrollo Económico Local. Cuadernos DEL, 1. Red de Desarrollo
      Económico Local. REDEL. 2004. Available online: https://www.flacsoandes.edu.ec/sites/default/files/
      agora/files/1251776298.area_enfoque_del_0.pdf (accessed on 17 September 2018).
8.    Uribe, C. Un Modelo para Armar. Teorías y Conceptos de Desarrollo; Fondo Editorial de la Pontificia Universidad
      Católica del Perú: Lima, Peru, 2008.
9.    Salazar, M.; Van der Heyden, D. Metodología de Análisis con Equidad para la Promoción del Desarrollo Local;
      Servicio Holandés de Cooperación al Desarrollo en el Perú—SNV: Lima, Peru, 2004. Available online:
      http://cenida.una.edu.ni/relectronicos/REE50S161.pdf (accessed on 12 September 2018).
10.   Kondonassis, A.J.; Malliaris, A.G.; Okediji, T.O. Swings of the pendulum: A review of theory and practice in
      development economics. Am. Econ. 2000, 44, 17–23. [CrossRef]
11.   Barreiro, F. Desarrollo Desde el Territorio. A Propósito del Desarrollo Económico Local. 2000. Available
      online: http://biblioteca.municipios.unq.edu.ar/modules/mislibros/archivos/Barreiro.pdf (accessed on
      28 July 2018).
12.   Hernández, J.; Quinto, P. Secado de medios porosos: Una revisión a las teorías actualmente en uso científico.
      Científica 2005, 9, 63–71. Available online: https://www.redalyc.org/html/614/61490203/ (accessed on
      2 August 2018).
Sustainability 2019, 11, 1149                                                                                  14 of 14

13.   Asmat-Campos, D.; Carreño-Ortega, A. Proposal for a solar fruit dryer design with organoleptic properties
      recovery system. In Proceedings of the International Conference on Renewable Energy and Environment
      Engineering (REEE 2018), Paris, France, 29–31 October 2018; E3S Web Conf. (2019); Volume 80, p. 02003.
      [CrossRef]
14.   Clarke, P. Refractance window TM—“Down Under”. In Proceedings of the 14th International Drying
      Simposium (IDS 2004), Sao Paulo, Brazil, 22–25 August 2004; Volume B, pp. 813–820.
15.   Recasens, X.; Alfranca, O.; Maldonado, L. The adaptation of urban farms to cities: The case of the Alella
      wine region within the Barcelona metropolitan region. Land Use Policy 2016, 56, 158–168. [CrossRef]
16.   Mamoon, D.; Ahsan, M.R. Short term versus long term economic planning in Pakistan: The dilemma.
      J. Econ. Libr. 2017, 4, 30–40. [CrossRef]
17.   Wilkinson, J.; Rocha, R. Agro-Industry Trends, Patterns and Development Impacts; CAB International: London,
      UK, 2009. Available online: http://www.fao.org/3/a-i0157e.pdf (accessed on 12 September 2018).
18.   Edoumiekumo, S.G.; Audu, N.P. The impact of agriculture and agro-based industries on economic
      development in Nigeria: An economic assessment. J. Res. Natl. Dev. 2009, 7, 11–12.
19.   Álvarez Hunami, Z.; Bravo Cardanes, L.E.; Tagami Oshita, R. Plan de Negocio para la Industrialización y
      Exportación de Lúcuma de Seda. Cuad. Difus. 2006, 11, 97–114.
20.   Asociación de Gremios Productores Agrarios del Perú. 2017. Available online: http://www.agapperu.
      org/noticias/exportaciones-lucuma-crecieron-valor-23-34-enero-agosto-del-presente-ano/ (accessed on
      13 January 2018).
21.   Pérez Ramírez, B.; Carrillo Benito, E. Desarrollo Local: Manual de Uso; ESIC: Mardid, Spain, 2000.
22.   Zhan, C.; De Jong, M.; De Bruijn, H. Funding sustainable cities: A comparative study of Sino-Singapore
      Tianjin Eco-City and Shenzhen International Low-Carbon City. Sustainability 2018, 10, 4256. [CrossRef]
23.   Ingram, V.; Van Rijn, F.; Waarts, Y.; Gilhuis, H. The impacts of cocoa sustainability initiatives in West Africa.
      Sustainability 2018, 10, 4249. [CrossRef]
24.   Amable, V.; Ramírez, D. Exportación de Complemento Alimenticio Sobre base de Maca y Lúcuma al Estado
      de Dakota del Norte, USA. Bachelor’s Thesis, Universidad Tecnológica del Perú, Cercado de Lima, Perú,
      2015. Available online: http://repositorio.utp.edu.pe/handle/UTP/281 (accessed on 12 September 2018).
25.   Cerna, D. Investigación Comercial para la Exportación de Lúcuma Liofilizada en Polvo a las Microempresas
      Procesadoras de Alimentos y Bebidas de Reino Unido. Bachelor’s Thesis, Universidad de San Martín de
      Porres, Lima, Perú, 2018. Available online: http://www.repositorioacademico.usmp.edu.pe/handle/usmp/
      3428 (accessed on 24 September 2018).
26.   INEI. Perú: Anuario de Estadísticas Ambientales 2015; BNP 2016-00022; Instituto Nacional de Estadística
      e Informática: Lima, Peru, 2015. Available online: https://www.inei.gob.pe/media/MenuRecursivo/
      publicaciones_digitales/Est/Lib1342/libro.pdf (accessed on 12 September 2018).
27.   Velez-Pareja, I. Sensitivity Analysis. 2003. [CrossRef]
28.   Juárez Alonso, G. Revisión del concepto de desarrollo local desde una perspectiva territorial. Rev. Lider 2013,
      23, 9–28.
29.   Berumen, A.S. La utilidad de los métodos de decisión multicriterio (como el ahp) en un entorno de
      competitividad creciente. Cuad. Adm. Bogotá (Colombia) 2007, 20, 65–87.
30.   Alfaro, M.B.; Costamagna, P. El Pensamiento de Francisco Alburquerque en Torno al Enfoque del Desarrollo
      Territorial, 1st ed.; Universidad Tecnica Nacional Facultad Regional Rafaela: Buenos Aires, Argentina, 2015;
      100p.
31.   Sampford, C. Environmental governance for biodiversity. Environ. Sci. Policy 2002, 5, 79–90. [CrossRef]
32.   Ioppolo, G.; Saija, G.; Salomone, R. From coastal management to environmental management:
      The sustainable eco-tourism program for the mid-western coast of Sardinia (Italy). Land Use Policy 2013, 31,
      460–471. [CrossRef]
33.   Walters, C.J. Adaptive Management of Renewable Resources; MacMillan Publishing Company: New York, NY,
      USA, 1986.

                           © 2019 by the authors. Licensee MDPI, Basel, Switzerland. This article is an open access
                           article distributed under the terms and conditions of the Creative Commons Attribution
                           (CC BY) license (http://creativecommons.org/licenses/by/4.0/).
You can also read