Reservoir-Triggered Earthquakes Around the Atatürk Dam (Southeastern Turkey)
←
→
Page content transcription
If your browser does not render page correctly, please read the page content below
ORIGINAL RESEARCH
                                                                                                                                              published: 14 June 2021
                                                                                                                                      doi: 10.3389/feart.2021.663385

                                             Reservoir-Triggered Earthquakes
                                             Around the Atatürk Dam
                                             (Southeastern Turkey)
                                             Pınar Büyükakpınar 1,2* , Simone Cesca 2 , Sebastian Hainzl 2 ,
                                             Mohammadreza Jamalreyhani 2,3 , Sebastian Heimann 2 and Torsten Dahm 2,4
                                             1
                                              Kandilli Observatory and Earthquake Research Institute, Regional Earthquake-Tsunami Monitoring Center, Boğaziçi
                                             University, Istanbul, Turkey, 2 GFZ German Research Centre for Geosciences, Potsdam, Germany, 3 Institute of Geophysics,
                                             University of Tehran, Tehran, Iran, 4 Institute of Geosciences, University of Potsdam, Potsdam, Germany

                                             Reservoir-triggered seismicity has been observed near dams during construction,
                                             impoundment, and cyclic filling in many parts of the earth. In Turkey, the number of dams
                                             has increased substantially over the last decade, with Atatürk Dam being the largest
                                             dam in Turkey with a total water capacity of 48.7 billion m3 . After the construction of the
                                             dam, the monitoring network has improved. Considering earthquakes above the long-
                         Edited by:          term completeness magnitude of MC = 3.5, the local seismicity rate has substantially
                 Antonio Pio Rinaldi,        increased after the filling of the reservoir. Recently, two damaging earthquakes of Mw
    Swiss Seismological Service, ETH
                 Zurich, Switzerland
                                             5.5 and Mw 5.1 occurred in the town of Samsat near the Atatürk Reservoir in 2017 and
                          Reviewed by:
                                             2018, respectively. In this study, we analyze the spatio-temporal evolution of seismicity
                        Stella Pytharouli,   and its source properties in relation to the temporal water-level variations and the
               University of Strathclyde,
                                             stresses resulting from surface loading and pore-pressure diffusion. We find that water-
                        United Kingdom
                         Luisa Valoroso,     level and seismicity rate are anti-correlated, which is explained by the stabilization effect
       Istituto Nazionale di Geofisica e     of the gravitational induced stress imposed by water loading on the local faults. On the
               Vulcanologia (INGV), Italy
                                             other hand, we find that the overall effective stress in the seismogenic zone increased
                *Correspondence:
                 Pınar Büyükakpınar
                                             over decades due to pore-pressure diffusion, explaining the enhanced background
       pinarbuyukakpinar@gmail.com           seismicity during recent years. Additionally, we observe a progressive decrease of the
                                             Gutenberg-Richter b-value. Our results indicate that the stressing rate finally focused on
                   Specialty section:
         This article was submitted to
                                             the region where the two damaging earthquakes occurred in 2017 and 2018.
           Geohazards and Georisks,
                                             Keywords: reservoir-triggered seismicity, earthquake source parameters, stress-change, seismic hazard, Atatürk
               a section of the journal
                                             Dam
            Frontiers in Earth Science
        Received: 02 February 2021
           Accepted: 22 April 2021           INTRODUCTION
          Published: 14 June 2021
                              Citation:      Discriminating induced or triggered seismicity related to industrial activities from natural
            Büyükakpınar P, Cesca S,         seismicity has been a highly debated subject. Since the beginning of the last century, many
Hainzl S, Jamalreyhani M, Heimann S          earthquakes associated with anthropogenic activities have been reported, and the number of cases
                   and Dahm T (2021)
                                             has been increasing due to the expanding man-made operations, such as gas and oil production,
    Reservoir-Triggered Earthquakes
              Around the Atatürk Dam
                                             wastewater injection, mining, geothermal operations, and water impoundment (Dahm et al.,
                (Southeastern Turkey).       2010; Grigoli et al., 2017; Rinaldi et al., 2020). The most recent, outstanding cases debating
           Front. Earth Sci. 9:663385.       potential induced or triggered seismicity, attracting societal interest, include the 2011 Mw 5.7
     doi: 10.3389/feart.2021.663385          and 2016 Mw 5.8 Oklahoma earthquake sequences (Ellsworth, 2013; Keranen et al., 2013, 2014;

Frontiers in Earth Science | www.frontiersin.org                                   1                                            June 2021 | Volume 9 | Article 663385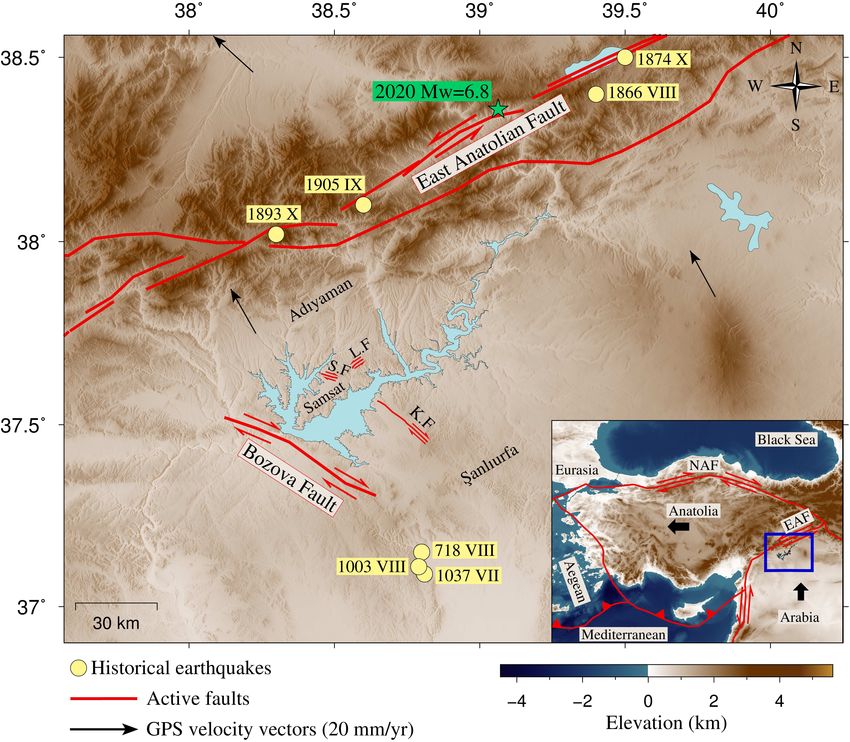
Büyükakpınar et al.                                                                                                Reservoir-Triggered Earthquakes Atatürk Dam

Walsh and Zoback, 2015; Manga et al., 2016; Yeck et al., 2016,              electricity production (DSI)3 . It is also the largest clay-cored rock-
2017), the 2012 Mw 6.1 and 5.9 Emilia, Italy, earthquakes (Cesca            fill dam in Turkey, with 169 m height. The construction of the
et al., 2013a; Dahm et al., 2015; Juanes et al., 2016), the 2017            Atatürk Dam was initiated in 1983, the water impoundment
Mw 5.5 Pohang, South Korea, earthquake (Grigoli et al., 2018;               started in 1990, and the dam became operational in 1992 (Tosun
Kim et al., 2018), the 2011 Mw 5.1 Lorca, Spain, earthquake                 et al., 2007; Tosun, 2012). The annual variation of the water
(González et al., 2012; Martínez-Díaz et al., 2012), the 2013 Mw            level in the Atatürk Dam is in the range of 30 m, between
4.3 Castor, Spain, earthquake sequence (Cesca et al., 2014; Gaite           513 m and 542 m above sea level (DSI)3 . Table 1 summarizes
et al., 2016; Villaseñor et al., 2020), and the 2012 ML 3.6 Huizinge        the characteristics of the Atatürk Dam and its reservoir. After
earthquake at the Groningen gas field (Richter et al., 2020). Many          the water impoundment in the reservoir, field and laboratory
more reported cases caused by human-related activities have been            experiments showed damages along the crest (Çetin et al., 2000)
compiled in different studies (McGarr et al., 2002; Davies et al.,          attributed to the rising amount of water. Consequently, the rock-
2013; Ellsworth, 2013; Foulger et al., 2018).                               fill part of the dam started to slake by May 1992; the upper part of
    In recent years, some attempts have been made to differentiate          the dam was then reconstructed to its original height (549 m), and
induced and triggered seismicity (McGarr and Simpson, 1997;                 the dam was maintained operational by keeping a 7 m freeboard
McGarr et al., 2002; Dahm et al., 2013, 2015; Shapiro et al.,               (Çetin et al., 2000).
2013). In the case of induced earthquakes, the nucleation, growth,               The Atatürk Reservoir (AR) is located on the Euphrates River
and rupture process are determined by human-related stress                  between the Adıyaman-Samsat region and the Şanlıurfa province,
perturbations (Dahm et al., 2013). In the case of triggered                 in southeast Turkey. This region is tectonically influenced by
seismicity, the background stress field plays a more important              the relative motion of the African, Arabian, and Eurasian Plates
role, and human activities are only responsible for the earthquake          resulting in the movement of the Anatolian Plate to the west
nucleation, while the rupture evolution is controlled by the                (McKenzie, 1972; Şengör and Yılmaz, 1981; Şengör et al., 1985;
background stresses (Dahm et al., 2013). This latter case                   Reilinger et al., 2006) as shown in Figure 1. AR is situated
may include large earthquakes, which could be triggered by                  between two fault systems: the Bozova Fault (BF), which is
small perturbations near their nucleation point, but then grow              an NW-SE right-lateral strike-slip structure with 60 km length
considerably, with the final size and magnitude not being                   passing through the southwest of AR (Şahbaz and Seyitoğlu,
controlled by the original anthropogenic stress changes but                 2018), and the East Anatolian Fault (EAF), in a distance of about
depending on fault dimensions and strain (Dahm et al., 2013;                60 km in the northeast of AR, which is a ∼580 km left-lateral
Grigoli et al., 2017). In our study, we use the term reservoir              strike-slip active fault striking NE-SW direction and one of the
triggered seismicity (RTS) for the earthquakes that occurred                most prominent structural elements in the region (Arpat and
close to the Atatürk Dam, as this region is located between                 Şaroğlu, 1972; Duman and Emre, 2013). A recent destructive
tectonically active faults, and the background tectonic stresses            earthquake (Mw 6.8) occurred on January 24, 2020, along the
presumably play a role in the size and magnitude of observed                EAF, within approximately 100 km distance from AR, and caused
seismicity (Figure 1).                                                      serious damages not only in the epicentral area but also in the
    An influence of water reservoir loading on earthquake activity          neighboring regions (Jamalreyhani et al., 2020). Figure 1 also
was first proposed by Carder (1945) at Lake Mead, United States.            shows the existence of local faults dominated by the regional
Many case studies of RTS have been reported since that time;                tectonics in the study area. The Samsat Fault (SF) and Kalecik
most known RTS cases (Mw > 6) were observed at Xinfengjiang                 Fault (KF) showing parallel alignment to the BF and crossing
Dam–China, 1962 Mw 6.2, Kariba Zambia–Zimbabwe, 1963                        the AR in the NW-SE direction with a right-lateral strike-slip
Mw 6.2, Koyna Dam–India, 1967 Mw 6.3, and Zipingpu                          mechanism. On the other hand, The Lice Fault (LF) indicates a
Reservoir–Wenchuan, 2008 Mw 7.9 (Gupta and Rastogi, 1976;                   left-lateral strike-slip mechanism in the NE-SW direction with
Gupta, 1992, 2002; Ge et al., 2009). Wilson et al. (2017) have              respect to the BF, SF, and KF (Perinçek et al., 1987; Kartal and
recently constructed a database with 186 reported cases of                  Kadirioğlu, 2019; Irmak et al., 2020).
RTS (The Human-Induced Earthquake Database HiQuake)1 . In                        Considering the historical seismicity (B.C. 1800–A.D. 1905),
Turkey, although one of the richest countries in geothermal,                no strong (M ≥ 6.0) and damaging earthquakes were reported
mining, and water resources potentials, only a few case studies             near AR (Soysal et al., 1981). Historical earthquakes occurred
of induced/triggered earthquakes have been reported in the                  mainly in the EAF to the north of the dam in 1866, 1893, 1905
literature so far.                                                          (Figure 1). The fault zone was remarkably inactive during the
    Around 860 active dam sites are currently existing in Turkey,           20th century (Ambraseys, 1989; Ambraseys and Jackson, 1998),
and the number is expected to increase (The General Directorate             facing earthquakes with magnitude up to Mw 6.6–6.8, until the
of State Hydraulic Works of Turkey; DSI)2 . Most of these dams              most recent destructive Mw 6.8 Elazığ-Sivrice earthquake on
are located in southeast Turkey since the Southeastern Anatolia             January 24, 2020. On the other hand, some historical earthquakes
Project (GAP) was launched in 1977. Today, the Atatürk Dam is               occurred south of the dam, e.g., in 718, 1003, 1037 (Figure 1;
the fifth largest dam on Earth in terms of water storage capacity           data from the historical earthquake catalog of Turkey and its
(48.7 billion m3 ) and among the largest dam sites in terms of              surroundings; AFAD)4 .

1                                                                           3
    https://inducedearthquakes.org; last accessed September 2020.               http://www.ataturkbaraji.com; last accessed April 2021.
2                                                                           4
    https://www.dsi.gov.tr/Sayfa/Detay/754; last accessed April 2021.           https://deprem.afad.gov.tr/tarihseldepremler; last accessed June 2020.

Frontiers in Earth Science | www.frontiersin.org                        2                                                  June 2021 | Volume 9 | Article 663385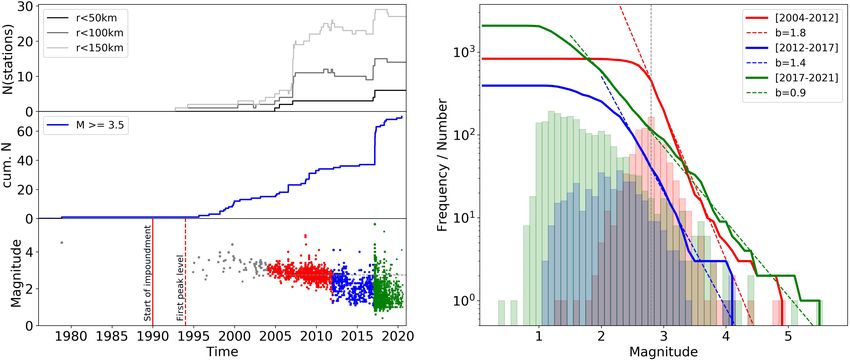
Büyükakpınar et al.                                                                                                             Reservoir-Triggered Earthquakes Atatürk Dam

  FIGURE 1 | Map of the Atatürk Dam and its vicinity. Thick red lines indicate active faults in the region obtained from the European Database of Seismogenic Faults
  (EDSF; Basili et al., 2013), and thin red lines illustrate the local faults; SF: Samsat Fault, KF: Kalecik Fault: LF: Lice Fault (General Directorate of Mineral Research and
  Exploration of Turkey; Perinçek et al., 1987; MTA, 2020). Yellow circles show historical earthquakes (Soysal et al., 1981; Ambraseys, 1989; Ambraseys and Jackson,
  1998; the improved historical earthquake catalog of Turkey and its surroundings (https://deprem.afad.gov.tr/tarihseldepremler; AFAD, 2020; last accessed June
  2020). The green star shows the location of the recent 2020 Elazığ-Sivrice earthquake caused by the reactivation of EAF, which had been silent for more than one
  century. Black arrows show GPS velocity vectors in the area (McClusky et al., 2000). The inset panel shows tectonic plates and boundaries surrounding Turkey,
  where red lines indicate main plate boundaries (Bird, 2003), and black arrows show the relative motion of Arabian and Anatolian Plates roughly. The blue rectangle
  shows the study area, which is enlarged on the map.

   On March 2, 2017, and April 24, 2018, two moderate                                      They pointed out that small-magnitude earthquakes started to
earthquakes (Mw 5.5 and Mw 5.1, respectively) struck Samsat                                occur in the vicinity of the dam soon after the water level reached
town near AR (Figure 1). These earthquakes were responsible                                its first maximum in 1994. Furthermore, they depicted a clear
for dozens of injuries and significant damages to buildings. The                           anti-correlation between water-level change and seismicity in
occurrence of the 2017 earthquake, which is the largest event in                           the region and suggested that the September 3, 2008 earthquake
this region, and its potential anthropogenic source triggered the                          (Mw 5.0) might have been triggered upon a drastic decrease in
interest of seismologists. Reservoir-triggered seismicity around                           the water level, accompanying the low rainfall in the summer
AR was first hypothesized by Eyidoğan et al. (2010) after the                             of 2008. On the other hand, Kartal and Kadirioğlu, 2019 listed
occurrence of the ML 5.2 earthquake on September 3, 2008, which                            several earthquakes from the catalog of DSI local network mostly
was the largest earthquake prior to the 2017–2018 earthquakes.                             after the dam construction and claimed that the seismicity in

Frontiers in Earth Science | www.frontiersin.org                                       3                                                June 2021 | Volume 9 | Article 663385
Büyükakpınar et al. Reservoir-Triggered Earthquakes Atatürk Dam
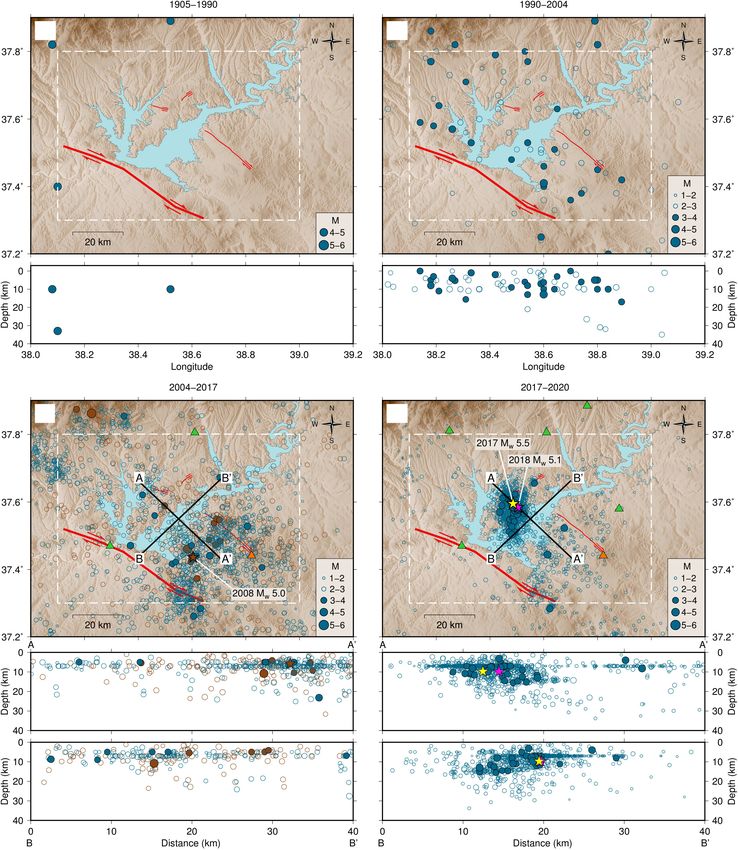
the region occurs independently of changes in the water loading. magnitude of completeness (MC ), being ∼3.5 in the beginning,
Thus, it has remained a matter of debate whether or not the local decreased with the densification of the network to an ultimate
seismicity near the AR is correlated with water level changes and value of about 1.95 in 2017 (Figure 3 and Supplementary
its related effective stress changes. Figure 1). Taking into account only the largest events with
In this study, we use new satellite altimetry open access M ≥ 3.5, which are homogeneously detected over the whole
data that has not been analyzed in previous studies (Database period, the earthquake rate has significantly increased in the AR
for Hydrological Time Series of Inland Waters, DAHITI; region between 1990 and 2020 (Figure 3B) as previously pointed
Schwatke et al., 2015). This database provides nowadays reliable out in the study of Eyidoğan et al. (2010).
and accurate water level data (average uncertainty 2017.
Both catalogs are compiled with the SeisAn - earthquake analysis At the same time, the b-value of GR distribution is estimated as
software (Havskov and Ottemöller, 1999). Hypocenters and 1.8, 1.4, and 0.9 for the periods of 2004–2012, 2012–2017, and
magnitudes are updated according to the travel time residuals 2017–2021, respectively (see also Supplementary Figure 1). Thus
(RMS) and the number of stations used in the location. The the b-value is found to systematically decrease with increasing
time after the impoundment of the dam, which might be a
result of increased stresses in the crust as previously hypothesized
TABLE 1 | The characteristics of Atatürk Dam and its reservoir (The General (Schorlemmer et al., 2005; Scholz, 2015).
Directorate of State Hydraulic Works of Turkey; DSI; http://www.ataturkbaraji.com;
last accessed April 2021; asl* = above sea level).
Anti-Correlation Between Water-Level
Dam type Rock-fill
and Declustered Seismicity
Filling of water 1990
For a detailed analysis of the spatial and temporal characteristics
Opening date 1992
of the earthquake activity with the reservoir, aftershocks which
Dam height 169 m
are triggered by preceding earthquakes should be removed
Dam length 1.819 m
from the catalog. The remaining declustered earthquakes are
Reservoir capacity 48.7 * 109 m3
the so-called background events, which are related to tectonic
Surface area 817 km2
stressing or transient aseismic forcing such as reservoir-induced
Minimum water level 513 m asl*
stress changes. To separate aftershocks and background events,
Maximum water level 542 m asl*
we use an established scheme based on nearest-neighbor
Frontiers in Earth Science | www.frontiersin.org 4 June 2021 | Volume 9 | Article 663385Büyükakpınar et al. Reservoir-Triggered Earthquakes Atatürk Dam FIGURE 2 | (A–D) Long term (1905–2020) spatio-temporal evolution of recorded earthquakes with their magnitudes and depth cross-sections based on a joint KOERI-AFAD catalog near Atatürk Reservoir. The spatial earthquake distribution of historical and instrumental seismic activity around AR for (A) the period 1905–1990 before the water filling, (B) 1990–2004 after the impoundment of the dam – depth versus longitude in panels (A–C) 2004–2017 and two orthogonal cross-sections crossing the dam (AA0 ,BB0 ). The brown dots here show the events during 2004–2008 to highlight the background seismicity, the Mw 5.0 2008 earthquake, and its aftershocks (D) 2017–2020, same cross sections as in panel (C). The existing broadband seismic stations during the corresponding periods are marked by the green (AFAD stations) and orange (KOERI stations) triangles. Yellow and pink stars refer to the hypocenters of March 2, 2017, Mw 5.5 and April 24, 2018, Mw 5.1 earthquakes, respectively. The white dashed rectangle marks the region where the seismic catalogs are combined (37.3◦ -37.8◦ E, 38.1◦ -39.0◦ N). The red lines represent the Bozova, Samsat, Kalecik, and Lice Faults (see Figure 1 to detail). Frontiers in Earth Science | www.frontiersin.org 5 June 2021 | Volume 9 | Article 663385
Büyükakpınar et al. Reservoir-Triggered Earthquakes Atatürk Dam
FIGURE 3 | Frequency-magnitude distribution of the observed earthquakes: (A) Number of seismic stations with a distance less than 50, 100, or 150 km from the
2017 Mw 5.5 epicenter as a function of time; (B) cumulative number of M ≥ 3.5 events and (C) magnitudes of all recorded events versus time, where colors refer to
the different periods analyzed separately in panel (D) and the horizontal dashed line indicates the completeness magnitude MC = 2.75; (D) histograms and
cumulative distributions with GR-fits (dashed lines, the corresponding b-values are provided in the legend). Additional plots of the frequency-magnitude distributions
and the b-value calculation are presented in the Supplementary Figure 1.
distances (Baiesi and Paczuski, 2004, 2005; Zaliapin et al., generated and inverted for the study region. Consequently, a
2008; Zaliapin and Ben-Zion, 2013). This is a purely statistical well-defined velocity model from the mean of inverted models
method that does not rely on any particular aftershock-triggering is constructed. The final velocity model has a good agreement
mechanism, such as static/dynamic coseismic stress changes or with the reference model, with velocity changes not exceeding
afterslip. The method is described in more detail in Appendix A. 0.2 km/s for each corresponding layer. Details of the selected
After declustering, we compare the temporal evolution of events, ray coverage and final 1D velocity model are presented
earthquake activity of the complete part of the catalog (M ≥ 2.8 in the Supplementary Figures 3–5 and Table 1.
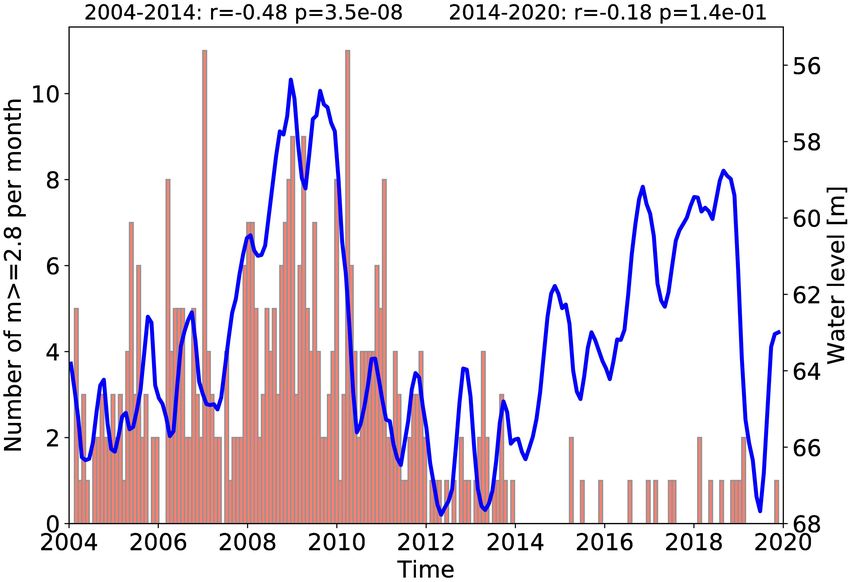
for t > 2004) with the water level variations. Figure 4 shows the
monthly seismicity rate in comparison to the reversed water-level
variations. A significant anti-correlation between earthquake rate
and water-level is observed in the period between 2004 and
2014 with a correlation coefficient of r = −0.48. Afterward,
the anti-correlation becomes weak, particularly because of the
significantly reduced activity of M ≥ 2.8 background events (see
also Supplementary Figure 2).
ANALYSIS OF SOURCE PROPERTIES
Construction of a Local Velocity Model
Firstly, we estimate a local 1D velocity model for our further
analysis of focal depths and source mechanisms. For that
purpose, we use PyVelest5 , based on the travel time inversion
VELEST program (Kissling et al., 1994). We carefully select
470 well-located earthquakes in the region with root mean
squared (RMS) misfit of the solution ≤0.5 s and azimuthal FIGURE 4 | Time evolution of the water level and the earthquake activity
gap ≤180◦ , respectively. The recent model of Acarel et al. (declustered, M ≥ 2.8). Here the y-scale is reversed with values referring to
(2019) is used as the initial model since it is the closest the changes relative to the start of the impoundment. A similar plot with a
normal y-scale is provided in Supplementary Figure 2. The corresponding
model to the reservoir area. By perturbing velocities in the
correlation coefficients (r) for the periods 2004–2014 and 2014–2020 are
±0.3 km/s range, randomly 500 synthetic velocity models are provided in the title line together with the corresponding p-value (significance
for p < 0.05).
5
https://github.com/saeedsltm/PyVelest; last accessed September 2020.
Frontiers in Earth Science | www.frontiersin.org 6 June 2021 | Volume 9 | Article 663385Büyükakpınar et al. Reservoir-Triggered Earthquakes Atatürk Dam
Moment Tensor Inversion teleseismic distances. Since the waveforms of these moderate
The inversion and further decomposition of regional moment events at large distances are weak, we investigate these delays
tensor solutions can be used to discuss cases of natural or at the location of seismic arrays, where waveforms of many
anthropogenic seismicity (Cesca et al., 2013b). Here, moment stations can be shifted and stacked to improve the signal-to-
tensor inversion has been performed using a probabilistic noise (SNR) ratio. We rely on the Abedeto algorithm7 , which has
inversion method, provided by the software Grond6 (Heimann been previously used in similar studies (Negi et al., 2017; Braun
et al., 2017, 2018). This method has been successfully applied in et al., 2018; Gaebler et al., 2019). The qualitative comparison
different studies (e.g., Dahm et al., 2018; Jamalreyhani et al., 2019, of observed and synthetic beams for different source depths
2021; Cesca et al., 2020; Dost et al., 2020; Kühn et al., 2020; López- (Figure 8), which are built assuming source and receiver specific
Comino et al., 2021) and described in some of them (e.g., Dahm crustal models and a global model for the propagation of the
et al., 2018; Dost et al., 2020; Kühn et al., 2020). seismic waves in between, allows to estimate accurate focal
We obtain full moment tensor solutions for the two largest depths. Here, the global crustal velocity model Crust 2.0 (Bassin
events, namely the Mw 5.5 2017 and Mw 5.1 2018 earthquakes, et al., 2000) and the estimated earthquake source models are used
using 3-components waveform inversion in the time domain to calculate the focal depths (see Figure 6 and Supplementary
and the frequency band of 0.02–0.05 Hz. A prior data quality Table 2). In this way, we estimate the focal depths of 11 and 5 km
assessment is applied to all stations to prevent systematic errors for the 2017 and 2018 earthquakes, respectively. We find similar
in the moment tensor solutions due to sensor misorientations results for different arrays (see Supplementary Figures 8, 9). The
(Büyükakpınar et al., 2021). An example of waveform fits obtained focal depths are compatible with the hypocentral depths
and MT solution is illustrated in Figure 5. Additionally, the given in the seismic catalogs.
waveform fits and MT solution are shown for the Mw 5.1 2018
earthquake in the Supplementary Figures 6, 7. The full moment
tensor decomposition (ISO-CLVD-DC) components show a RESERVOIR-INDUCED STRESS
relatively large CLVD component, 17 and 41% for 2017 and CHANGES
2018 earthquakes, respectively. Furthermore, moment tensors for
66 weaker events down to M 2.8 were calculated, applying a We calculate the reservoir-related variations of the Coulomb-
simplified double couple representation and frequency band of Failure Stress (CFS) relative to the initial stress state at the
0.06–0.11 Hz. This is possible due to the presence of the densified beginning of the water impoundment. For that purpose, we
networks in the area after 2017. All obtained source parameters assume a uniform and isotropic half-space and represent the
are listed in Supplementary Table 2. Figure 6 shows the result Atatürk Reservoir by 246-point sources covering the reservoir
of all focal mechanisms. Most of the solutions are characterized surface (see Supplementary Figure 10). In particular, we
by strike-slip mechanisms with relatively shallow centroid depths calculate the stress induced by the water load using Boussinesq-
(Büyükakpınar et al. Reservoir-Triggered Earthquakes Atatürk Dam FIGURE 5 | Waveform fits in the time domain for the 2017-08-31 (UTC) 16:11:09 M 3.1 earthquake. Red and gray waveforms represent synthetic and observed records, respectively. The fuzzy MT shows the solution with its uncertainties (see also Supplementary Figures 6, 7). is unloaded at all depth layers due to water load. This means that the predominant mechanism because the related increase of the all faults with the mainshock mechanism are firstly stabilized by pore-pressure diffusion is delayed. This can also explain the the reservoir impoundment. As a counterpart, the pore-pressure decreased seismicity rate at peaks of the water levels. diffusion leads to an increase of stress with time, but with some While the stabilization effect is found to dominate in the delay depending on the distance to the reservoir and the value short-term, pore-pressure diffusion leads to an increase of the of diffusivity (D). The stabilization effect of the water loading effective stress with time. This is demonstrated in Figure 10A, can explain the observed anti-correlation between water-level where the total Coulomb stress is calculated for three different and seismicity rate. A sudden increase of the water-level leads values of the hydraulic diffusivity (D = 0.05, 0.1, and 1.0 m2 /s) to an immediate reduction of the CFS-value on the faults with at 5 km depth in the three locations marked in Figure 9. Frontiers in Earth Science | www.frontiersin.org 8 June 2021 | Volume 9 | Article 663385
Büyükakpınar et al.                                                                                                  Reservoir-Triggered Earthquakes Atatürk Dam

  FIGURE 6 | (A) Focal mechanism solutions for 68 events that occurred between 2017 and 2020. The recorded epicenters are color-coded in time. The red lines
  show the faults with their slip direction. (B) The cross-section of the (A-B) profile in the study area showing the centroid depths mostly less than 6 km.

All curves firstly show negative values, but later a crossover                         The simplest seismicity model, which builds on CFS-values,
to positive values is observed, after which induced seismicity                      assumes that the number of earthquakes is proportional to the
might be expected. The time of this crossover is strongly                           stress change, if it is positive, while no triggering is expected
dependent on the assumed D-value and the distance to the                            for negative changes. Furthermore, considering stress shadowing
reservoir. For the location beneath the reservoir (blue cross                       (Kaiser effect), the model only assumes triggering if the absolute
in Figure 9 and blue lines in Figure 10), it already occurs                         stress exceeds all precursory values. Thus the seismicity rate
between 1993 and 2000 for D-values in the range between                             R(t) is proportional to the stressing rate, R(t)∼d/dt CFS(t), if
0.05 and 1 m2 /s. At the farthest distance (green cross) and                        CFS(t) > max (CFS (time < t)), otherwise R(t) = 0.
smallest D-value (dashed line), it occurs only in 2016. Overall, the                   The cumulative number of events becomes simply N(t) ∼ max
general increase due to the pore-pressure diffusion is modulated                    (CFS (time ≤ t)).
by the instantaneous stress changes induced by changes in                              Based on this model, we calculate the expected number of
the water level.                                                                    events in the three locations marked in Figure 9. In Figure 10B,

Frontiers in Earth Science | www.frontiersin.org                                9                                            June 2021 | Volume 9 | Article 663385
Büyükakpınar et al.                                                                                                        Reservoir-Triggered Earthquakes Atatürk Dam

  FIGURE 7 | Aftershocks of March 2, 2017, Mw 5.5 earthquake: (A) Spatial distribution of the first ten-day aftershocks, which were directly triggered by the
  mainshock according to the declustering method (green points), and all aftershocks occurred within the first day (blue points). The epicenter of the mainshock is
  marked by the star. (B) Rose diagram of the directions of the same events relative to the mainshock location, where the preferred strike value of the mainshock focal
  mechanism is marked as a dashed black line.

  FIGURE 8 | (A,B) Modeled teleseismic depth phases for the BCA array for different assumed source depth and fixed source mechanism (black lines). For the
  modeling of the source side crust, we use the velocity model (see Supplementary Figure 5 and Table 1) which we have obtained using PyVelest. Stacked array
  beams (blue lines) are seen consistent with synthetics for a depth of 11 and 5 km in the case of the Mw 5.5 2017 earthquake (A) and the Mw 5.1 2018 earthquake
  (B), respectively.

the result is shown for the cumulative number of earthquakes                               For the case of D = 0.1 m2 /s and a depth of 5 km, we
N(t) in the case of three different D-values (0.05, 0.1, and 1 m2 /s),                  also calculate the CFS-values on a spatial grid at different time
where we arbitrarily set the proportionality factor to 1. We cannot                     points. Figure 11 (left column) shows the total CFS-stress in our
compare this model prediction pointwise with observations due                           study area at the beginning of 2010, 2015, and 2020, respectively.
to the limited number of recorded events. Thus, the shape of the                        Southwest of the dam, including the Bozova fault, the total CFS
resulting curves is compared to the evolution of the cumulative                         values remain negative for the whole period, and no earthquakes
number of the homogeneously recorded M ≥ 2.8 background                                 with the mainshock mechanism are expected; only a few events
events in the whole region after 2004 (gray line). Despite some                         are observed in this region. On the other hand, the highest
variations depending on the location and chosen D-value, the                            stresses of about 0.7 bar occur just beneath the centers of the
shapes have a similar tendency, with a steep increase in the first                      two arms of the lake, while the absolute value is slightly smaller
period and a flattening in the later period.                                            (approximately 0.4 bar) in the Samsat region, where the two

Frontiers in Earth Science | www.frontiersin.org                                   10                                             June 2021 | Volume 9 | Article 663385
Büyükakpınar et al.                                                                                                              Reservoir-Triggered Earthquakes Atatürk Dam

  FIGURE 9 | Stress changes due to reservoir loading (60 m water column) ignoring fluid diffusion and calculated for receiver faults with the orientation of the 2017 Mw
  5.5 mainshock mechanism (strike = 313.5◦ , dip = 64.3◦ , rake = 173.1◦ ). Contour lines refer to stress values in units of MPa. Points refer to M ≥ 2.8 earthquakes
  (black = background, gray = aftershocks) in the depth range indicated in each title line. The colored crosses mark the three locations for which Figure 10 shows the
  total stress history, including pore pressure changes.

  FIGURE 10 | (A) Time evolution of the total Coulomb stress calculated at the three locations indicated in Figure 9 at 5 km depth, assuming the mainshock
  mechanism as a receiver. The colors of the lines refer to the location, while the line style refers to different diffusivity values (see legend); (B) Temporal increase of the
  maximum CFS value relative to the year 2004 (for the same cases). Note that the number of triggered events should be proportional to these curves at the given
  location according to the simple CFS-model. For comparison, the cumulative events of the recorded M ≥ 2.8 background events in the whole area are shown by the
  bold gray line (with a scale on the right).

Frontiers in Earth Science | www.frontiersin.org                                       11                                                June 2021 | Volume 9 | Article 663385
Büyükakpınar et al.                                                                                                        Reservoir-Triggered Earthquakes Atatürk Dam

  FIGURE 11 | Left column: contour lines of the total CFS-stress [kPa] at the year 2010 (top), 2015 (middle), and 2020 (bottom), calculated for the mainshock
  mechanism at a depth of 5 km and D = 0.1 m2 /s. Right column: increase of the maximum CFS value in the period 2005–2010 (top), 2010–2015 (middle), and
  2015–2020 (bottom), which is proportional to the number of triggered earthquakes according to the simple CFS-model. For comparison, the epicenters of
  earthquakes (M ≥ 2.8, black = declustered, gray = aftershocks) recorded in the corresponding time intervals are plotted. In the bottom row, the star refers to the
  2017 Mw 5.5 mainshock.

Frontiers in Earth Science | www.frontiersin.org                                   12                                             June 2021 | Volume 9 | Article 663385
Büyükakpınar et al.                                                                                       Reservoir-Triggered Earthquakes Atatürk Dam

largest earthquakes occurred in 2017 and 2018. The earthquake                along the Samsat fault, which has been known but not
probability depends not on the absolute value, but the stress                considered as an active fault in Turkey’s current faults map
increases according to the simple CFS-model, which is shown                  (Emre et al., 2018).
in the right column of Figure 11. The contour lines show that                   Induced gravitational stress due to surface loading/unloading
this increase just focused on the Samsat region in the period                can favor or inhibit normal faulting and thrust faulting (Simpson,
of the mainshocks.                                                           1986) but is expected to have only a small direct influence
                                                                             on vertical strike-slip faults. However, dipping fault planes
                                                                             increase the impact of the water loading also for strike-slip
DISCUSSION                                                                   events. The dip of the 2017 Mw 5.5 Samsat earthquake is
                                                                             estimated to be 64.3◦ . Furthermore, pore pressure transients
Based on the combined catalog from regional networks in this                 in response to water loading favor the occurrence of any
study, the seismicity rate increases in the AR region between                faulting type with some delay depending on distance and
1990 and 2020. However, it should be noted that the seismic                  hydraulic diffusivity.
network was sparse before the impoundment and only improved                     The joint interpretation of the temporal evolution of water
with time. On the other hand, the estimated magnitude of                     level and seismicity rate is crucial to identifying seismicity
completeness (MC ) decreased from 3.5 in the beginning to                    simulated by water reservoir operations and understanding its
approximately 1.95 after 2017 because of the seismic network’s               spatio-temporal evolution. Water level and seismicity rate have
densification in the reservoir area. Nevertheless, considering only          been analyzed here through a declustering method, resolving
the complete part of the catalog (M ≥ 3.5) indicates a significant           a clear anti-correlation between water level and seismicity by
activation of seismicity after the reservoir filling. Besides the            using recent additional datasets. This pattern was firstly observed
changes in the seismicity rate, the shape of the magnitude                   by Eyidoğan et al. (2010), by comparing earthquakes between
distribution also changed with time. The estimated b-value                   1992 and 2009 with the water level information obtained by
successively decreased from a high value of 1.8 in the period                DSI. However, Kartal and Kadirioğlu (2019) found no evidence
of 2004–2012, to 1.4 in 2012–2017, and finally to 0.9 in 2017–               of any correlation between water load and earthquake activity
2021, respectively. According to field and lab experiments, this             pointing to induced/triggered seismicity; this might result from
significant b-value decrease may be explained by an increase in              the fact that they analyzed and correlated seismicity and water
stress in the AR region (Schorlemmer et al., 2005; Scholz, 2015).            level only for short periods, such as three months sequences
    Our moment tensor solutions for 68 earthquakes, including                in the intervals of August-October, 2008 and February–April,
the largest earthquakes and aftershocks down to M 2.8, indicate a            2017. Analyzing too short periods does not allow to resolve
clear dominance of strike-slip mechanisms that are in agreement              correlations whenever the triggering mechanism requires a
with the results of previous studies (e.g., Eyidoğan et al.,                considerable temporal delay. Our study reveals a correlation
2010; Kartal and Kadirioğlu, 2019; Irmak et al., 2020). The                 between reservoir impoundment and triggered seismicity, which
estimated mechanisms are consistent with the regional stress                 is attempted to discriminate from the induced seismicity here,
field (Figures 1, 6). The spatial distribution of early aftershocks          in a more extended data period. We can particularly explain
suggests that the NW-SE fault orientation is the causative fault             this anti-correlation by the immediate stabilization effect of
plane, which is in general agreement with the strike of the faults in        the surface water load on the dominant rupture mechanism of
the region (e.g., the Bozova and Samsat faults). In particular, the          regional crustal faults.
Samsat fault is most probably responsible for the 2017 and 2018                 On the other hand, we show that pore-pressure diffusion
earthquake sources, as previously indicated by Irmak et al. (2020).          increased the effective stress with time, leading to positive
Furthermore, the MT solutions in this study reveal shallow                   total stresses and fault destabilization, explaining the observed
centroid depths mostly below 6 km. Shallow source depths are                 seismicity in the proximity of the Samsat fault where the
also estimated in the study of Irmak et al. (2020). Our full moment          estimated total stress is high, and the two largest events occurred
tensor results also show relatively large CLVD components, 17                in 2017 and 2018. Interestingly, the Bozova fault in the SW of the
and 41% for 2017 and 2018 earthquakes, respectively. Shallow                 reservoir area remains so far in the stress shadow, which agrees
source depths and the percentage of non-double components also               with the low seismic activity observed in this region.
support the triggering mechanism in the study area.
    The focal depths of the largest 2017 and 2018 events
(11 and 5 km, respectively) are independently confirmed                      CONCLUSION
using an accurate array beam technique. Shallow focal depths
(
Büyükakpınar et al. Reservoir-Triggered Earthquakes Atatürk Dam
The local seismicity rate has substantially increased after (EDSF; http://diss.rm.ingv.it/share-edsf; last accessed September
constructing the dam and its impoundment, which began in 1990. 2020). Some of the maps were prepared using the Pyrocko
Despite the overall seismicity increase, our analysis confirms a toolbox (https://pyrocko.org) and GMT software (http://gmt.
clear anti-correlation among seismicity rate and water level on soest.hawaii.edu). The topography data were obtained from https:
shorter time scales, which was so far debated (Eyidoğan et al., //topex.ucsd.edu/WWW_html/srtm15_plus.html (last accessed
2010; Kartal and Kadirioğlu, 2019). Our stress calculations show May 2020). Bathymetry data were taken from https://www.gebco.
that the anti-correlation can be explained by the stabilization net/data_and_products/gridded_bathymetry_data (last accessed
effect of the water load, while the overall seismicity activation May 2020).
is attributed to pore pressure diffusion. We also observe a
significant b-value decrease with time after the impoundment
operations with a reduction from 1.8 in 2004 to 0.9 in 2020, AUTHOR CONTRIBUTIONS
suggesting a progressive increase of the effective stresses due to
increased pore pressure. Furthermore, moment tensor solutions All the authors contributed to the work and discussed the results
show that the NW-SE oriented strike-slip mechanism, which is presented in this manuscript. All the authors performed the
compatible with the general trend of the existing tectonic regime, investigation and research.
is dominant in the dam area.
Our analysis provides strong indications that the observed
seismicity is partly triggered by the impounding of the Atatürk FUNDING
Reservoir based on the data consisting of seismicity, source
mechanisms, and long-term water level information (2002–2020) This study was supported by the International Training
which is not previously taken into account in other studies. Course “Seismology and Seismic Hazard Assessment” which
This work shows how combining accurate seismicity analysis, has been funded by the GeoForschungsZentrum Potsdam
stress estimations, and statistical approaches helps to better (GFZ) and the German Federal Foreign Office through
discriminate and understand reservoir-triggered seismicity. Our the German Humanitarian Assistance program, grant S08-60
results provide a solid base to assess the seismic hazard near the 321.50 ALL 03/19.
Atatürk Dam in Turkey.
ACKNOWLEDGMENTS
DATA AVAILABILITY STATEMENT We would like to thank Haluk Eyidoğan for his inspiration in this
study. We are very grateful to Mustafa Aktar and Mohammad
All seismic and satellite altimetry data used in this study are Mohseni Aref for constructive discussion and comments on
free and open access to users via the International Federation this work. We also thank Claus Milkereit and Dorina Kroll.
of Digital Seismograph Networks (FDSN) client code (KO; We also thank the editor AR and the reviewers SP and LV
https://doi.org/10.7914/SN/KO) in the databases of the Boğaziçi for their valuable comments and suggestions that helped us to
University Kandilli Observatory and Earthquake Research improve the article.
Institute (KOERI; http://eida.koeri.boun.edu.tr; last accessed
September 2020), the Disaster and Emergency Management
Authority (AFAD; https://tdvms.afad.gov.tr; last accessed SUPPLEMENTARY MATERIAL
September 2020), and the Database for Hydrological Time
Series of Inland Waters (DAHITI; https://dahiti.dgfi.tum.de/en/; The Supplementary Material for this article can be found
last accessed September 2020). Active faults in the region online at: https://www.frontiersin.org/articles/10.3389/feart.
were taken from the European Database of Seismogenic Faults 2021.663385/full#supplementary-material
REFERENCES Baiesi, M., and Paczuski, M. (2005). Complex networks of earthquakes and
aftershocks. Nonlinear Process. Geophy. 12, 1–11. doi: 10.5194/npg-12-1-
Acarel, D., Cambaz, M. D., Turhan, F., Mutlu, A. K., and Polat, R. (2019). 2005
Seismotectonics of Malatya Fault, Eastern Turkey. Open Geosci. 11, 1098–1111. Basili, R., Kastelic, V., Demircioglu, M. B., Garcia Moreno, D., Nemser, E. S.,
doi: 10.1515/geo-2019-0085 Petricca, P., et al. (2013). The European Database of Seismogenic Faults (EDSF)
Ambraseys, N. N. (1989). Temporary seismic quiescence: SE Turkey. Geophys. J. Compiled in the Framework of the Project SHARE. Available online at: http:
Int. 96, 311–331. doi: 10.1111/j.1365-246X.1989.tb04453.x //diss.rm.ingv.it/share-edsf/ (accessed September 2020). doi: 10.6092/INGV.
Ambraseys, N. N., and Jackson, J. A. (1998). Faulting associated with historical and IT-SHARE-EDSF
recent earthquakes in the Eastern Mediterranean region. Geophys. J. Int. 133, Bassin, C., Laske, G., and Masters, G. (2000). The current limits of resolution for
390–406. doi: 10.1046/j.1365-246X.1998.00508.x surface wave tomography in North America. EOS Trans. AGU 81:F897.
Arpat, E., and Şaroğlu, F. (1972). The east anatolian fault system: thoughts on its Bird, P. (2003). An updated digital model of plate boundaries. Geochem. Geophys.
development. Bull. Miner. Res. Explor. Inst. Turkey 78, 33–39. Geosyst. 4:1027. doi: 10.1029/2001GC000252
Baiesi, M., and Paczuski, M. (2004). Scale-free networks of earthquakes and Braun, T., Caciagli, M., Carapezza, M. L., Famiani, D., Gattuso, A., Lisi, A., et al.
aftershocks. Phys. Revi. E 69:066106. doi: 10.1103/PhysRevE.69.066106 (2018). The seismic sequence of 30th May–9th June 2016 in the geothermal
Frontiers in Earth Science | www.frontiersin.org 14 June 2021 | Volume 9 | Article 663385Büyükakpınar et al. Reservoir-Triggered Earthquakes Atatürk Dam
site of Torre Alfina (central Italy) and related variations in soil gas emissions. Eyidoğan, H., Geçgel, V., and Pabuçcu, Z. (2010). “Correlation between water
J. Volcanol. Geothermal Res. 359, 21–36. doi: 10.1016/j.jvolgeores.2018.06.005 level decrease in Atatürk Dam, Turkey and Mw5.0 earthquake on September
Büyükakpınar, P., Aktar, M., Petersen, G. M., and Köseoğlu, A. (2021). Orientations 3, 2008,” in Proceedings ESC 2010, 6-10 September 2010, Montpellier, 61.
of broadband stations of the KOERI seismic network (Turkey) from two Foulger, G. R., Wilson, M. P., Gluyas, J. G., Julian, B. R., and Davies, R. J. (2018).
independent methods: P- and rayleigh-wave polarization. Seismol. Res. Lett. 92, Global review of human-induced earthquakes. Earth Sci. Rev. 178, 438–514.
1512–1521. doi: 10.1785/0220200362 doi: 10.1016/j.earscirev.2017.07.008
Carder, D. S. (1945). Seismic investigations in the Boulder Dam area, 1940-1944, Gaebler, P., Ceranna, L., Nooshiri, N., Barth, A., Cesca, S., Frei, M., et al. (2019).
and the influence of reservoir loading on local earthquake activity. Bull. Seismol. A multi-technology analysis of the 2017 North Korean nuclear test. Solid Earth
Soc. Am. 35, 175–192. 10, 59–78. doi: 10.5194/se-10-59-2019
Cesca, S., Braun, T., Maccaferri, F., Passarelli, L., Rivalta, E., and Dahm, T. (2013a). Gahalaut, K., and Hassoup, A. (2012). Role of fluids in the earthquake occurrence
Source modelling of the M5–6 Emilia-Romagna, Italy, earthquakes (2012 May around Aswan reservoir, Egypt. J. Geophys. Res. 117, 2303. doi: 10.1029/
20–29). Geophys. J. Int. 193, 1658–1672. doi: 10.1093/gji/ggt069 2011JB008796
Cesca, S., Grigoli, F., Heimann, S., González, Á, Buforn, E., Maghsoudi, S., et al. Gaite, B., Ugalde, A., Villaseñor, A., and Blanch, E. (2016). Improving the location
(2014). The 2013 September–October seismic sequence offshore Spain: a case of induced earthquakes associated with an underground gas storage in the Gulf
of seismicity triggered by gas injection? Geophys. J. Int. 198, 941–953. doi: of Valencia (Spain). Phys. Earth Planet. Interiors 254, 46–59. doi: 10.1016/j.pepi.
10.1093/gji/ggu172 2016.03.006
Cesca, S., Letort, J., Razafindrakoto, H. N. T., Heimann, S., Rivalta, E., Isken, M. P., Ge, S., Liu, M., Lu, N., Godt, J. W., and Luo, G. (2009). Did the zipingpu reservoir
et al. (2020). Drainage of a deep magma reservoir near Mayotte inferred from trigger the 2008 wenchuan earthquake? Geophys. Res. Lett. 36:L20315. doi:
seismicity and deformation. Nat. Geosci. 13, 87–93. doi: 10.1038/s41561-019- 10.1029/2009GL040349
0505-5 González, P. J., Tiampo, K. F., Palano, M., Cannavó, F., and Fernández, J. (2012).
Cesca, S., Rohr, A., and Dahm, T. (2013b). Discrimination of induced seismicity The 2011 Lorca earthquake slip distribution controlled by groundwater crustal
by full moment tensor inversion and decomposition. J. Seismol. 17, 147–163. unloading. Nat. Geosci. 5, 821–825. doi: 10.1038/ngeo1610
doi: 10.1007/s10950-012-9305-8 Grigoli, F., Cesca, S., Priolo, E., Rinaldi, A. P., Clinton, J. F., Stabile,
Çetin, H., Laman, M., and Ertunç, A. (2000). Settlement and slaking problems in T. A., et al. (2017). Current challenges in monitoring, discrimination, and
the world’s fourth largest rock-fill dam, the Ataturk Dam in Turkey. Eng. Geol. management of induced seismicity related to underground industrial activities:
56, 225–242. doi: 10.1016/S0013-7952(99)00049-6 a European perspective. Rev. Geophys. 55, 310–340. doi: 10.1002/2016RG00
Dahm, T., Becker, D., Bischoff, M., Cesca, S., Dost, B., Fritschen, R., et al. 0542
(2013). Recommendation for the discrimination of human-related and natural Grigoli, F., Cesca, S., Rinaldi, A. P., Manconi, A., López-Comino, J. A., Clinton,
seismicity. J. Seismol. 17, 197–202. doi: 10.1007/s10950-012-9295-6 J. F., et al. (2018). The November 2017 Mw 5.5 Pohang earthquake: a possible
Dahm, T., Cesca, S., Hainzl, S., Braun, T., and Krüger, F. (2015). Discrimination case of induced seismicity in South Korea. Science 360, 1003–1006. doi: 10.1126/
between induced, triggered, and natural earthquakes close to hydrocarbon science.aat2010
reservoirs: a probabilistic approach based on the modeling of depletion-induced Gupta, H. K. (1992). Reservoir-Induced Earthquakes. Amsterdam: Elsevier, 364.
stress changes and seismological source parameters. J. Geophys. Res. Solid Earth Gupta, H. K. (2002). A review of recent studies of triggered earthquakes by artificial
120, 2491–2509. doi: 10.1002/2014JB011778 water reservoirs with special emphasis on earthquakes in Koyna, India. Earth
Dahm, T., Hainzl, S., Becker, D., Bisschoff, M., Cesca, S., Dost, B., et al. (2010). Sci. Rev. 58, 279–310. doi: 10.1016/S0012-8252(02)00063-6
“How to discriminate induced, triggered, and natural seismicity,” in Proceedings Gupta, H. K., and Rastogi, B. K. (1976). Dams and Earthquakes. Amsterdam:
of the Workshop Induced seismicity: November 15 - 17, 2010, (Walferdange: Elsevier, 229.
Centre Européen de Géodynamique et de Séismologie), 69–76. Hainzl, S., Aggarwal, S. K., Khan, P. K., and Rastogi, B. K. (2015). Monsoon-
Dahm, T., Heimann, S., Funke, S., Wendt, S., Rappsilber, I., Bindi, D., et al. (2018). induced earthquake activity in Talala, Gujarat, India. Geophys. J. Int. 200,
Seismicity in the block mountains between Halle and Leipzig, Central Germany: 627–637. doi: 10.1093/gji/ggu421
centroid moment tensors, ground motion simulation, and felt intensities of two Havskov, J., and Ottemöller, L. (1999). SeisAn earthquake analysis software.
M ≈3 earthquakes in 2015 and 2017. J. Seismol. 22, 985–1003. doi: 10.1007/ Seismol. Res. Lett. 70, 532–534. doi: 10.1785/gssrl.70.5.532
s10950-018-9746-9 Heimann, S., Isken, M., Kühn, D., Sudhaus, H., Steinberg, A., Daout, S., et al.
Davies, R., Foulger, G., Bindley, A., and Styles, P. (2013). Induced seismicity and (2018). Grond—A Probabilistic Earthquake Source Inversion Framework. V. 1.0.
hydraulic fracturing for the recovery of hydrocarbons. Mar. Pet. Geol. 45, Potsdam: GFZ Data Services, doi: 10.5880/GFZ.2.1.2018.003
171–185. doi: 10.1016/j.marpetgeo.2013.03.016 Heimann, S., Kriegerowski, M., Isken, M., Cesca, S., Daout, S., Grigoli, F.,
Deng, K., Zhou, S., Wang, R., Robinson, R., Zhao, C., and Cheng, W. (2010). et al. (2017). Pyrocko—An open-source seismology toolbox and library. V. 0.3.
Evidence that the 2008 Mw 7.9 Wenchuan earthquake could not have been Potsdam: GFZ Data Services, doi: 10.5880/GFZ.2.1.2017.001
induced by the Zipingpu reservoir. Bull. Seismol. Soc. Am. 100, 2805–2814. Irmak, T. S., Bulut, I., and Doğan, B. (2020). Regional seismicity in
doi: 10.1785/0120090222 Adıyaman – Samsat (SE Turkey). Boll. Geofisica Teorica ed. J. 61,
Disaster and Emergency Management Authority (AFAD). (1990). Turkish National 451–468.
Seismic Network [Data set]. Department of Earthquake, Disaster and Emergency Jamalreyhani, M., Büyükakpınar, P., Cesca, S., Dahm, T., Sudhaus, H., Rezapour,
Management Authority. Available online at: https://doi.org/10.7914/SN/TU M., et al. (2020). Seismicity related to the eastern sector of anatolian escape
(accessed September 2020). tectonic: the example of the 24 January 2020 Mw 6.77 Elazığ-Sivrice earthquake.
Dost, B., Stiphout, A., van Kühn, D., Kortekaas, M., Ruigrok, E., and Heimann, Solid Earth Discussions 1–22. doi: 10.5194/se-2020-55
S. (2020). Probabilistic moment tensor inversion for hydrocarbon-induced Jamalreyhani, M., Pousse-Beltran, L., Büyükakpınar, P., Cesca, S., Nissen, E.,
seismicity in the groningen gas field, the netherlands, Part 2: application. Bull. Ghods, A., et al. (2021). The 2019-2020 Khalili (Iran) Earthquake Sequence—
Seismol. Soc. Am. 110, 2112–2123. doi: 10.1785/0120200076 Anthropogenic Seismicity in the Zagros Simply Folded Belt? [Preprint]. Earth and
Duman, T. Y., and Emre, Ö. (2013). The east anatolian fault: geometry, Space Science Open Archive. Available online at: http://www.essoar.org/doi/10.
segmentation and jog characteristics. Geol. Soc. Lond. Special Publ. 372, 495– 1002/essoar.10506454.1 (accessed April 2021).
529. doi: 10.1144/SP372.14 Jamalreyhani, M., Rezapour, M., Cesca, S., Heimann, S., Vasyura-Bathke, H.,
Ellsworth, W. L. (2013). Injection-induced earthquakes. Science 341, 1225942. doi: Sudhaus, H., et al. (2019). The 2017 November 12 Mw 7.3 Sarpol-Zahab
10.1126/science.1225942 (Iran-Iraq border region) Earthquake: Source Model, Aftershock Sequence and
Emre, Ö, Duman, T. Y., Özalp, S., Şaroğlu, F., Olgun, Ş, Elmacı, H., et al. (2018). Earthquakes Triggering, EGU General Assembly 2020, Online, 4–8 May 2020,
Active fault database of Turkey. Bull. Earthq. Eng. 16, 3229–3275. doi: 10.1007/ EGU2020-759. Available online at: https://doi.org/10.5194/egusphere-egu2020-
s10518-016-0041-2 759 (accessed September 2020).
Frontiers in Earth Science | www.frontiersin.org 15 June 2021 | Volume 9 | Article 663385Büyükakpınar et al. Reservoir-Triggered Earthquakes Atatürk Dam Juanes, R., Jha, B., Hager, B. H., Shaw, J. H., Plesch, A., Astiz, L., et al. (2016). Reilinger, R., McClusky, S., Vernant, P., Lawrence, S., Ergintav, S., Cakmak, Were the May 2012 emilia-romagna earthquakes induced? a coupled flow- R., et al. (2006). GPS constraints on continental deformation in the Africa- geomechanics modeling assessment. Geophys. Res. Lett. 43, 6891–6897. doi: Arabia-Eurasia continental collision zone and implications for the dynamics 10.1002/2016GL069284 of plate interactions. J. Geophys. Res. 111:B05411. doi: 10.1029/2005JB00 Kandilli Observatory and Earthquake Research Institute, Boğaziçi University 4051 (KOERI) (1971). Bogazici University Kandilli Observatory and Earthquake Richter, G., Hainzl, S., Dahm, T., and Zöller, G. (2020). Stress-based, Research Institute [Data set]. Istanbul: International Federation of Digital statistical modeling of the induced seismicity at the Groningen gas field, Seismograph Networks, doi: 10.7914/SN/KO The Netherlands. Environ. Earth Sci. 79, 252. doi: 10.1007/s12665-020-08 Kartal, R. F., and Kadirioğlu, F. T. (2019). Impact of regional tectonic and water 941-4 stress on the seismicity in Ataturk Dam Basin: Southeast of Turkey. J. Seismol. Rinaldi, A. P., Improta, L., Hainzl, S., Catalli, F., Urpi, L., and Wiemer, S. (2020). 23, 699–714. doi: 10.1007/s10950-019-09830-5 Combined approach of poroelastic and earthquake nucleation applied to the Keranen, K. M., Savage, H. M., Abers, G. A., and Cochran, E. S. (2013). Potentially reservoir-induced seismic activity in the Val d’Agri area, Italy. J. Rock Mechan. induced earthquakes in Oklahoma, USA: Links between wastewater injection Geotech. Eng. 12, 802–810. doi: 10.1016/j.jrmge.2020.04.003 and the 2011 Mw 5.7 earthquake sequence. Geology 41, 699–702. doi: 10.1130/ Roeloffs, E. A. (1988). Fault stability changes induced beneath a reservoir with G34045.1 cyclic variations in water level. J. Geophys. Res. Solid Earth 93, 2107–2124. Keranen, K. M., Weingarten, M., Abers, G. A., Bekins, B. A., and Ge, S. doi: 10.1029/JB093iB03p02107 (2014). Sharp increase in central Oklahoma seismicity since 2008 induced by Ruiz-Barajas, S., Santoyo, M. A., Benito Oterino, M. B., Alvarado, G. E., and massive wastewater injection. Science 345, 448–451. doi: 10.1126/science.125 Climent, A. (2019). Stress transfer patterns and local seismicity related to 5802 reservoir water-level variations. A case study in central Costa Rica. Sci. Rep. Kim, K.-H., Ree, J.-H., Kim, Y., Kim, S., Kang, S. Y., and Seo, W. (2018). Assessing 9:5600. doi: 10.1038/s41598-019-41890-y whether the 2017 Mw 5.4 Pohang earthquake in South Korea was an induced Şahbaz, N., and Seyitoğlu, G. (2018). The neotectonics of NE Gaziantep: the Bozova event. Science 360, 1007–1009. doi: 10.1126/science.aat6081 and Halfeti strike-slip faults and their relationships with blind thrusts, Turkey. Kissling, E., Ellsworth, W. L., Eberhart-Phillips, D., and Kradolfer, U. (1994). Initial Bull. Miner. Res. Explor. 156, 17–40. reference models in local earthquake tomography. J. Geophys. Res. Solid Earth Scholz, C. H. (2015). On the stress dependence of the earthquake b value. Geophys. 99, 19635–19646. doi: 10.1029/93JB03138 Res. Lett. 42, 1399–1402. doi: 10.1002/2014GL062863 Kühn, D., Heimann, S., Isken, M. P., Ruigrok, E., and Dost, B. (2020). Probabilistic Schorlemmer, D., Wiemer, S., and Wyss, M. (2005). Variations in earthquake-size moment tensor inversion for hydrocarbon-induced seismicity in the groningen distribution across different stress regimes. Nature 437, 539–542. doi: 10.1038/ gas field, the Netherlands, Part 1: testing. Bull. Seismol. Soc. Am. 110, 2095–2111. nature04094 doi: 10.1785/0120200099 Schwatke, C., Dettmering, D., Bosch, W., and Seitz, F. (2015). DAHITI – an Lizurek, G., Wiszniowski, J., Giang, N. V., Van, D. Q., Dung, L. V., Tung, V. D., innovative approach for estimating water level time series over inland waters et al. (2019). Background seismicity and seismic monitoring in the Lai Chau using multi-mission satellite altimetry. Hydrol. Earth Syst. Sci. 19, 4345–4364. reservoir area. J. Seismol. 23, 1373–1390. doi: 10.1007/s10950-019-09875-6 doi: 10.5194/hess-19-4345-2015 López-Comino, J. Á, Braun, T., Dahm, T., Cesca, S., and Danesi, S. (2021). On Şengör, A. M. C., Görür, N., and Şaroğlu, F. (1985). “Strike-slip faulting and related the source parameters and genesis of the 2017, Mw 4 montesano earthquake basin formation in zones of tectonic escape: Turkey as a case study,” in Strike- in the outer border of the Val d’Agri Oilfield (Italy). Front. Earth Sci. 8:617794. slip Deformation, Basin Formation and Sedimentation, Vol. 37, eds K. T. Biddle doi: 10.3389/feart.2020.617794 and N. Christie- Blick (Society of Economic Mineralogist and Paleontologists Manga, M., Wang, C.-Y., and Shirzaei, M. (2016). Increased stream discharge after Special), 227–264. doi: 10.2110/pec.85.37.0211 the 3 September 2016 Mw 5.8 Pawnee, Oklahoma earthquake. Geophys. Res. Şengör, A. M. C., and Yılmaz, Y. (1981). Tethyan evolution of Turkey a plate Lett. 43, 11588–11594. doi: 10.1002/2016GL071268 tectonic approach. Tectonophysics 75, 181–241. Martínez-Díaz, J. J., Bejar-Pizarro, M., Álvarez-Gómez, J. A., Mancilla, F., de, L., Shapiro, S. A., Krüger, O. S., and Dinske, C. (2013). Probability of inducing given- Stich, D., et al. (2012). Tectonic and seismic implications of an intersegment magnitude earthquakes by perturbing finite volumes of rocks. J. Geophys. Res. rupture: the damaging May 11th 2011 Mw 5.2 Lorca, Spain, earthquake. 118, 3557–3575. doi: 10.1002/jgrb.50264 Tectonophysics 546–547, 28–37. doi: 10.1016/j.tecto.2012.04.010 Simpson, D. W. (1986). Triggered Earthquakes. Annu. Rev. Earth Planet. Sci. 14, McClusky, S., Balassanian, S., Barka, A., Demir, C., Ergintav, S., Georgiev, I., et al. 21–42. doi: 10.1146/annurev.ea.14.050186.000321 (2000). Global positioning system constraints on plate kinematics and dynamics Simpson, D. W., Leith, W. S., and Scholz, C. H. (1988). Two types of reservoir- in the eastern mediterranean and caucasus. J. Geophys. Res. Solid Earth 105, induced seismicity. Bull. Seismol. Soc. Am. 78, 2025–2040. 5695–5719. doi: 10.1029/1999JB900351 Soysal, H., Sipahioğlu, S., Kolçak, D., and Altınok, Y. (1981). Earthquake Catalog McGarr, A., and Simpson, D. (1997). “Keynote lecture: a broad look at induced for Turkey and surrounding area (2100 B.C.–1900 A.D.). The Scientific and and triggered seismicity, “Rockbursts and seismicity in mines”,” in Proceeding of Technological Research Council of Turkey, Report Nr: TBAG-341. Ankara: 4th international symposium on rockbursts and seismicity in mines, Poland, 11– The Scientific and Technical Research Council of Turkey (TUBİTAK), 14 August 1997, eds S. J. Gibowicz and S. Lasocki (Rotterdam: A.A. Balkema), 86. 385–396. Tosun, H. (2012). “Re-analysis of ataturk dam under ground shaking by finite McGarr, A., Simpson, D., and Seeber, L. (2002). 40—Case histories of induced and element models,” in Proceedings of the CDA Annual Conference, Saskatoon, SK. triggered seismicity. Int. Geophys. 81A, 647–661. Tosun, H., Zorluer, İ, Orhan, A., Seyrek, E., Türköz, M., and Savaş, H. (2007). McKenzie, D. (1972). Active tectonics of the mediterranean region. Geophys. J. Int. Seismic hazard and total risk analyses for large dams in Euphrates Basin in 30, 109–185. doi: 10.1111/j.1365-246X.1972.tb02351.x Turkey. Eng. Geol. 89, 155–170. MTA (2020). General Directorate of Mineral Research and Exploration. 1:100 Villaseñor, A., Herrmann, R. B., Gaite, B., and Ugalde, A. (2020). Fault reactivation 000 scaled Geological Maps of Turkey, sheet M40-M41, Geological Research by gas injection at an underground gas storage off the east coast of Spain. Solid Department. Ankara: MTA. Earth 11, 63–74. doi: 10.5194/se-11-63-2020 Negi, S. S., Paul, A., Cesca, S., Kamal Kriegerowski, M., Mahesh, P., and Gupta, Walsh, F. R., and Zoback, M. D. (2015). Oklahoma’s recent earthquakes S. (2017). Crustal velocity structure and earthquake processes of Garhwal- and saltwater disposal. Sci. Adv. 1:e1500195. doi: 10.1126/sciadv.150 Kumaun Himalaya: Constraints from regional waveform inversion and array 0195 beam modeling. Tectonophysics 712–713, 45–63. Wilson, M. P., Foulger, G. R., Gluyas, J. G., Davies, R. J., and Julian, B. R. Perinçek, D., Günay, Y., and Kozlu, H. (1987). “New observations on strike- (2017). HiQuake: the human-induced earthquake database. Seismol. Res. Lett. slip faults in east and southeast Anatolia”, in Proceedings 7th Biannual 88, 1560–1565. doi: 10.1785/0220170112 Petroleum Congress of Turkey, UCTEA Chamber of Petroleum Engineers, Yeck, W. L., Hayes, G. P., McNamara, D. E., Rubinstein, J. L., Barnhart, W. D., Turkish Association of Petroleum Geologists, Ankara, 89–103. Earle, P. S., et al. (2017). Oklahoma experiences largest earthquake during Frontiers in Earth Science | www.frontiersin.org 16 June 2021 | Volume 9 | Article 663385
You can also read