The Challenges and Pitfalls of Detecting Sleep Hypopnea Using a Wearable Optical Sensor: Comparative Study
←
→
Page content transcription
If your browser does not render page correctly, please read the page content below
JOURNAL OF MEDICAL INTERNET RESEARCH                                                                                                   Zhang et al

     Original Paper

     The Challenges and Pitfalls of Detecting Sleep Hypopnea Using
     a Wearable Optical Sensor: Comparative Study

     Zhongxing Zhang1,2, PhD; Ming Qi1, MSc; Gordana Hügli1, BSc; Ramin Khatami1,2,3, MD
     1
      Center for Sleep Medicine, Sleep Research and Epileptology, Barmelweid, Switzerland
     2
      Barmelweid Academy, Clinic Barmelweid AG, Barmelweid, Switzerland
     3
      Department of Neurology, Bern University Hospital and University of Bern, Bern, Switzerland

     Corresponding Author:
     Zhongxing Zhang, PhD
     Center for Sleep Medicine
     Sleep Research and Epileptology
     Clinic Barmelweid AG
     Barmelweid, CH-5017
     Switzerland
     Phone: 41 62 857 22 38
     Email: zhongxing.zhang@barmelweid.ch

     Abstract
     Background: Obstructive sleep apnea (OSA) is the most prevalent respiratory sleep disorder occurring in 9% to 38% of the
     general population. About 90% of patients with suspected OSA remain undiagnosed due to the lack of sleep laboratories or
     specialists and the high cost of gold-standard in-lab polysomnography diagnosis, leading to a decreased quality of life and increased
     health care burden in cardio- and cerebrovascular diseases. Wearable sleep trackers like smartwatches and armbands are booming,
     creating a hope for cost-efficient at-home OSA diagnosis and assessment of treatment (eg, continuous positive airway pressure
     [CPAP] therapy) effectiveness. However, such wearables are currently still not available and cannot be used to detect sleep
     hypopnea. Sleep hypopnea is defined by ≥30% drop in breathing and an at least 3% drop in peripheral capillary oxygen saturation
     (Spo2) measured at the fingertip. Whether the conventional measures of oxygen desaturation (OD) at the fingertip and at the arm
     or wrist are identical is essentially unknown.
     Objective: We aimed to compare event-by-event arm OD (arm_OD) with fingertip OD (finger_OD) in sleep hypopneas during
     both naïve sleep and CPAP therapy.
     Methods: Thirty patients with OSA underwent an incremental, stepwise CPAP titration protocol during all-night in-lab
     video-polysomnography monitoring (ie, 1-h baseline sleep without CPAP followed by stepwise increments of 1 cmH2O pressure
     per hour starting from 5 to 8 cmH2O depending on the individual). Arm_OD of the left biceps muscle and finger_OD of the left
     index fingertip in sleep hypopneas were simultaneously measured by frequency-domain near-infrared spectroscopy and
     video-polysomnography photoplethysmography, respectively. Bland-Altman plots were used to illustrate the agreements between
     arm_OD and finger_OD during baseline sleep and under CPAP. We used t tests to determine whether these measurements
     significantly differed.
     Results: In total, 534 obstructive apneas and 2185 hypopneas were recorded. Of the 2185 hypopneas, 668 (30.57%) were
     collected during baseline sleep and 1517 (69.43%), during CPAP sleep. The mean difference between finger_OD and arm_OD
     was 2.86% (95% CI 2.67%-3.06%, t667=28.28; P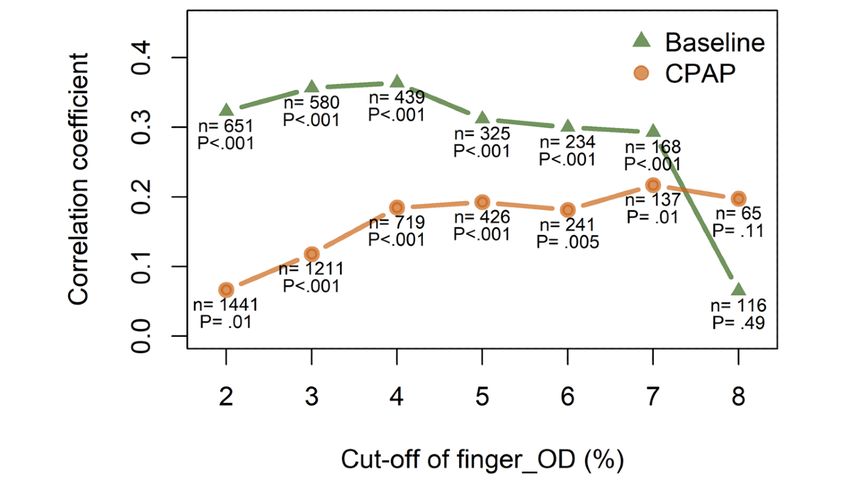
JOURNAL OF MEDICAL INTERNET RESEARCH                                                                                                    Zhang et al

     KEYWORDS
     obstructive sleep apnea; wearable devices; smartwatch; oxygen saturation; near-infrared spectroscopy; continuous positive airway
     pressure therapy; photoplethysmography

                                                                            (OD) at the fingertip and at the arm or wrist are physiologically
     Introduction                                                           identical in sleep hypopneas is essentially unknown. Some
     Monitoring health using wearables, such as smartwatches and            recent smartwatches (eg, Fitbit [26], Garmin [27], Huami [28],
     armbands, is becoming a new lifestyle [1-4]. Hundreds of               and Huawei [29]), armbands (eg, Humon [30,31], Moxy [32,33],
     millions of smartwatches and armbands are being used daily,            PortaMon [34], and Biofourmis [35]), and prototypes [36,37]
     and the number is still sharply increasing. Sleep monitoring is        claim to measure SpO2 or muscle tissue oxygen saturation (StO2)
     one of the most popular functions of such wearables [2,5-7],           at the arm or wrist. However, to the best of our knowledge,
     because sleep is a critical determinant of an individual’s health      these devices have not been clinically validated for use in
     and well-being. Obstructive sleep apnea (OSA) is the most              patients with OSA. We were able to find only one registered
     prevalent respiratory sleep disorder occurring in 9% to 38% of         clinical validation study (Trial Registration: ClinicalTrials.gov
     the general population [8], and it is a high-risk factor for cardio-   NCT03775291) measuring OSA using a smartwatch, which
     and cerebrovascular diseases [9,10]. Nevertheless, about 90%           was initiated by Fitbit in December 2018 [38]. However, the
     of suspected patients with OSA remain undiagnosed [11] due             latest update of the study’s recruitment status as of November
     to the lack of sleep laboratories or specialists and the high cost     2019 was still “active, not recruiting.” The study aimed to only
     associated with an in-lab polysomnography (PSG) diagnosis              compare PSG-assessed Apnea–Hypopnea Index (AHI) with the
     (ie, the gold-standard for sleep disorder diagnosis [12]), thus        AHI derived from the smartwatch, rather than performing an
     leading to decreased quality of life and increased health care         event-by-event comparison of the apnea or hypopnea events
     burden in the aging society. Relatively simple and less-expensive      measured by these two devices. Thus, even if we assume that
     diagnostic methods such as portable home respiratory                   Fitbit may have completed their validation work recently, their
     polygraphy have been developed [13,14]. However, its signal            study still cannot answer the key question as to whether the
     quality is compromised, with failure rates ranging from 3% to          hypopnea diagnostic standard criterion of ≥3% OD at the
     18% [14], mostly due to incorrect handling of the device or            fingertip can be equally applied to the OD at the arm or wrist.
     sensors by the people performing the test (ie, the patients            Therefore, we, for the first time, aimed to compare
     themselves) [15]. Home respiratory polygraphy also has the             event-by-event OD at the fingertip (finger_OD) measured by
     risk of false diagnosis because it cannot measure sleep/wake,          the      gold-standard       in-lab      PSG       transmission
     so patients may be awake during the night. The cost of such            photoplethysmography (T-PPG) with OD at the arm (arm_OD)
     diagnostic methods is still relatively high in many low- and           measured by frequency-domain multidistance (FDMD)
     middle-income countries, limiting their broad application in the       near-infrared spectroscopy (NIRS) in sleep hypopneas during
     general population. Therefore, using low-cost and easy-to-use          naïve sleep and continuous positive airway pressure (CPAP)
     wearable devices, such as smart finger rings, smartwatches, or         therapy. FDMD-NIRS is a well-validated [39-41] advanced,
     armbands, for at-home diagnosis of OSA and to assess treatment         noninvasive optical technique that can quantify hemodynamic
     effectiveness would substantially contribute to public health          changes, including OD, in the measured tissues for long-term
     worldwide [6,16].                                                      recordings such as all-night sleep with high temporal resolution
     However, using the aforementioned low-cost wearable devices            [42,43]. Our results can conclusively demonstrate whether
     to evaluate OSA is still not clinically viable because, currently,     physiologically arm_OD measures can directly replace
     no product has been licensed or certified as a medical diagnostic      finger_OD to define sleep hypopnea. Thus, this study will have
     device by the United States Food and Drug Administration               a broad appeal to the general public, sleep clinicians and
     (FDA) or CE marking. We hypothesize that one of the major              scientists, health care insurance providers, and wearable
     limitations in measuring OSA with wearables is the detection           technology developers who are aiming to measure OSA at-home
     of sleep hypopnea. Currently, most consumer-grade wearables            by using wearable devices.
     can measure surrogate markers for breathing and heartbeats or
     heart rate variability [3,17-20]. Although sleep apneas consisting     Methods
     of a complete pause in breathing for ≥10 seconds are relatively
     easy to assess by analyzing breathing frequency [6,12,21-23],          Patients
     it is challenging to detect sleep hypopnea, which is defined as        All patients underwent video-PSG measurement for diagnosis
     a ≥30% drop in airflow lasting ≥10 seconds accompanied by              in our sleep laboratory. The following day, those patients who
     either an arousal or a ≥3% drop in peripheral capillary oxygen         were diagnosed with OSA and recommended to use CPAP
     saturation (SpO2) measured at the fingertip [12]. Smart rings          therapy by clinicians were recruited and gave their written
     that can measure SpO2 at the fingertip (eg, Sleepon [24]) are          informed consent for participation in the study. Patients with
     likely to accurately quantify the drops in SpO2 because,               unstable coronary or cerebral artery disease, severe arterial
     essentially, they are similar to fingertip pulse oximetry.             hyper- or hypotension, respiratory diseases, or a history of a
     However, these devices have only a very tiny market share              sleep-related accident were excluded. Finally, 30 newly
     compared to other popular wearables such as smartwatches and           diagnosed patients with OSA (mean age 54.2, SD 13.8 years,
     armbands [25]. Whether the measures of oxygen desaturation             IQR 42-65 years; male: n=27; mean BMI 35.9, SD 7.5 kg/m2,

     https://www.jmir.org/2021/7/e24171                                                              J Med Internet Res 2021 | vol. 23 | iss. 7 | e24171 | p. 2
                                                                                                                   (page number not for citation purposes)
XSL• FO
RenderX
JOURNAL OF MEDICAL INTERNET RESEARCH                                                                                                    Zhang et al

     IQR 31.8-42.0 kg/m2; mean AHI 53.4, SD 24.7 per hour, IQR              and are high frequency modulated at 110 MHz. The light can
     32-71 per hour) participated in this study. This study was             penetrate the measured tissues with a depth of several
     approved by the local ethical commission of Northwest                  centimeters when the four light sources are aligned and placed
     Switzerland, and it was in compliance with the Declaration of          at 2, 2.5, 3, and 3.5 cm away from an optical fiber bundle
     Helsinki.                                                              connected to the photomultiplier tube detector.

     Protocol                                                               The most common commercially available NIRS devices,
                                                                            including wearable NIRS devices (eg, Humon [30,31], Moxy
     The patients underwent incremental stepwise CPAP (AirSense
                                                                            [32,33], and PortaMon [34]), are continuous-wave NIRS
     10, ResMed) titration combined with video-PSG and
                                                                            (CW-NIRS), which measure the hemodynamic changes in
     FDMD-NIRS recordings in one nocturnal sleep episode. This
                                                                            human tissues based on the modified Beer–Lambert law
     sleep episode consisted of 1 hour of baseline sleep without
                                                                            (MBLL) [46-48]. As illustrated in Figure 1A, in the original
     CPAP, followed by incremental stepwise titration of 1 cmH2O
                                                                            Beer–Lambert law, the light extinction is proportional to the
     pressure per hour starting from 5-8 cmH2O depending on the             concentration C multiplied by the constant extinction coefficient
     individuals. The 1-h baseline sleep allowed us to compare              ε for the particular absorber and the length d of the absorbing
     arm_OD with finger_OD during natural sleep in patients with            media when light passes through a nonscattering but absorbing
     OSA. We included the CPAP titration protocol because (1) the           media [49]. C × ε is also called the absorption coefficient µa of
     stepwise CPAP titration protocol can increase the number of            the absorbing media. However, biological tissues are highly
     hypopneas for data analysis in our patients, since low pressures       scattering media, and scattering will increase the path-length
     cannot fully open the airways to restore the apneas but instead        of light, thus increasing the probability of both light absorption
     cause hypopneas and (2) auto-CPAP that can automatically               and loss of light. Scattering also makes it possible that some
     adjust the pressures within a given range (ie, automatic titration),   light can go out of the tissue from the same side of the light
     and CPAP with fixed pressures are the most efficient and               source (ie, backscattering light), as shown in Figure 1B. Thus,
     popular therapy for OSA [44]. Thus, the comparison between             reflectance photoplethysmography (R-PPG) pulse oximeter
     arm_OD and finger_OD in hypopneas under various CPAP                   [50-52] and the NIRS device in which the light source and
     pressures could allow us to test the feasibility of monitoring         detector are placed on the same side of the measured tissues
     treatment efficacy by measuring arm_OD.                                were developed based on MBLL. In MBLL, the light
     Video-PSG                                                              propagation due to scattering is taken into account by
                                                                            introducing the differential path-length factor (DPF). The real
     Video-PSG (Embla RemLogic, Natus Medical Incorporated)
                                                                            path-length of light in the tissue is then calculated as DPF
     is a comprehensive recording of physiological signals during
                                                                            multiplied by the source-detector distance r. DPF varies between
     sleep, including electroencephalography at electrode locations
                                                                            different biological tissues and different individuals, and it also
     of C3, C4, O1, O2, F3, and F4 according to 10 to 20 system,
                                                                            depends on other factors such as light wavelength and age and
     eye movements (electrooculogram), muscle activation
                                                                            gender of the individual [48,53]. CW-NIRS devices use fixed
     (electromyogram), electrocardiogram, breathing functions, heart
                                                                            value of DPF in the range of 3 to 6 for different light
     rate, fingertip SpO2 (left index fingertip in this study), and
                                                                            wavelengths [53]. They can only estimate the relative changes
     movement during sleep. Two experienced sleep technologists             in the main absorbing chromophores, that is, oxygenated
     independently scored the sleep stages, respiratory and limb            hemoglobin (HbO2) and deoxygenated hemoglobin (HHb) in
     movement events, and motion artifacts in 30-second epochs
                                                                            the measured biological tissues. R-PPG and T-PPG pulse
     according to the 2017 American Academy of Sleep Medicine
                                                                            oximeters usually use two near-infrared wavelengths that are
     manual [12]. Sleep hypopneas were defined as an at least 30%
                                                                            mainly absorbed by HbO2 and HHb respectively. The influences
     drop in airflow lasting for at least 10 seconds with either an
     arousal or >3% drop in SpO2. The discrepancy between these             of scattering on light attenuation are approximately assumed to
                                                                            be cancelled out in the calculation of SpO2 that is derived from
     two technologists was resolved by discussion or
     recommendation by an experienced neurophysiologist. The                the ratio of the light intensities of the two wavelengths, ie,
     hypopneas were excluded from analysis if their SpO2                    assuming the path-lengths of the two wavelengths are identical
                                                                            in the tissues [50-52]. However, this assumption is actually not
     desaturations were larger than 15% (n=31) to exclude outliers
                                                                            valid because DPF varies between different wavelengths.
     and potentially unreliable measurements caused by instrument
                                                                            Experimental calibrations against in vitro measurement of
     errors.
                                                                            arterial oxygen saturation (SaO2) in extracted arterial blood (ie,
     FDMD-NIRS Measurements                                                 invasive co-oximetry) thus must be performed in commercial
     In this study, FDMD-NIRS (Imagent, ISS) measurements were              pulse oximeters during their research and development period
     conducted over the middle of the left biceps muscle. Imagent           to correct measurement errors [50-52]. Several calibration-free
     is currently the only commercial benchtop FDMD-NIRS device             methods were also proposed, including calculating the real light
     [40,42,45] and has been CE-approved for research. Its light            path-length and absorption by using the frequency-domain NIRS
     emitters, four laser diodes at 690-nm wavelength and four laser        algorithm [52,54-57].
     diodes at 830-nm wavelength, are coupled into four light sources

     https://www.jmir.org/2021/7/e24171                                                              J Med Internet Res 2021 | vol. 23 | iss. 7 | e24171 | p. 3
                                                                                                                   (page number not for citation purposes)
XSL• FO
RenderX
JOURNAL OF MEDICAL INTERNET RESEARCH Zhang et al
Figure 1. Beer–Lambert law and frequency-domain multidistance near-infrared spectroscopy (FDMD-NIRS) measurement. (A) The original Beer–lambert
law describing the light propagation in a nonscattering absorbing media. The attenuation of light intensity in this absorbing media is proportional to the
concentration C multiplied by the constant extinction coefficient ε for the particular absorber and the length d of the absorbing media. (B) The travelling
of light in biological tissue (ie, highly scattering media). Light travels a longer pathway in the tissue than the light source-detector distance r due to
scattering. (C) Basic principle of FDMD-NIRS measurement. The blue sine wave represents the high-frequency modulated light source. IDC0 and IAC0
are its light intensity and modulation amplitude, respectively. The two black sine waves are the output light detected after passing the measured tissues.
They are detected by detectors 1 and 2 placed at different distances away from the light source. The light intensities and modulation amplitudes of the
two black sine waves are smaller than those of the light source, and their phases are delayed because of the absorption and scattering in the tissues.
Detector 1 is closer to the light source than detector 2. Therefore, the light intensity IDC1 and modulation amplitude IAC1 detected at detector 1 are larger
than the light intensity IDC2 and modulation amplitude IAC2 detected at detector 2. The phase delay φ1 at detector 1 is smaller than the phase delay φ2
at detector 2 because the light reaching detector 2 has travelled a longer distance in the tissue. Similarly, the light intensity and modulation amplitude
will be further decreased, and the phase delay will be further increased, when the light reaches the other detectors placed farther away than detector 2.
As illustrated in Figure 1C, in FDMD-NIRS, the light emitted from the light source. The IDC, IAC and φ from different light
from light source can be detected by detectors placed at different source-detector distances vary linearly [42,45]. Therefore, to
distances away from the source. The light intensity (IDC) and submit the measured IDC, IAC and φ to linear regression, we can
modulation amplitude (IAC) of the detected light decrease, and obtain the following equations derived from the photon diffusion
a phase delay (φ) occurs between the detected light and the equation in a semi-infinite geometry [40,45,58-60]:
source light due to absorption and scattering. The detected IDC
ln (r2IAC) = rSAC + CAC (1)
and IAC are smaller but theφ is larger at the detector further away
https://www.jmir.org/2021/7/e24171 J Med Internet Res 2021 | vol. 23 | iss. 7 | e24171 | p. 4
(page number not for citation purposes)
XSL• FO
RenderXJOURNAL OF MEDICAL INTERNET RESEARCH Zhang et al
ln (r2IDC) = rSDC + CDC (2) In this study, the sampling rate of FDMD-NIRS recording was
5.2 Hz. The reliability and accuracy of FDMD-NIRS
φ = rSφ + Cφ (3) measurements depend on the linearity of the measured optical
Where r is the known source-detector distance, SAC, SDC and Sφ signals on distances, because µa and µS’ are derived from the
are the slopes and CAC, CDC and Cφ are the intercepts. The slopes of equations (1-3). The linear dependence R2 of the
linearity of the equation is monitored by the R2 of the fitted modulated light amplitude and phase shift over the measured
linear regression. By combing any two of these three slopes (eg, distances should be highly close to 1 in each light wavelength.
we chose SAC and Sφ in the following equations), we can Thus, before the start of the recording, our Imagent system was
calculate the absorption coefficient µa and the reduced scattering calibrated on an optical phantom block with known µa and µS’,
that is, the light intensity of each light source was adjusted so
coefficient µS’ of the measured tissue [40,45,58-60]:
that R2 was equal to 1 and the measured µa and µS’ of the optical
µa = ω/2v × (Sφ / SAC −SAC / Sφ) (4) phantom block were equal to their known values. This
calibration step can exclude the uncertainty of our measurements
µS’ = (SAC2 − Sφ2) / 3µa−µa (5) due to machine errors such as light source and detector errors.
where ω/2π is the modulation frequency and v is the velocity The raw optical data were discarded if the R2 was smaller than
of light in the tissue. FDMD-NIRS uses two wavelengths. The 0.95 in either modulated light amplitude or phase shift in any
µa and µS’ of both these wavelengths can be calculated wavelength to exclude poor-quality data arising from improper
probe-skin contact and shunted light reaching the detector
individually by using the same equations (4) and (5). Equation
without travelling through the tissue [68,69]. The NIRS data
(4) gives us the absorption coefficient of the measured tissues
were then subjected to a low-pass (JOURNAL OF MEDICAL INTERNET RESEARCH Zhang et al
Figure 2. Typical oxygen desaturation (OD) at fingertip (finger_OD) and at arm (arm_OD) during hypopneas. Arrows indicate the degree of OD. SpO2
is measured at the fingertip by polysomnography transmission photoplethysmography, and StO2 is measured at the biceps muscle by frequency-domain
multidistance near-infrared spectroscopy. SpO2: peripheral capillary oxygen saturation; StO2: peripheral tissue oxygen saturation.
https://www.jmir.org/2021/7/e24171 J Med Internet Res 2021 | vol. 23 | iss. 7 | e24171 | p. 6
(page number not for citation purposes)
XSL• FO
RenderXJOURNAL OF MEDICAL INTERNET RESEARCH Zhang et al
Figure 3. Distributions of oxygen desaturation at fingertip (finger_OD) and at arm (arm_OD) at (A) baseline (n=668) and (B) under continuous positive
airway pressure (CPAP: n=1517).
Bland-Altman plots (Figure 4) show that the mean difference continuous positive airway pressure (CPAP) sleep, with broad
between finger_OD and arm_OD is 2.86% (95% CI 95% limits of agreement (LoA) as [-2.27%, 8.00%] and [-2.54%,
2.67%-3.06%, t667=28.28; PJOURNAL OF MEDICAL INTERNET RESEARCH Zhang et al
Figure 4. Bland-Altman plots of oxygen desaturation at fingertip (finger_OD) and at arm (arm_OD) at (A) baseline (n=668) and (B) under continuous
positive airway pressure (CPAP: n=1517). The x-axes show the mean between the two measures, whereas the y-axes represent the differences (ie,
finger_OD – arm_OD). The horizontal dotted lines indicate the mean difference and the 95% limits of agreement between the measures, ie, mean
difference ± 1.96 × SD. The distribution of the mean difference is shown at the right margin of the plot, which is a normal distribution.
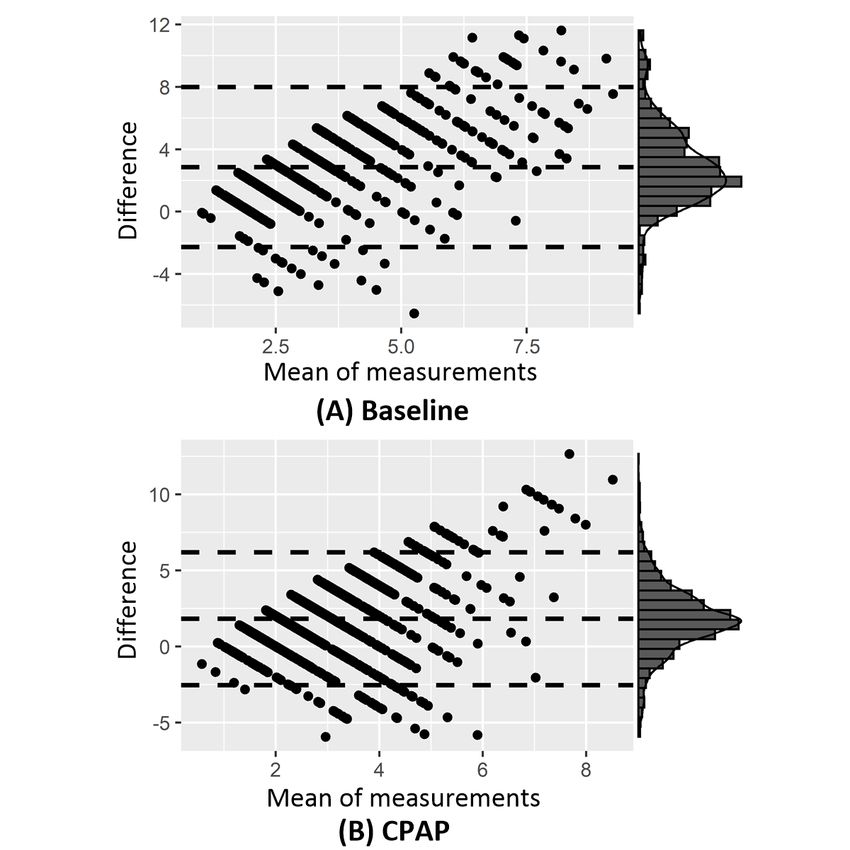
To test whether arm_OD could replace finger_OD in subgroups ≥ specific cut-offs (from 2% to 8%). Again, we could only
of hypopneas such as those causing severe OD, we correlate observe weak correlations (ie, correlation coefficients < 0.4)
arm_OD and finger_OD in different subgroups with finger_OD between them at baseline and under CPAP (Figure 5).
https://www.jmir.org/2021/7/e24171 J Med Internet Res 2021 | vol. 23 | iss. 7 | e24171 | p. 8
(page number not for citation purposes)
XSL• FO
RenderXJOURNAL OF MEDICAL INTERNET RESEARCH Zhang et al
Figure 5. The correlations between oxygen desaturation at fingertip (finger_OD) and at arm (arm_OD) in the hypopnea events wherein finger_OD ≥
cut-off. X-axis shows the cut-off of finger_OD (from 2% to 8%). Y-axis depicts nonparametric Spearman’s correlation coefficient between finger_OD
and arm_OD. The number of events used for correlation analysis and the P value are shown in the figure. The correlation analyses are performed for
both baseline and CPAP sleep. For example, the green triangle at X=6, Y=0.3 means that during naïve baseline sleep there are 234 hypopneas associated
with at least 6% finger_OD, and in these events, arm_OD weakly correlates to finger_OD with Spearman’s correlation coefficient equal to 0.3 and
PJOURNAL OF MEDICAL INTERNET RESEARCH Zhang et al
(Hutchinson Technology Inc) [76], and ViOptix ODISsey studies suggest that R-PPG can obtain its best signal-to-noise
(ViOptix Inc) [77]. Our results suggest that the absolute or ratio at a separation distance of 3 to 6 mm [92]. Thus, a
relative (ie, normalized to baseline) OD at arm muscle measured separation distance of several millimeters is used in the design
by these aforementioned devices cannot be directly used to of R-PPG pulse oximetry [36]. A recent study modeled the
define sleep hypopnea. R-PPG light propagation in human skin [37]. The authors found
that even at a separation distance of only 0.6 mm, many light
Second, the NIRS StO2 is the proportion of HbO2 in arterial,
rays reaching deeper into the muscle can still be received by
capillary, and venous compartments of the measured tissue. It the detector because of the random nature of light scattering
can be expressed by its two major compounds as StO2 = (a × [37]. Therefore, similar to NIRS armbands, armband devices
SaO2) + (b × SvO2), where SaO2 and SvO2 are the arterial and using R-PPG capture the oxygen saturation in both skin and
venous oxygen saturation [68,73]. Fingertip SpO2 is the best muscle. There are challenges in using both techniques to
noninvasive estimate of SaO2 [50,52]. The ratio of the differentiate SaO2 and SvO2 desaturations from the measured
coefficients a/b is called the arterio-venous ratio (AVR). The StO2 desaturation to define sleep hypopneas.
AVR of different tissues (eg, brain and muscles) and different
populations (eg, healthy people and patients, adults, and We did not include a smartwatch in this study, although recently,
children) has been determined by invasive measurements under leading smartwatch companies like Apple, Fitbit, Garmin,
different conditions but not during sleep [73,78-88]. Huami, and Huawei have all added the function of measuring
Commercially available NIRS oximeters, including the oxygen saturation in their products. This is because these
aforementioned FDA-certificated medical devices take the fixed commercially available products cannot or are unwilling to
AVR value as either 0.25/0.75 or 0.30/0.70 but have not export their raw data for analyses, or their temporal resolutions
validated it in OSA [78-88]. Our results of poor correlations are simply too low for an event-by-event comparison necessary
between arm_OD and finger_OD (Figure 5) indicate that such for our study because usually these consumer-grade
an uncritical AVR adoption is not justified. According to the smartwatches upload their data to their cloud servers in minute
mathematical model of fixed relationship between StO2 and resolution. Nevertheless, our results may have indirect
implications for smartwatches. R-PPG smartwatch is different
SaO2, we expect a strong correlation between StO2 and SpO2
from the fingertip T-PPG in measuring SpO2. Lee et al [89]
that we could not confirm using our data. These conflicting
found that the raw light signals measured by wrist R-PPG and
results suggest that the model is not valid for OSA. Therefore,
fingertip T-PPG change differently during breath-holding,
developers of wearable or portable NIRS devices should first
indicating different SpO2 values are calculated by these two
study the AVR in muscle tissues and validate it against invasive
blood sample measurements before using their devices techniques. Abay et al [36] reported that wrist R-PPG results
commercially for OSA diagnosis. in lower SpO2 values than fingertip T-PPG at rest, and during
venous occlusion, fingertip T-PPG SpO2 does not exhibit
Our findings also indicate that appropriate arterial oxygen desaturation but wrist R-PPG SpO2 drops similarly as the
saturation measurement is not possible with armbands using
simultaneously measured NIRS StO2 at the same arm. Their
the R-PPG method. As mentioned in the Methods section,
R-PPG essentially has the same theoretical limitations as findings also indicate that although smartwatches measure the
CW-NIRS, such that the scattering of light in the human tissues wrist and NIRS measures the arm muscle, the measured changes
cannot be calculated. R-PPG and T-PPG pulse oximeters in oxygen saturation by these two techniques are likely to be
estimate SpO2 under the assumption that changes in blood the same. Thus, the venous blood influences in our NIRS StO2
volume only occur in arterial but not in the venous compartment. measurements are also likely to be observed in smartwatch
SpO2 is measured from the fingertip or the superficial forehead measurements.
because these locations are well perfused by arteries [36,52,89]. Conclusions
It is not recommended to measure SpO2 by using R-PPG at the Our study warns consumers, health care insurance companies,
wrist or the arm, because of its low signal-to-noise ratio. and sleep clinicians and scientists to interpret the AHI provided
Compared to the more precise fingertip T-PPG method, the low by smartwatches and armbands with caution until those products
signal-to-noise ratio of R-PPG at the wrist or arm is about 10 are clinically and experimentally validated. An AHI >5/hour
times weaker due to various factors such as relative low blood suggests the diagnosis of OSA [12]. Our results suggest that
perfusion and sensitivity to pressure and ambient light sources AHI is likely to be underestimated if using the criterion of
[51,89]. Additionally, the key assumption of constant venous arm_OD ≥3% to define hypopneas. Wearable technology
blood volume is no longer valid at the wrist or arm [89,90]. developers who are validating their products can learn from this
Although recently, some smartwatches [26-29] and a few study and take into account the mismatch between the ODs
armbands [35-37] claimed that they can measure SpO2 at the measured by their products and by the gold-standard technique
arm or wrist by using R-PPG, they actually measure both arterial fingertip pulse oximetry. Developing new parameters (eg,
and venous blood [89,90] similar to NIRS. A main difference estimated-oxygen-variation provided by Fitbit smartwatches
between NIRS and R-PPG is the measurement depth. Whether [26]) or combining smartwatches with external fingertip T-PPG
R-PPG measures the blood only in the skin or in both the skin sensors [93] may be a more promising strategy to measure OSA.
and muscle depends on the distance between the light source Nevertheless, validations of these new approaches are necessary
and detector [91]. The detector can detect the light passing before releasing them for clinical use. In addition, our finding
through deeper tissues at a larger separation distance. In vivo
https://www.jmir.org/2021/7/e24171 J Med Internet Res 2021 | vol. 23 | iss. 7 | e24171 | p. 10
(page number not for citation purposes)
XSL• FO
RenderXJOURNAL OF MEDICAL INTERNET RESEARCH Zhang et al
of a weak correlation between finger_OD and arm_OD indicates as medical devices, protocols that quantify the arterial and
that (1) prediction of finger_OD using arm_OD may be possible venous contributions to the arm_OD are needed. Arm_OD can
but will require development and implementation of then be calibrated to indicate the changes in the arterial ODs at
sophisticated data-mining, such as machine learning algorithms the arm or wrist.
[90], and (2) as previous studies have validated NIRS oximeters
Acknowledgments
This work was supported by Clinic Barmelweid Scientific Foundation. The data acquisition work was supported by the Research
Fund of the Swiss Lung Association No. 2014-22.
Conflicts of Interest
None declared.
References
1. Depner C, Cheng P, Devine J, Khosla S, de Zambotti M, Robillard R, et al. Wearable technologies for developing sleep
and circadian biomarkers: a summary of workshop discussions. Sleep 2020 Feb 13;43(2):1-13 [FREE Full text] [doi:
10.1093/sleep/zsz254] [Medline: 31641776]
2. Zhang Z, Cajochen C, Khatami R. social jetlag and chronotypes in the chinese population: analysis of data recorded by
wearable devices. J Med Internet Res 2019 May 11;21(6):e13482 [FREE Full text] [doi: 10.2196/13482] [Medline: 31199292]
3. Perez MV, Mahaffey KW, Hedlin H, Rumsfeld JS, Garcia A, Ferris T, et al. Large-scale assessment of a smartwatch to
identify atrial fibrillation. N Engl J Med 2019 Nov 14;381(20):1909-1917. [doi: 10.1056/nejmoa1901183]
4. Wen D, Zhang X, Liu X, Lei J. evaluating the consistency of current mainstream wearable devices in health monitoring:
a comparison under free-living conditions. J Med Internet Res 2017 Mar 07;19(3):e68 [FREE Full text] [doi:
10.2196/jmir.6874] [Medline: 28270382]
5. Haghayegh S, Khoshnevis S, Smolensky MH, Diller KR, Castriotta RJ. Accuracy of wristband fitbit models in assessing
sleep: systematic review and meta-analysis. J Med Internet Res 2019 Nov 28;21(11):e16273 [FREE Full text] [doi:
10.2196/16273] [Medline: 31778122]
6. Baron KG, Duffecy J, Berendsen MA, Cheung Mason I, Lattie EG, Manalo NC. Feeling validated yet? a scoping review
of the use of consumer-targeted wearable and mobile technology to measure and improve sleep. Sleep Med Rev 2018
Aug;40:151-159 [FREE Full text] [doi: 10.1016/j.smrv.2017.12.002] [Medline: 29395985]
7. Reimer U, Emmenegger S, Maier E, Zhang Z, Khatami R. Recognizing sleep stages with wearable sensors in everyday
settings. : SciTePress; 2017 Presented at: Proceedings of the 3rd International Conference on Information and Communication
Technologies for Ageing Well and e-Health; 2017; Porto p. 172-179. [doi: 10.5220/0006346001720179]
8. Senaratna CV, Perret JL, Lodge CJ, Lowe AJ, Campbell BE, Matheson MC, et al. Prevalence of obstructive sleep apnea
in the general population: a systematic review. Sleep Med Rev 2017 Aug;34:70-81. [doi: 10.1016/j.smrv.2016.07.002]
[Medline: 27568340]
9. Yaggi HK, Concato J, Kernan WN, Lichtman JH, Brass LM, Mohsenin V. Obstructive sleep apnea as a risk factor for
stroke and death. N Engl J Med 2005 Nov 10;353(19):2034-2041. [doi: 10.1056/nejmoa043104]
10. Somers VK. Sleep--a new cardiovascular frontier. N Engl J Med 2005 Nov 10;353(19):2070-2073. [doi:
10.1056/NEJMe058229] [Medline: 16282183]
11. Young T, Evans L, Finn L, Palta M. Estimation of the clinically diagnosed proportion of sleep apnea syndrome in middle-aged
men and women. Sleep 1997 Sep;20(9):705-706. [doi: 10.1093/sleep/20.9.705] [Medline: 9406321]
12. Berry R, Brooks R, Gamaldo CE, Harding SM, Lloyd RM, Marcus CL, et al. The AASM Manual for the Scoring of Sleep
and Associated Events: Rules, Terminology and Technical Specifications. Darien, IL: The American Academy of Sleep
Medicine; Oct 1, 2017.
13. Masa JF, Corral J, Pereira R, Duran-Cantolla J, Cabello M, Hernandez-Blasco L, et al. Effectiveness of home respiratory
polygraphy for the diagnosis of sleep apnoea and hypopnoea syndrome. Thorax 2011 May 20;66(7):567-573. [doi:
10.1136/thx.2010.152272]
14. Collop NA, Anderson WM, Boehlecke B, Claman D, Goldberg R, Gottlieb DJ, Portable Monitoring Task Force of the
American Academy of Sleep Medicine. Clinical guidelines for the use of unattended portable monitors in the diagnosis of
obstructive sleep apnea in adult patients. Portable Monitoring Task Force of the American Academy of Sleep Medicine. J
Clin Sleep Med 2007 Dec 15;3(7):737-747 [FREE Full text] [Medline: 18198809]
15. Tan H, Gozal D, Ramirez H, Bandla H, Kheirandish-Gozal L. Overnight polysomnography versus respiratory polygraphy
in the diagnosis of pediatric obstructive sleep apnea. Sleep 2014 Feb 01;37(2):255-260 [FREE Full text] [doi:
10.5665/sleep.3392] [Medline: 24497654]
16. Penzel T, Schöbel C, Fietze I. New technology to assess sleep apnea: wearables, smartphones, and accessories. F1000Res
2018;7:413 [FREE Full text] [doi: 10.12688/f1000research.13010.1] [Medline: 29707207]
https://www.jmir.org/2021/7/e24171 J Med Internet Res 2021 | vol. 23 | iss. 7 | e24171 | p. 11
(page number not for citation purposes)
XSL• FO
RenderXJOURNAL OF MEDICAL INTERNET RESEARCH Zhang et al
17. Zhang H, Zhang J, Li H, Chen Y, Yang B, Guo Y, et al. validation of single centre pre-mobile atrial fibrillation apps for
continuous monitoring of atrial fibrillation in a real-world setting: pilot cohort study. J Med Internet Res 2019 Dec
03;21(12):e14909 [FREE Full text] [doi: 10.2196/14909] [Medline: 31793887]
18. Fan Y, Li Y, Li J, Cheng W, Shan Z, Wang Y, et al. Diagnostic performance of a smart device with photoplethysmography
technology for atrial fibrillation detection: pilot study (Pre-mAFA II Registry). JMIR Mhealth Uhealth 2019 Mar
05;7(3):e11437 [FREE Full text] [doi: 10.2196/11437] [Medline: 30835243]
19. Chen E, Jiang J, Su R, Gao M, Zhu S, Zhou J, et al. A new smart wristband equipped with an artificial intelligence algorithm
to detect atrial fibrillation. Heart Rhythm 2020 May;17(5 Pt B):847-853 [FREE Full text] [doi: 10.1016/j.hrthm.2020.01.034]
[Medline: 32354449]
20. Zhang Z, Henzmann S, Hügli G, Qi M, Chen W, Lu C, et al. Validation of wearable sleep monitoring device based on
cardiopulmonary coupling and accelerometer with comparison to polysomnography in adults. : European Journal of
Neurology; 2018 Presented at: The 4th Congress of the European Academy of Neurology; 2018; Lisbon p. 385.
21. Papini GB, Fonseca P, Gilst MMV, Bergmans JW, Vullings R, Overeem S. Respiratory activity extracted from wrist-worn
reflective photoplethysmography in a sleep-disordered population. Physiol Meas 2020 Jul 08;41(6):065010. [doi:
10.1088/1361-6579/ab9481] [Medline: 32428875]
22. Taffoni F, Rivera D, La Camera A, Nicolò A, Velasco JR, Massaroni C. A wearable system for real-time continuous
monitoring of physical activity. J Healthc Eng 2018;2018:1878354 [FREE Full text] [doi: 10.1155/2018/1878354] [Medline:
29849993]
23. Aliverti A. Wearable technology: role in respiratory health and disease. Breathe (Sheff) 2017 Jun;13(2):e27-e36 [FREE
Full text] [doi: 10.1183/20734735.008417] [Medline: 28966692]
24. Go2sleep SE. URL: https://www.sleepon.us/go2sleepse/ [accessed 2020-08-07]
25. Seneviratne S, Hu Y, Nguyen T, Lan G, Khalifa S, Thilakarathna K, et al. A survey of wearable devices and challenges.
IEEE Commun Surv Tutorials 2017 Jul 26;19(4):2573-2620. [doi: 10.1109/comst.2017.2731979]
26. How do I track my estimated oxygen variation in the Fitbit app?. URL: https://help.fitbit.com/articles/en_US/Help_article/
1876.htm [accessed 2020-08-07]
27. Top FAQs for the Pulse Ox Feature on Garmin Watches. URL: https://support.garmin.com/en-US/
?faq=SK2Y9a9aBp5D6n4sXmPBG7 [accessed 2020-08-07]
28. Amazfit X Bow to the Future. URL: https://www.amazfit.com/en/amazfit-x.html [accessed 2020-08-07]
29. HUAWEI Watch 3. Huawei Global. URL: https://consumer.huawei.com/en/wearables/watch-3/ [accessed 2021-07-07]
30. Humon Muscle Oxygen Sensor. URL: https://humon.io/ [accessed 2020-08-07]
31. Farzam P, Starkweather Z, Franceschini MA. Validation of a novel wearable, wireless technology to estimate oxygen levels
and lactate threshold power in the exercising muscle. Physiol Rep 2018 Apr 02;6(7):e13664. [doi: 10.14814/phy2.13664]
32. The Science Behind Moxy. URL: https://www.moxymonitor.com/wp-content/themes/moxymonitor/documents/
Moxy_Scientific_Explanation_march2014.pdf [accessed 2020-08-07]
33. Feldmann A, Schmitz R, Erlacher D. Near-infrared spectroscopy-derived muscle oxygen saturation on a 0% to 100% scale:
reliability and validity of the Moxy Monitor. J Biomed Opt 2019 Nov;24(11):1-11 [FREE Full text] [doi:
10.1117/1.JBO.24.11.115001] [Medline: 31741352]
34. PortaMon. URL: https://www.artinis.com/portamon [accessed 2020-08-07]
35. What does the Everion measure?. URL: https://support.biofourmis.com/hc/en-us/articles/
213613165-What-does-the-Everion-measure- [accessed 2020-08-07]
36. Abay TY, Kyriacou PA. Reflectance photoplethysmography as noninvasive monitoring of tissue blood perfusion. IEEE
Trans Biomed Eng 2015 Sep;62(9):2187-2195. [doi: 10.1109/TBME.2015.2417863] [Medline: 25838515]
37. Lee H, Kim E, Lee Y, Kim H, Lee J, Kim M, et al. Toward all-day wearable health monitoring: an ultralow-power, reflective
organic pulse oximetry sensing patch. Sci Adv 2018 Nov;4(11):eaas9530 [FREE Full text] [doi: 10.1126/sciadv.aas9530]
[Medline: 30430132]
38. Validation of Software for Assessment of Sleep Apnea From Data Acquired by a Wearable Smartwatch. URL: https:/
/clinicaltrials.gov/ct2/show/NCT03775291?term=smartwatch&cond=Sleep+Apnea&draw=2&rank=1 [accessed 2020-07-07]
39. Toronov VY, Zhang X, Webb AG. A spatial and temporal comparison of hemodynamic signals measured using optical
and functional magnetic resonance imaging during activation in the human primary visual cortex. NeuroImage 2007
Feb;34(3):1136-1148. [doi: 10.1016/j.neuroimage.2006.08.048]
40. Toronov V, Webb A, Choi JH, Wolf M, Safonova L, Wolf U, et al. Study of local cerebral hemodynamics by
frequency-domain near-infrared spectroscopy and correlation with simultaneously acquired functional magnetic resonance
imaging. Opt Express 2001 Oct 08;9(8):417-427. [doi: 10.1364/oe.9.000417] [Medline: 19424359]
41. Gatto R, Hoffman W, Mueller M, Flores A, Valyi-Nagy T, Charbel FT. Frequency domain near-infrared spectroscopy
technique in the assessment of brain oxygenation: a validation study in live subjects and cadavers. J Neurosci Methods
2006 Oct 30;157(2):274-277. [doi: 10.1016/j.jneumeth.2006.04.013] [Medline: 16730069]
42. Fantini S, Sassaroli A. Frequency-domain techniques for cerebral and functional near-infrared spectroscopy. Front Neurosci
2020;14:300 [FREE Full text] [doi: 10.3389/fnins.2020.00300] [Medline: 32317921]
https://www.jmir.org/2021/7/e24171 J Med Internet Res 2021 | vol. 23 | iss. 7 | e24171 | p. 12
(page number not for citation purposes)
XSL• FO
RenderXJOURNAL OF MEDICAL INTERNET RESEARCH Zhang et al
43. Mensen A, Zhang Z, Qi M, Khatami R. The occurrence of individual slow waves in sleep is predicted by heart rate. Sci
Rep 2016 Jul 22;6:29671 [FREE Full text] [doi: 10.1038/srep29671] [Medline: 27445083]
44. Berry R, Parish J, Hartse KM. The use of auto-titrating continuous positive airway pressure for treatment of adult obstructive
sleep apnea. An American Academy of Sleep Medicine review. Sleep 2002 Mar 15;25(2):148-173. [Medline: 11902425]
45. Fantini S, Franceschini MA, Maier J, Walker S, Barbieri B, Gratton E. Frequency-domain multichannel optical detector
for noninvasive tissue spectroscopy and oximetry. Optical Engineering 1995 Jan 01;34(1):32. [doi: 10.1117/12.183988]
46. Villringer A, Chance B. Non-invasive optical spectroscopy and imaging of human brain function. Trends Neurosci 1997
Oct;20(10):435-442. [doi: 10.1016/s0166-2236(97)01132-6] [Medline: 9347608]
47. Delpy DT, Cope M, van der Zee P, Arridge S, Wray S, Wyatt J. Estimation of optical pathlength through tissue from direct
time of flight measurement. Phys Med Biol 1988 Dec;33(12):1433-1442. [doi: 10.1088/0031-9155/33/12/008] [Medline:
3237772]
48. Scholkmann F, Kleiser S, Metz AJ, Zimmermann R, Mata Pavia J, Wolf U, et al. A review on continuous wave functional
near-infrared spectroscopy and imaging instrumentation and methodology. NeuroImage 2014 Jan;85:6-27. [doi:
10.1016/j.neuroimage.2013.05.004]
49. Beer. Bestimmung der Absorption des rothen Lichts in farbigen Flüssigkeiten. Article in German. Annalen der Physik
1852;162(5):78-88. [doi: 10.1002/andp.18521620505]
50. Chan ED, Chan MM, Chan MM. Pulse oximetry: Understanding its basic principles facilitates appreciation of its limitations.
Respiratory Medicine 2013 Jun;107(6):789-799. [doi: 10.1016/j.rmed.2013.02.004]
51. König V, Huch R, Huch A. Reflectance pulse oximetry--principles and obstetric application in the Zurich system. J Clin
Monit Comput 1998 Aug;14(6):403-412. [doi: 10.1023/a:1009983010772] [Medline: 10023837]
52. Nitzan M, Romem A, Koppel R. Pulse oximetry: fundamentals and technology update. Med Devices (Auckl) 2014;7:231-239
[FREE Full text] [doi: 10.2147/MDER.S47319] [Medline: 25031547]
53. Scholkmann F, Wolf M. General equation for the differential pathlength factor of the frontal human head depending on
wavelength and age. J Biomed Opt 2013 Oct 01;18(10):105004. [doi: 10.1117/1.jbo.18.10.105004]
54. Franceschini MA, Gratton E, Fantini S. Noninvasive optical method of measuring tissue and arterial saturation: an application
to absolute pulse oximetry of the brain. Opt Lett 1999 Jun 15;24(12):829-831. [doi: 10.1364/ol.24.000829] [Medline:
18073868]
55. Wolf M, Franceschini M, Paunescu L, Toronov V, Michalos A, Wolf U, et al. Absolute frequency-domain pulse oximetry
of the brain: methodology and measurements. Adv Exp Med Biol 2003;530:61-73. [doi: 10.1007/978-1-4615-0075-9_7]
[Medline: 14562705]
56. Vetter R, Rossini L, Ridolfi A, Sola J, Chetelat O, Correvon M, et al. Frequency Domain SpO2 Estimation Based on
Multichannel Photoplethysmographic Measurements at the Sternum. Berlin, Heidelberg: Springer; 2009 Presented at: World
Congress on Medical Physics and Biomedical Engineering; September 7 - 12, 2009; Munich. [doi:
10.1007/978-3-642-03882-2_86]
57. Zhao Y, Applegate MB, Istfan R, Pande A, Roblyer D. Quantitative real-time pulse oximetry with ultrafast frequency-domain
diffuse optics and deep neural network processing. Biomed Opt Express 2018 Dec 01;9(12):5997-6008 [FREE Full text]
[doi: 10.1364/BOE.9.005997] [Medline: 31065408]
58. Fantini S, Franceschini MA, Fishkin JB, Barbieri B, Gratton E. Quantitative determination of the absorption spectra of
chromophores in strongly scattering media: a light-emitting-diode based technique. Appl Opt 1994 Aug 01;33(22):5204.
[doi: 10.1364/ao.33.005204]
59. Fantini S, Hueber D, Franceschini MA, Gratton E, Rosenfeld W, Stubblefield PG, et al. Non-invasive optical monitoring
of the newborn piglet brain using continuous-wave and frequency-domain spectroscopy. Phys Med Biol 1999 Jan
01;44(6):1543-1563. [doi: 10.1088/0031-9155/44/6/308]
60. Fantini S, Franceschini MA, Gratton E. Semi-infinite-geometry boundary problem for light migration in highly scattering
media: a frequency-domain study in the diffusion approximation. J Opt Soc Am B 1994 Oct 01;11(10):2128. [doi:
10.1364/josab.11.002128]
61. Kleiser S, Nasseri N, Andresen B, Greisen G, Wolf M. Comparison of tissue oximeters on a liquid phantom with adjustable
optical properties. Biomed Opt Express 2016 Aug 01;7(8):2973-2992 [FREE Full text] [doi: 10.1364/BOE.7.002973]
[Medline: 27570691]
62. Stankovic M, Maulik D, Rosenfeld W, Stubblefield P, Kofinas A, Drexler S, et al. Real-time optical imaging of experimental
brain ischemia and hemorrhage in neonatal piglets. J Perinat Med 1999;27(4):279-286. [doi: 10.1515/JPM.1999.039]
[Medline: 10560079]
63. Fantini S, Franceschini MA, Gratton E, Hueber D, Rosenfeld W, Maulik D, et al. Non-invasive optical mapping of the
piglet brain in real time. Opt Express 1999 Apr 12;4(8):308-314. [doi: 10.1364/oe.4.000308] [Medline: 19396287]
64. Hallacoglu B, Sassaroli A, Wysocki M, Guerrero-Berroa E, Schnaider Beeri M, Haroutunian V, et al. Absolute measurement
of cerebral optical coefficients, hemoglobin concentration and oxygen saturation in old and young adults with near-infrared
spectroscopy. J Biomed Opt 2012 Aug;17(8):081406-081401 [FREE Full text] [doi: 10.1117/1.JBO.17.8.081406] [Medline:
23224167]
https://www.jmir.org/2021/7/e24171 J Med Internet Res 2021 | vol. 23 | iss. 7 | e24171 | p. 13
(page number not for citation purposes)
XSL• FO
RenderXJOURNAL OF MEDICAL INTERNET RESEARCH Zhang et al
65. Kleiser S, Ostojic D, Andresen B, Nasseri N, Isler H, Scholkmann F, et al. Comparison of tissue oximeters on a liquid
phantom with adjustable optical properties: an extension. Biomed Opt Express 2018 Jan 01;9(1):86-101 [FREE Full text]
[doi: 10.1364/BOE.9.000086] [Medline: 29359089]
66. SOMANETICS INVOS 3100A CEREBRAL OXIMETER (INVOS). U.S. Food and Drug Administration (FDA) 510(k)
Database. URL: https://www.accessdata.fda.gov/scripts/cdrh/cfdocs/cfpmn/pmn.cfm?ID=K971628
67. FORE-SIGHT ABSOLUTE CEREBRAL AND SOMATIC OXIMETER, MC 2000 SERIES, MODELS MC2000, MC2010,
MC2020, MC2030. U.S. Food and Drug Administration (FDA) 510(k) Database. URL: http://www.accessdata.fda.gov/
scripts/cdrh/cfdocs/cfpmn/pmn.cfm?ID=K094030
68. Franceschini MA, Thaker S, Themelis G, Krishnamoorthy KK, Bortfeld H, Diamond SG, et al. Assessment of infant brain
development with frequency-domain near-infrared spectroscopy. Pediatr Res 2007 May;61(5, Part 1):546-551. [doi:
10.1203/pdr.0b013e318045be99]
69. Zhang Z, Bolz N, Laures M, Oremek M, Schmidt C, Qi M, et al. Cerebral blood volume and oxygen supply uniformly
increase following various intrathoracic pressure strains. Sci Rep 2017 Aug 21;7(1):8344 [FREE Full text] [doi:
10.1038/s41598-017-08698-0] [Medline: 28827669]
70. Zhang Z, Schneider M, Laures M, Qi M, Khatami R. The comparisons of cerebral hemodynamics induced by obstructive
sleep apnea with arousal and periodic limb movement with arousal: a pilot NIRS study. Front Neurosci 2016;10:403 [FREE
Full text] [doi: 10.3389/fnins.2016.00403] [Medline: 27630539]
71. Zhang Z, Khatami R. Predominant endothelial vasomotor activity during human sleep: a near-infrared spectroscopy study.
Eur J Neurosci 2014 Aug 26;40(9):3396-3404. [doi: 10.1111/ejn.12702]
72. Cleveland WS, Devlin SJ. Locally weighted regression: an approach to regression analysis by local fitting. Journal of the
American Statistical Association 1988 Sep;83(403):596-610. [doi: 10.1080/01621459.1988.10478639]
73. Watzman H, Kurth C, Montenegro L, Rome J, Steven J, Nicolson SC. Arterial and venous contributions to near-infrared
cerebral oximetry. Anesthesiology 2000 Oct;93(4):947-953 [FREE Full text] [doi: 10.1097/00000542-200010000-00012]
[Medline: 11020744]
74. Abay TY, Kyriacou PA. Photoplethysmography for blood volumes and oxygenation changes during intermittent vascular
occlusions. J Clin Monit Comput 2017 May 25;32(3):447-455. [doi: 10.1007/s10877-017-0030-2]
75. REGIONAL OXIMETER. U.S. Food and Drug Administration (FDA) 510(k) Database. URL: https://www.
accessdata.fda.gov/scripts/cdrh/cfdocs/cfpmn/pmn.cfm?ID=K102715
76. INSPECTRA TISSUE SPECTROMETER SYSTEM (INSPECTRA), MODEL 325. U.S. Food and Drug Administration
(FDA) 510(k) Database. URL: https://www.accessdata.fda.gov/scripts/cdrh/cfdocs/cfpmn/pmn.cfm?ID=K012759
77. VIOPTIX ODISSEY TISSUE OXIMETER TISSUE OXIMETER, MODEL OXY-2. U.S. Food and Drug Administration
(FDA) 510(k) Database. URL: https://www.accessdata.fda.gov/scripts/cdrh/cfdocs/cfpmn/pmn.cfm?ID=K042657
78. Benni PB, MacLeod D, Ikeda K, Lin H. A validation method for near-infrared spectroscopy based tissue oximeters for
cerebral and somatic tissue oxygen saturation measurements. J Clin Monit Comput 2018 Apr;32(2):269-284 [FREE Full
text] [doi: 10.1007/s10877-017-0015-1] [Medline: 28374103]
79. Kreeger RN, Ramamoorthy C, Nicolson SC, Ames WA, Hirsch R, Peng LF, et al. Evaluation of pediatric near-infrared
cerebral oximeter for cardiac disease. Ann Thorac Surg 2012 Nov;94(5):1527-1533. [doi: 10.1016/j.athoracsur.2012.05.096]
[Medline: 22858270]
80. Bickler PE, Feiner JR, Rollins MD. Factors affecting the performance of 5 cerebral oximeters during hypoxia in healthy
volunteers. Anesth Analg 2013 Oct;117(4):813-823. [doi: 10.1213/ANE.0b013e318297d763] [Medline: 24023027]
81. Henson L, Calalang C, Temp J, Ward DS. Accuracy of a cerebral oximeter in healthy volunteers under conditions of
isocapnic hypoxia. Anesthesiology 1998 Jan;88(1):58-65 [FREE Full text] [doi: 10.1097/00000542-199801000-00011]
[Medline: 9447856]
82. Shah N, Trivedi NK, Clack SL, Shah M, Shah PP, Barker S. Impact of hypoxemia on the performance of cerebral oximeter
in volunteer subjects. J Neurosurg Anesthesiol 2000 Jul;12(3):201-209. [doi: 10.1097/00008506-200007000-00001]
[Medline: 10905567]
83. Benni P, Chen B, Dykes F, Wagoner S, Heard M, Tanner A, et al. Validation of the CAS neonatal NIRS system by monitoring
vv-ECMO patients: preliminary results. Adv Exp Med Biol 2005;566:195-201. [doi: 10.1007/0-387-26206-7_27] [Medline:
16594153]
84. Rais-Bahrami K, Rivera O, Short BL. Validation of a noninvasive neonatal optical cerebral oximeter in veno-venous ECMO
patients with a cephalad catheter. J Perinatol 2006 Aug 10;26(10):628-635. [doi: 10.1038/sj.jp.7211573]
85. Ikeda K, MacLeod DB, Grocott HP, Moretti EW, Ames W, Vacchiano C. The accuracy of a near-infrared spectroscopy
cerebral oximetry device and its potential value for estimating jugular venous oxygen saturation. Anesth Analg
2014;119(6):1381-1392. [doi: 10.1213/ane.0000000000000463]
86. Redford D, Paidy S, Kashif F. Absolute and trend accuracy of a new regional oximeter in healthy volunteers during controlled
hypoxia. Anesthesia & Analgesia 2014;119(6):1315-1319. [doi: 10.1213/ane.0000000000000474]
87. Franceschini MA, Boas DA, Zourabian A, Diamond SG, Nadgir S, Lin DW, et al. Near-infrared spiroximetry: noninvasive
measurements of venous saturation in piglets and human subjects. J Appl Physiol (1985) 2002 Jan 01;92(1):372-384 [FREE
Full text] [doi: 10.1152/jappl.2002.92.1.372] [Medline: 11744680]
https://www.jmir.org/2021/7/e24171 J Med Internet Res 2021 | vol. 23 | iss. 7 | e24171 | p. 14
(page number not for citation purposes)
XSL• FO
RenderXJOURNAL OF MEDICAL INTERNET RESEARCH Zhang et al
88. MacDonald MJ, Tarnopolsky MA, Green HJ, Hughson RL. Comparison of femoral blood gases and muscle near-infrared
spectroscopy at exercise onset in humans. J Appl Physiol (1985) 1999 Feb;86(2):687-693 [FREE Full text] [doi:
10.1152/jappl.1999.86.2.687] [Medline: 9931209]
89. Lee H, Ko H, Lee J. Reflectance pulse oximetry: practical issues and limitations. ICT Express 2016 Dec;2(4):195-198.
[doi: 10.1016/j.icte.2016.10.004]
90. Tamura T. Current progress of photoplethysmography and SPO for health monitoring. Biomed Eng Lett 2019 Feb;9(1):21-36
[FREE Full text] [doi: 10.1007/s13534-019-00097-w] [Medline: 30956878]
91. Mendelson Y, Ochs B. Noninvasive pulse oximetry utilizing skin reflectance photoplethysmography. IEEE Trans Biomed
Eng 1988 Oct;35(10):798-805. [doi: 10.1109/10.7286] [Medline: 3192229]
92. Hickey M, Kyriacou PA. Optimal spacing between transmitting and receiving optical fibres in reflectance pulse oximetry.
In: J Phys: Conf Ser. 2007 Nov 07 Presented at: Third International Conference on Optical and Laser Diagnostics (ICOLAD
2007); 22–25 May 2007; City University London p. 012030. [doi: 10.1088/1742-6596/85/1/012030]
93. Pittman S, Ayas N, MacDonald M, Malhotra A, Fogel R, White P. Using a wrist-worn device based on peripheral arterial
tonometry to diagnose obstructive sleep apnea: in-laboratory and ambulatory validation. Sleep 2004 Aug 01;27(5):923-933
[FREE Full text] [doi: 10.1093/sleep/27.5.923] [Medline: 15453551]
Abbreviations
AHI: Apnea–Hypopnea Index
arm_OD: arm oxygen desaturation
AVR: arterio-venous ratio
CPAP: continuous positive airway pressure
CW-NIRS: continuous wave near-infrared spectroscopy
DPF: differential path-length factor
FDMD: frequency-domain multidistance
finger_OD: fingertip oxygen desaturation
HbO2: oxygenated hemoglobin
HHb: deoxygenated hemoglobin
LoA: limit of agreement
MBLL: modified Beer–Lambert law
NIRS: near-infrared spectroscopy
OD: oxygen desaturation
OSA: obstructive sleep apnea
PSG: polysomnography
R-PPG: reflectance photoplethysmography
SaO2: arterial oxygen saturation
SNR: signal-to-noise ratio
SpO2: peripheral capillary oxygen saturation
StO2: peripheral tissue oxygen saturation
SvO2: venous oxygen saturation
T-PPG: transmission photoplethysmography
Edited by R Kukafka; submitted 07.09.20; peer-reviewed by A Vehkaoja, T Penzel; comments to author 20.10.20; revised version
received 26.02.21; accepted 24.05.21; published 29.07.21
Please cite as:
Zhang Z, Qi M, Hügli G, Khatami R
The Challenges and Pitfalls of Detecting Sleep Hypopnea Using a Wearable Optical Sensor: Comparative Study
J Med Internet Res 2021;23(7):e24171
URL: https://www.jmir.org/2021/7/e24171
doi: 10.2196/24171
PMID: 34326039
©Zhongxing Zhang, Ming Qi, Gordana Hügli, Ramin Khatami. Originally published in the Journal of Medical Internet Research
(https://www.jmir.org), 29.07.2021. This is an open-access article distributed under the terms of the Creative Commons Attribution
License (https://creativecommons.org/licenses/by/4.0/), which permits unrestricted use, distribution, and reproduction in any
https://www.jmir.org/2021/7/e24171 J Med Internet Res 2021 | vol. 23 | iss. 7 | e24171 | p. 15
(page number not for citation purposes)
XSL• FO
RenderXJOURNAL OF MEDICAL INTERNET RESEARCH Zhang et al
medium, provided the original work, first published in the Journal of Medical Internet Research, is properly cited. The complete
bibliographic information, a link to the original publication on https://www.jmir.org/, as well as this copyright and license
information must be included.
https://www.jmir.org/2021/7/e24171 J Med Internet Res 2021 | vol. 23 | iss. 7 | e24171 | p. 16
(page number not for citation purposes)
XSL• FO
RenderXYou can also read