Results Briefing: 1stHalf Results of 2022 Ending Feb - 6th October, 2021

Page created by Pauline Munoz
 
CONTINUE READING
Results Briefing: 1stHalf Results of 2022 Ending Feb - 6th October, 2021
R e s u l t s B r i e f i n g : 1 st H a l f
Results of 2022 Ending Feb.

 6th October, 2021
Results Briefing: 1stHalf Results of 2022 Ending Feb - 6th October, 2021
1      Impacts of the COVID-19 for 1H 02/FY22

     Associated with the fourth wave abating, business performance in June was on a recovery trend, but the impact of the COVID-19 expanded in July and beyond.

     The number of stores that are closed or open for shorter hours further increased, the business hours of stores in major metropolitan areas were reduced by about 10%

     compared to usual time in Q2. The business environment in Q2 was harsher than in Q1, with a greater impact on real stores.

     Number of new infections nationwide                                                                               2022年2⽉期     第2四半期(6⽉〜8⽉)
                                                                                                                            Q2 (June‐August) 02/FY22
                                                                                                                              A record high of new infections on July
                                                                                                                                           28, 2021 and
                        10,000 or more people                                                                                 The infections increase after that, too.
                         5,000 or more people
                         Less than 5,000 people                                                               The declaration of a state
                                                                                                                 of emergency was
                                                                                                              removed in 9 prefectures
                             2022年2⽉期    第1四半期(3⽉〜5⽉)
                                    Q1 (March‐May) 02/FY22                                                        on June 20,2021.

    June 20      The 3rd declaration of a state of emergency was removed in 9 prefectures, 7 of which shifted to priority measures for prevention of the spread of the COVID-19
    July 12      The 4th declaration of a state of emergency was issued in Tokyo and the declaration of a state of emergency was extended in Okinawa prefecture.
    August 2     The declaration of a state of emergency was extended for Tokyo and Okinawa, and a declaration of a state of emergency was issued in 4 prefectures and priority
                measures for prevention of the spread of the COVID-19 were issued in 5 prefectures.
    August 20    A declaration of a state of emergency was issued in 7 prefectures.
    August 27    A declaration of a state of emergency was issued in 6 prefectures.
Results Briefing: 1stHalf Results of 2022 Ending Feb - 6th October, 2021
2   Market Trends for 1H 02/FY22

Covid-19 environment is not an                      The days of mass-producing clothes
excuse for not selling products.                         in quantities not needed by the
Facing a very difficult environment                 market, burdening the environment,
in 1H, we broke away from the                        and selling them at a reduced price
“norm” of the past from business                                                are over.
management and operation and
                                       First Half
weʼve been working on reforms           Review           Rather than adjusting margins
thoroughly focusing on agility.                          through mass procurement, we
                                                            shifted to a highly profitable
As a result, we were able to achieve                structure with a high crossover ratio
certain targeted numerical results.                    that does not produce surpluses
                                                       through discounting or remaining
                                                                               inventory.
                                                               Breaking away from
                                                              “excessive”business
Results Briefing: 1stHalf Results of 2022 Ending Feb - 6th October, 2021
3     1H 02/FY22 TIP24 ※ Reform position
                                                                      Break away from the business model of the past
                                                                      We will put aside nostalgia for past businesses and take
                                                                      on new challenges, aiming to further pursue corporate
                                                                      value.

    Where we are now                                                                                                                                     The happiest
                                                                                                                                                            fashion
    The future we should                                                                                                                                   company
                                                                                                                                                         in the world

    aim for                                                                                                                          2023
                                                                  Organizational integration
                                                                       1st Phase completed                      2022

                                                                                              2021                 Growth and leap forward
                                                                                                                       Brands that can take on the world and
                                                                                                                       spread into neighboring regions
                                                                         2020                         Investment in the future
                                                                                                       Setup that nurtures personnel and business, EC, digital shift and fresh
                                                                                                       investment
                                                                          Painful innovation
                                                                             Withdrawing from businesses, closing stores, reducing
                                                                             labor costs…

    ※ TIP24(TSI Innovation Program 2024) is a name of in‐house program in regard to structural reform and future strategy started from 2022 Ending Feb.
Results Briefing: 1stHalf Results of 2022 Ending Feb - 6th October, 2021
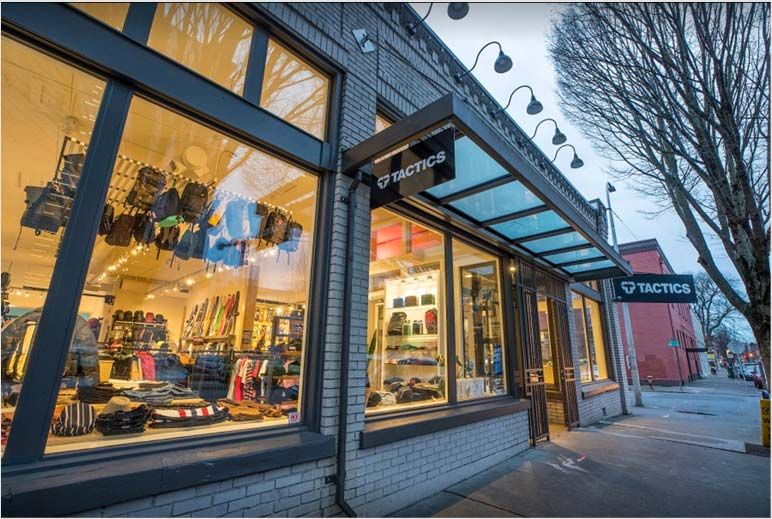
4   Market Trends for 1H 02/FY22

    Adherence to existing brands, sales channels, and business models means inefficient use of corporate
    assets, that is, people, goods, and money, and loss of market competitiveness and growth potential.

                                      2 things we should do in 2H
                                              and beyond

        Get out of inefficient business model                   Fashion entertainment will be the key
    1   with low productivity and pursue new
        apparel business ideals.
                                                          2     word for our future investment.

        Strengthen digital investment and reinforce a           Pursue products and services with even higher
        business model without fragmentation through            customer value in the new post-COVID-19 world
        real stores and EC cooperation.                         of value.

        Refine the structure of short-cycle, small-lot          Step forward to invest in the next generation
        procurement and strengthen supply chain                 creations (products, communications, services)
        reforms to ensure a high turnover of full-price         and businesses.
        products
Results Briefing: 1stHalf Results of 2022 Ending Feb - 6th October, 2021
AGENDA

1   Summary of Financial Results for 1H, 02/FY22

2   1H Business Situation

3   Business Overview by Channel

4   Action on SDGs

5   Balance Sheet and Future Investment Strategy

6   Full-year Forecast

7   Supplemental Materials
Results Briefing: 1stHalf Results of 2022 Ending Feb - 6th October, 2021
Summary of Financial
1   Results for 1H, 02/FY22
Results Briefing: 1stHalf Results of 2022 Ending Feb - 6th October, 2021
7   Financial Highlights for 1H 02/FY22

    Under tough market, we united to work on our business.
    1st half went well as planned.

                                                                                              1ST Half
            1ST    Half Net Sales                 1ST   Operating Profit                Quarterly Net Income

          64.75 Billion Yen                      1.13 Billion Yen                        1.89 Billion Yen
                  YoY 115.1%                    Against Plan Change +1.16 billion yen   YoY Change +16.32 billion yen
           Compared to year before last 79.1%   YoY Change +11.60 billion yen             Compared to year before last
                                                                                          Change 0.84 billion yen
                                                  Compared to year before last
           YoY Change +8.48 billion yen                                                 Compared to year before last 179.5%
                                                  Change 1.29 billion yen
Results Briefing: 1stHalf Results of 2022 Ending Feb - 6th October, 2021
8   Financial Highlights for Q2 02/FY22

    Net sales fell far short of the previous yearʼs level, but review of
    discounts/inventory/expense led to significant improvement in revenue
    against budget.
                   Q2ND                            Q2ND                                  Q2ND
                  Net Sales                     Operating Profit                   Quarterly Net Income

           30.54             Billion Yen   -1.14                  Billion Yen      -0.54                Billion Yen
                                           YoY Change +2.88 billion yen            YoY Change +3.44 billion yen
                 YoY 88.3%                 Compared to year before last            Compared to year before last Change
           YoY Change -4.05 billion yen    Change 0.94 billion yen                 0.88 billion yen
                                           Against Plan Change +1.16 billion yen   Against Plan Change +1.35 billion yen
Results Briefing: 1stHalf Results of 2022 Ending Feb - 6th October, 2021
9   Gross profit / SG&A expenses for 1H 02/FY22
                                                                                                            Unit : Billion yen            > Gross Operating Profit

                                     550                                      Gross Profit                                       56.0%    • Purchases were curbed to about 85.4% of the
                                     500       54.3%
                                                                                                               54.5%             55.0%       previous fiscal year's level.
    1ST   Half Gross Profit          450
                                                                53.9%            53.6%
                                                                                                                                 54.0%

    35.29 Billion yen
                                     400
                                                                                                                                 53.0%    • Profitability improvement through the sale of full-
                                     350
                                                                                 43.9                                            52.0%       price products for which sales opportunities were
                                     300       40.1             40.5
            YoY 146.0%                                                                           43.0%           35.3            51.0%
                                     250                                                                                                     not available in the previous fiscal year
     Compared to year before last
              80.4%                  200
                                                                                                 24.2                            50.0%    ⇒ Improved profit by \11.1 billion compared to
    YoY Change +11.13 billion yen                2018             2019            2020           2021             2022
                                             18年2⽉期
                                              Ending Feb.     19年2⽉期
                                                               Ending Feb.    20年2⽉期
                                                                               Ending Feb.    21年2⽉期
                                                                                              Ending Feb.     22年2⽉期
                                                                                                               Ending Feb.
                                                                                                                                          last year
                                                                      売上総利益
                                                                      Gross Profit           売上総利益率
                                                                                              Gross Profit Margin

                                                                                                            Unit : Billion yen           > SG&A expenses
                                    550
                                                                              SG&A Expenses                                  56.0%
    1ST   Half SG&A Expenses        500
                                                                                                                                         • Review of rent during the store closing period
                                             54.2%                                             61.6%                         55.0%
                                                              54.1%
                                                                              53.8%
    34.16 Billion yen
                                    450
                                                                                                                             54.0%
                                                                                                            52.8%                        • Work style reform, review of work system at
                                    400
                                                                                                                             53.0%         stores and headquarters
                                    350
                                                                              44.1                                           52.0%
           YoY 98.6%                300       40.0            40.7
    Compared to year before last                                                               34.6            34.2          51.0%       • Improvement of transportation costs by changing
                                    250
             77.5%                                                                                                                         logistics carriers
                                    200                                                                                      50.0%
    YoY Change -0.48 billion yen               2018            2019              2020           2021            2022
                                           18年2⽉期
                                            Ending Feb.     19年2⽉期
                                                             Ending Feb. 20年2⽉期
                                                                          Ending Feb. 21年2⽉期
                                                                                       Ending Feb. 22年2⽉期
                                                                                                    Ending Feb.
                                                                                                                                         ⇒ \9.9 billion improvement over the year before
                                                                      販管費
                                                                       SG&A              販管費率 SG&A                                       last
                                                                      Expenses            Expenses Rate
10   Difference from Disclosed Plan for 1H 02/FY22

     FY2/22 1H: \1.13 billion vs. disclosed plan of \-0.50 billion
     As the Covid-19 impacts prolong, the situation remains difficult standing at 90.8% of the sales plan.
     However, improved by \1.63 billion due to “big growth of golf and street casual
     brands” ,“improvement” in gross profit margin” and “reduction of SG&A expenses”
                                                                                                                                                 3.45                1.13                  1.63        Unit : Billion yen

                                                                                                                                                                                           1.63
          0                                                                                                                                                                              Improvement
                                                                                TIP24 reform effects                                                                                        versus
                                                                                                                                                                                           planning
                  ‐0.50                                         Improvement of \1.86 billion

                                                                                                                              0.89
                                                                                                    0.40
                                                                       0.57                                                                   ・Decreases in fixed costs and variable SG&A
                                                                                                                                              expenses due to sales decrease
                                                                                                                                              ・Extraordinary loss transfer by the COVID-19
                                         ‐3.68                                                                                                (personnel expenses, store rent, etc.), etc.
                                   Unachieved gross profit                                ※                             ※   Reduction of
               Operating profit                                 Improvement in gross          Improvement in gross                            Reduction of SG&A      Operating profit,
               1H disclosed plan   due to a fall in net sales   profit (valuation loss)       profit (valuation loss)       SG&A expenses     expenses at business
                                                                                                                            at headquarters
                                                                                                                                                                     actual
                                                                through sales restraint       through cost reduction                          unit

              ※ Changing the sales policy, we tried to reduce purchasing, sales costs and discount sales.
11         Operating Profit Trends for 1H 02/FY22
                                                                                                                                    > Operating Profit

           In the midst of the prolonged Covid-19 impacts, in terms                                                                   Operating profit \1.13 billion

           of 1H results, profitable for the first time in four years.                                                               Profit ratio 1.8%
                                                                                                                                      (Disclosed plan ‒\0.5 billion)

 14.0
                                                                                                1.8%           Unit
                                                                                                                2.0%: Billion yen
                                                                                                                                      EBITDA \3.06 billion EBITDA ratio 4.7%

 12.0            0.1%
                                    -0.2%               -0.2%                                                                       > Main factors
                                                                                                                 0.0%
 10.0
                                                                                                                                      ❶ Profitability of the strong golf business
     8.0
                                                                                                                 ‐2.0%
                                                                                                                                      ❷ Active street business with sales
     6.0
                                                                                                1.13                                growth potential
     4.0                                                                                                         ‐4.0%

                                                                                                                                      ❸ Contribution of overseas business, which
     2.0
                                                                                                                                    improved profitability through M&As
                                                                                                                 ‐6.0%
     0.0        0.10
                                   -0.19               -0.16                                                                          ❹ Improvement of inventory sales rate through
 ‐2.0
                                                                                                                 ‐8.0%
                                                                                                                                    appropriate yield
 ‐4.0
                                                                          -10.47
                                                                                                                                      ❺ Effects of suppression of purchasing and
 ‐6.0                                                                      -18.6%                                ‐10.0%             reduction of SG&A.
            2018 Ending Feb.   2019 Ending Feb.     2020 Ending Feb.                        2022 Ending Feb.
            18年2⽉期_上期          19年2⽉期_上期            20年2⽉期_上期 21年2⽉期_上期  2021 Ending Feb.   22年2⽉期_上期
                                           Operating
                                        営業利益 Profit           営業利益率
                                                                  Operating Profit Margin
12    Net income impact items for 1H 02/FY22

         Non-operating income was \1.12 billion due to dividend income/real estate income, etc.
         Extraordinary income reached \1.45 billion due to gain on sales of marketable securities, gain on sales of fixed
         assets, etc.
         COVID-19 impacts caused loss due to temporary closing -\1.0 billion, posting quarterly net income of \1.89
         billion and a profit margin of 2.9%.

                                                                                          ・ Gain on sale of investment securities 0.8
            1ST Half                                                                      ・Gain on sales of non-current assets 0.38                     Unit : Billion Yen
          Operating Profit            ・ Dividend income 0.41

      1.13 Billion yen                ・Equity method return on investment 0.14
                                      ・ Foreign exchange income 0.13
                                      ・ Real estate income 0.13
                                                                                                  1.45
                                                                                                                      -1.07
      Compared to year before last
       Change +1.30 billion yen                                              -0.26                                                         -0.51
     YoY Change +11.60 billion yen
                                                          1.12
                                                                         ・ Rental expenses
                                                                            on real estate 0.09
                                                                                                                 ・ Loss due to                                    1.89
               1STHalf                                                                                           temporary closing 1.0
                                                                         ・ Interest expenses 0.06
        Quarterly Net Income              1.13
      1.89 Billion yen                  Operating
                                       profit margin
                                           1.8%
                                                                                                                                                                 Net profit
                                                                                                                                                                  margin
                                                                                                                                                                  2.9%

                                        Operating        Non-operating    Non-operating          Extraordinary      Extraordinary        Income taxes   Net income attributable to
       Compared to year before last
                                         income            income           expenses                income             losses               deferred         owners of parent
        Change +0.84 billion yen
      YoY Change +16.32 billion yen
                                                                                                                                           Profit Attributable to Owners
                                                           Ordinary Income 2.0                    Profit Before Taxes 2.38
                                                                                                                                                  of Parent 1.89
2   1H Business Situation
14   Operating Profit Revenue Structure by Segment for 1H 02/FY22

      About our strong businesses in Japan
      (1)Golf, athleisure and street brand continued to drive profits.
      (2)Ladiesʼ brand business quickly shifted to an EC-centered strategy, making a big contribution to revenue.
      We aim to expand the business domain with our strong business group in the future.
             Domestic strong business
                           好調事業
              performance summary

              Net Sales   26.47
                          Billion yen

              Operating    3.43
               Income     Billion yen

              Operating
                profit    13.0%
               margin

      About our weak businesses in Japan
       There are some businesses that are suffering from changing business model because they make up a significant
       proportion of store sales,occasion demands and purchased items.
       As for the low profitable businesses,we will thoroughly review marketing,customers,design,product
       promotion,business structure and organizational structure.
       We will focus on rapid business reform with an eye to closure.
15    Strong Golf Category for 1H 02/FY22

     In addition to the effect of the Olympics, we succeeded to get new fans by proposing new
     attractive products.
     All five golf brands exceeded the plan, sales at last year and year before last as a result.

                                                                                                     In addition to the release of
                                                                                                     "Doraemon" collaboration items,
                                     Contracted golfer Mone                                          a golf competition was held at a
                                     Inami won the Japan                                             golf course wrapped in the
                                     Women's Golf                                                    world of Doraemon.
                                     Championship Konica
                                     Minolta Cup, following
                                     her Olympic silver                                                                              Unit : Billion Yen
                                                                       1ST Half Net Seles
                                     medal.                   12,000
                                                                       in GOLF Category                                        11.05
                                                              11,000

                                                              10,000
                                                                                              9.24
                                                               9,000
                                                                            8.07
                                                               8,000                                             7.60
                                                               7,000

                                                               6,000

                                                               5,000

                                                               4,000

                                                               3,000

                                                                        2019 Ending Feb. 2020
                                                                         2019年2⽉期             Ending Feb.
                                                                                           2020年2⽉期         2021 Ending Feb.
                                                                                                             2021年2⽉期          2022 Ending Feb.
                                                                                                                               2022年2⽉期
16    Street Category for 1H 02/FY22

      Step into investments more on a brand business that drives the street boom.

                                                                         With UNION celebrating its
                                                                         30th anniversary in its home
 After about 10 years,                                                   country, products that attract
 HUF opened a flagship                                                   attention from inside and
 shop again in San                                                       outside the street industry are
 Francisco, where it was                                                 released every month from its
 founded.                                                                individual brands and stores.
                                                                         Spurred by its popularity

                                                                                                                                                       Unit : Billion Yen
                                                                                      1ST Half Net Seles
                                                                                      in Street Category                                      8.09

                                                                                                         7.15
                                                                                        6.90

                                                                                                                           6.22

     “STÜSSY” opened a new flagship‐shop in Shibuya.
     It was created as a global chapter whose interior was directed by             2019 Ending Feb.   2020 Ending Feb.   2021 Ending Feb.   2022 Ending Feb.
     design studio in Los Angeles.
3   Business Overview by Channel
18
            Sales Trends by Channel for 1H 02/FY22

 Both composition rates of department stores and commercial facilities has decreased, but their sales has improved over 20% compared to the last year. EC

 channel went well. EC channels remained strong performance at 114.3% compared to year before last and at 101.2% compared to last year.

 Meanwhile, overseas business was at 134.1% compared to last year and shifted to a re-growth phase due to strong performance of TACTICS of the U.S.

                                                                                                                                                                                            Growth by channel
                                                    1ST Half                                       1ST Half                                      1ST Half
                                                                                                                                                                                  compared to year
                                                2020 Ending Feb.                               2021 Ending Feb.                              2022 Ending Feb.                      before last (%)        YoY (%)
              Department
                Stores
                                                10.84     Billion yen
                                            (Composition Rate (%):13.2)
                                                                                                5.10   Billion yen
                                                                                          (Composition Rate (%):9.1)
                                                                                                                                             6.31      Billion yen                          58.2          123.6
                                                                                                                                         (Composition Rate (%):9.8)
 Domestic

               Commercial
               Facilities(*1)
                                                41.96 Billion yen
                                            (Composition Rate (%):51.3)
                                                                                             22.76      Billion yen
                                                                                         (Composition Rate (%):40.5)
                                                                                                                                          27.35         Billion yen                         65.2          120.2
                                                                                                                                        (Composition Rate (%):42.3)

              E‐Commerce                        16.44 Billion yen
                                           (Domestic E‐Commerce ratio(%):
                                                                                              18.55 Billion yen
                                                                                         (Domestic E‐Commerce ratio(%):
                                                                                                                                        18.78               Billion yen
                                                                                                                                     ( Domestic E‐Commerce ratio(%):
                                                                                                                                                                                         114.3            101.2
                                                         23.7)                                         40.0)                                      35.8)

 Domestic Others(*2)                              9.06 Billion yen
                                             (Composition Rate (%):11.1)
                                                                                                6.21   Billion yen
                                                                                         (Composition Rate (%):11.1)
                                                                                                                                             7.43       Billion yen                         82.0          119.6
                                                                                                                                        (Composition Rate (%):11.5)

            Overseas(*3)                          3.52 Billion yen
                                              (Composition Rate (%):4.3)
                                                                                                3.61 Billion yen
                                                                                         (Composition Rate (%):6.4)
                                                                                                                                             4.85      Billion yen
                                                                                                                                       (Composition Rate (%):7.5)
                                                                                                                                                                                         137.6            134.1
*1 Fashion buildings, shopping centers, railroad station buildings, individual stores, outlet shops etc. except for department stores.
*2 Apparel businesses such as wholesale, intercompany sales and non‐apparel businesses of the group companies.
*3 Results of Efuego Corp. which operates EC sites centering on Tactics.com in the U.S. is to be consolidated from the second quarter of 2021 and onward. The results are recorded in overseas sales.
19    E-Commerce for 1H 02/FY22
      EC Business: 101.2% year on year

      TSI, which has a high ratio of EC, is at a plateau, but we will reinforce investments in systems and mechanisms for further growth.

      Meanwhile, looking at the content of the revenue structure, the highly profitable in-house EC ratio is 47.9%.

      In-house EC sales grew steadily at 110.7 % year on year. Expansion of our own customer base is in good shape.

                                             1ST Half                         1ST Half                         1ST Half                 compared to year
                                         2020 Ending Feb.                 2021 Ending Feb.                 2022 Ending Feb.              before last (%)
                                                                                                                                                                     YoY (%)

      Domestic E‐Commerce
         (ratio(%)) ※1
                                   16.44 Billion yen                18.55 Billion yen 18.78 Billion yen                                       114.3                   101.2
                                                      (23.7)                           (40.0)                            (35.8)              (+12.1pt)                (▲4.2pt)

           In‐house EC
            (ratio(%))
                                       5.17Billion yen                8.12 Billion yen                 8.99 Billion yen                       173.8                   110.7
                                                      (31.5)                           (43.8)                            (47.9)              (+16.4pt)                (+4.1pt)

      Overseas E‐Commerce
         (ratio(%)) ※2                0.22 Billion yen                1.47 Billion yen                1.60 Billion yen                        720.9                   108.5
                                                        (6.3)                          (40.9)                            (33.0)              (+26.7pt)                (▲7.8pt)

      E‐Commerce TOTAL
         (ratio(%))※1
                                     16.66 Billion yen 20.03 Billion yen                            20.38 Billion yen                         122.4                   101.8
                                                      (22.9)                           (40.0)                            (35.6)              (+12.7pt)                (▲4.5pt)
※1 Domestic E‐Commerce ratio excluding domestic and other sales (wholesale, company sales, etc.)
※2 Results of Efuego Corp. which operates EC sites centering on Tactics.com in the U.S. is to be consolidated from the second quarter of 2021 and onward. The results are recorded
   in overseas sales.
20   Brand Digital Communications for 1H 02/FY22

     Brand action with a focus on digital communications.
     Live commerce and the D2C brand have also been successful.

                          Arpege story                                                            D2C brand “MECRE”
       Strengthen customer contact points through live commerce                                  Full-scale debut this fall

                                    EC sales increased 119% YoY.
                                    In‐house EC sales
                                    grew 162% YoY.
                                                 119%           Unit : Billion Yen
                                                 increase

                                   1.65            1.54          1.83

                                   1ST Half FY    1ST Half FY    1ST Half FY
                                  Ending Feb.    Ending Feb.    Ending Feb.
                                      2020           2021           2022

                                                                                     D2C brand debut directed by influencer "MAI" with
                                  We enforced communication                          some 150,000 followers.
                                  with customers through live                        The first collection order-taking event held in July
                                  commerce.                                          was far better than planned.
21   New Customer Contact Points for Brands for 1H 02/FY22

     Some existing businesses has challenged new things, realizing collaboration
     with other brands and different types of industries.
        and wander is gaining momentum,                     nano・universe high-function T-shirts
       collaborating with 2 MONCLER 1952                   Start selling products at convenience stores

     The premium down jacket brand, Moncler, rolls      nano universe, which has created popular T-shirts
     out “Moncler Genius“, out of the series and        such as "Anti Soaked" (sweat stain prevention T-
     wander collaborates with ”2 MONCLER 1952           shirt) and "Jacket T" (T-shirt for jackets), has started
     MAN”, attracting attention from home and abroad.   to sell its products at convenience stores. Advance
                                                        sale at Lawson
4   Action on SDGs
23   Action on SDGs

                                                                         Board/Management meeting/
In order to accelerate the implementation of                               Sustainability Committee
the SDGs, we set up a promotion office.                                                      Formulate overall objective
                                                                                             and budget policy
We have tried to realize a sustainable society with a
project team. In order to work in unison, we set up a
specialized office.
                                                        Business Div.                                            Functional Div.

                                                                                    SDGs Promotion
                                                                                        Office

                                                                        ❶ Formulate draft response policy
                                                                        ➋ Make relevant departments well known
                                                                        ❸ Collect information, Hear opinions
24   Action on SDGs

     Environmental Initiatives expanding through Brands
     Commence activities that consider the environment through business

       Participation in “BRING™”, a clothing collection project               Redyeing discarded products, we sell them as new products.

                                                                            Weaving flaws and uneven dyeing that occur during the
                                                                            manufacturing process. Things that do not interfere with daily
      Recycle clothing that cannot be reused into                           use are reborn with new value as "OVERDYE PRODUCT".
                       resources                                            This fiscal year, the third in the series, we have expanded the
                                                                            initiative to five stores nationwide.

     Participation in BRING™, which is produced by JEPLAN, INC., a
     clothing collection project to recycle unwanted clothing and textile
     products.
     We will work together to achieve a recycling-oriented society.
25   Action on SDGs

     Achieve sustainable corporate growth through work style reforms
     To become a company, which is selected by an excellent human resources even under the new values of

     the future, we pursue a comfortable work environment for employees, the driving force of the company.

     Creating a safe working environment                                              Realization of flexible working style and efficient working environment

         We began distributing antigen test KITs to the entire group                       Our work style reforms achieved working at home over 50%.

     We entered into a capital and business alliance (April 2021)                      In order to support diverse and flexible work styles among
     with ICheck, a company that provides various testing services.                    employees, we encourage telework in principle in the COVID-
     As part of our efforts to establish a system that allows for                      19 pandemic (the company average attendance rate is over
     easy testing, we began distributing antigen test KITs to the                      50%). In addition, we started trial introduction of external
     entire group in June, with all costs subsidized by us.                            share office space and paying telework allowance. We will
                                                                                       continue to facilitate our work style reforms.
5   Balance Sheet and Future Investment Strategy
27        Balance Sheet and Future Investment Strategy
                                                                                                                                                                                           >   Cash & Deposits/Investment Securities

    Our financial position continues to be sound.                                                                                                                                          • Cash and deposits increased of \8.9
                                                                                                                                                                                             billion YoY.The main difference from
    Stimulate investment in business investments for 02/FY23.                                                                                                                                the previous forecast is \2.3 billion in
                                                                                                                                                                                             loan repayment.
    We will continue to make effective use of funds.
                                                                                                                                                                     Unit:Million Yen
                                                                                                                                                                                           • We will use cash and deposits and
                                                     1ST Half 2021 Ending          Cumulative Q1ST 2022
                                                                                                                                     1ST Half 2022 Ending Feb.                               investment securities to strengthen DX
                                                               Feb.                    Ending Feb.
                                                                                                                                                                                             investments and new business
                                                     Results
                                                                 Composition
                                                                                   Results
                                                                                               Composition
                                                                                                              Results
                                                                                                                         Composition       Y/Y
                                                                                                                                                     Y/Y (%)
                                                                                                                                                                 Q1/Q4
                                                                                                                                                                               Q1/Q4 (%)
                                                                                                                                                                                             development.(Overseas business/new
                                                                      Rate (%)                  Rate (%)                  Rate (%)       Change                  Change
                                                                                                                                                                                               brand development /M&A)
    Current Assets                                     69,048               44.8      76,430           51.5     73,439           50.6        4,391      106.4      -2,992           96.1

      (of Cash and Deposits)                           31,477               20.4      42,817           28.9     40,440           27.9        8,963      128.5      -2,376           94.4   > Inventory
      (of which, Inventory)                            21,913               14.2      18,793           12.7     18,716           12.9       -3,197        85.4        -77           99.6

    Non-current Assets                                 85,187               55.2      71,899           48.5     71,713           49.4      -13,474        84.2       -186           99.7   • Purchasing was curtailed and
      (of Investment Securities)                       24,583               15.9      29,440           19.8     28,865           19.9        4,282      117.4        -575           98.0     inventories were significantly reduced.
      (of Investment Real estate)                      16,516               10.7       4,974            3.4      4,966            3.4      -11,550        30.1            -8        99.8

Total Assets                                          154,235              100.0    148,329          100.0     145,152         100.0        -9,083        94.1     -3,177           97.9   • Inventories were suppressed to about
                                                                                                                                                                                             85.4% compared to the previous
    Current Liabilities                                50,648               32.8      28,357           19.1     27,195           18.7      -23,452        53.7     -1,162           95.9
                                                                                                                                                                                             quarter and improved 3.1 billion yen.
      (of Short-term borrowings)                       20,702               13.4        153             0.1        202            0.1      -20,500         1.0            49       132.1
      (of Current portion of long-term borrowings)      8,854                5.7       8,699            5.9      7,835            5.4       -1,019        88.5       -864           90.1

    Non-current Liabilities                            26,909               17.4      19,624           13.2     18,775           12.9       -8,134        69.8       -849           95.7
                                                                                                                                                                                           > Capital adequacy ratio
      (of Long-term borrowings)                        20,514               13.3      14,390            9.7     12,657            8.7       -7,857        61.7     -1,733           88.0

  Total Liabilities                                    77,557               50.3      47,981           32.3     45,970           31.7      -31,586        59.3     -2,010           95.8   • Capital adequacy ratio of 68.6%
  Total Net Assets                                     76,678               49.7    100,348            67.7     99,181           68.3       22,504      129.3      -1,167           98.8

Total Liabilities and Net Assets                      154,235              100.0    148,329          100.0     145,152         100.0        -9,083        94.1     -3,177           97.9
28   [Innovation in Profitability] About Future Financial Strategy

     About Global businesses-Introduction of the business in the U.S.
                            Based on our global strategy, we have organized growing businesses such as
                            snowboarding, skateboarding and street. In order to show our uniqueness, we will
                            make beneficial investment in strengthening cooperation in the United States, Japan
                            and Asia.

                            1St half Net Sales 1.3 Billion Yen, OP 0.1 Billion Yen and OP ratio10.7%
                                                                               1st half Net sales in overseas

                                                                               It's going well toward annual sales budget of
                                                                               9.9 Billion Yen.

                                                                                                                                            4.9
                                                                                                                                        Billion Yen

                                                                                        4.1                      3.8
 ■ Store in Portland, which opened June in 2019.
 Easing regulations as to covid-19 on May 2021 in the U.S, we could sell
                                                                                 1ST Half FY Ending Feb.   1ST Half FY Ending Feb.   1ST Half FY Ending Feb.
 limited items on our stores, which has been sold on our website. The stores              2020                      2021                      2022

 had a long line. It contributed to increase revenue in stores.
29   Digital Transformation Promotion for 1H 02/FY22

     We will strengthen supply chain by digital transformation.
     We will continue to strengthen efforts to innovate business models and
     systems using technology.
               Started Smart Factory Custom-Made                 Obtained DX certification from the Ministry of Economy,
       We aim for profitability reform by small-lot production   Trade and Industry. We aim to improve brand power and
                          with short cycle.                                     corporate value with DX

      TSI Sewing, which supports the Group's production,         We came to obtain the DX certification due to the following reasons:
                                                                 As a group-wide DX, we meet the certification standards set forth by
      is developing custom-made production using the             the Ministry of Economy, Trade and Industry (METI) for the
      flexibility of the Yonezawa Smart Factory.                 introduction of advanced technologies in Japan and abroad, such as
      We began production of FABRIC TOKYO's women's              3D CAD systems and digital customer service tools, and for its
                                                                 industry-leading EC business initiatives, and appropriate information
      order brand "INCEIN" on consignment in August.             is disclosed to stakeholders.

                                                                 (Reference) Regarding DX Certification System
                                                                 https://www.meti.go.jp/policy/it_policy/investment/dx-nintei/dx-nintei.html
6   Full-year forecast
31    Sales performance and forecast

      We will not change the full-year operating profit budget and net profit budget at this
      stage.
       Although operating income in the first half was strong with a planned difference of +1.63 billion yen,
       business conditions on September, that is one of the most profitable months, was very tough compared
                                                                                                                          Full-year sales budget
       to the budget. In order to improve profitability in November and December, we will take company-wide
       measures.                                                                                                        (compared to year before last)

                                                                                                     Operating Income
                                                                                                                                 89.6%
      Net Sales
     (VS FY Ending Feb. 2020)[%]
                                   ■ Changes in FY Ending Feb. 2022                                    [Billion Yen]

       100.0%                                                                                                     70
                                          1ST Half 2022 Ending                                 1   91.1%(2ND Half)        Full-year sales forecast
                                                   Feb.                                             (YoY 103.3%)         compared to year before last
        95.0%                                                                                                     60
                     Initial forecast line
        90.0%
                                      1St Half                   2Nd Half
                                                                                                                  50            82.2%
                                                                               Assuming
                                                                   Initial                     2   85.1%(2ND40Half)             YoY 104.3%
        85.0%                         79.1%                       budget
                                                                               3 scenarios
                                                                                                     (YoY 96.5%)
                                   (YoY 115.1%)
        80.0%
                                                                 91.1%                                            30
                                                                                                                        Full-year operating income
                                                                                                                                  budget
                                                                                               3   78.5%(2ND 20Half)
        75.0%   Achievements and
                latest forecasts line
                                                                                                     (YoY 89.0%)
                                                                                                                          1.1 Billion Yen
        70.0%                                                                                                     10
                                           Operating Income
                                                                                                                           Full-year Current Net
                                                  1.1
        65.0%                                                                                                     0            Incomebudget
                               Feb.
                               2021
                                              1St Half
                                            Mar-Aug 2021
                                                                 August September
                                                                                    2Nd Half
                                                                             Sep 2021〜Feb 2022
                                                                                                           Feb.
                                                                                                           2022         1.66 Billion Yen
32   Our WILL
                                                        Reprint of the Results Briefing Q1ST of 2022 Ending Feb.

                                                    We will improve the soundness of the business
                                                    with a precise management controlling.

                                                    Besides, we wil achieve advanced business
                                                    through supply chain reform, digital store
                                                    development, new services, new content
                                                    development, etc.

         We will start activities to create new businesses without staying in this market.
Striving to be the
happiest fashion company
in the world.

Becoming a company that creates
happiness for our shareholders,
customers, society and employees.
7   Reference Data
35    Highlights of 1ST Half Results for FY Ending Feb. 2022

      Overview                                                                                                                                   Unit:Million Yen
      (June to August)                                                                  Q2ND 2021 Ending Feb.                  Q2ND 2022 Ending Feb.

                                                                                                     Composition                Composition    Y/Y
                                                                                         Results                   Results                                  Y/Y (%)
                                                                                                      Rate (%)                   Rate (%)     Change

     Net Sales                                                                             34,588         100.0      30,536          100.0      -4,052         88.3
     Gross Profit                                                                          15,111          43.7      16,148           52.9       1,037       106.9
     SG&A Expenses                                                                         19,134          55.3      17,288           56.6      -1,846         90.3
        SG&A Expenses(excl. Goodwill Amortization, Depreciation and Amortization)          17,961          51.9      16,288           53.3      -1,673         90.7
        Goodwill Amortization                                                                 197           0.6         194             0.6            -2      98.6
        Depreciation and Amortization                                                         975           2.8         805             2.6      -170          82.5
     Operating Income                                                                       -4,023        -11.6       -1,139           -3.7      2,884            -
     Ordinary Income                                                                        -3,548        -10.3        -576            -1.9      2,972            -
     Extraordinary Income                                                                     351           1.0         928             3.0          577     264.2
     Extraordinary Loss                                                                       693           2.0         469             1.5      -224          67.7
     Profit Before Taxes                                                                    -3,891        -11.2        -117            -0.4      3,773            -
     Profit Attributable to Owners of Parent                                                -3,979        -11.5        -540            -1.8      3,438            -
     EBITDA ※                                                                               -2,850         -8.2        -139            -0.5      2,711            -
     *EBITDA=Operating Income + Goodwill Amortization + Depreciation and Amortization
36   Highlights of 1ST Half Results for FY Ending Feb. 2022

                                                                                                                                       Unit:Million Yen
     Overview                                                                    1ST Half 2021 Ending
     (March to August)                                                                     Feb.
                                                                                                                   1ST Half 2022 Ending Feb.

                                                                                              Composition               Composition    Y/Y
                                                                                 Results                      Results                              Y/Y (%)
                                                                                                  Rate (%)               Rate (%)     Change

 Net Sales                                                                          56,270           100.0     64,751        100.0     8,480        115.1
 Gross Profit                                                                       24,169            43.0     35,294         54.5    11,125        146.0
 SG&A Expenses                                                                      34,639            61.6     34,160         52.8      -478         98.6
     SG&A Expenses(excl. Goodwill Amortization, Depreciation and Amortization)      32,507            57.8     32,238         49.8      -268         99.2
     Goodwill Amortization                                                             389              0.7       389          0.6             -     99.9
     Depreciation and Amortization                                                   1,742              3.1     1,532          2.4      -209         88.0
 Operating Income                                                                   -10,469          -18.6      1,134          1.8    11,603             -
 Ordinary Income                                                                     -9,642          -17.1      2,002          3.1    11,645             -
 Extraordinary Income                                                                  418              0.7     1,443          2.2     1,024        344.5
 Extraordinary Loss                                                                  4,014              7.1     1,067          1.6     -2,946        26.6
 Profit Before Taxes                                                                -13,237          -23.5      2,378          3.7    15,616             -
 Profit Attributable to Owners of Parent                                            -14,434          -25.7      1,890          2.9    16,324             -
 EBITDA ※                                                                            -8,337          -14.8      3,056          4.7    11,393             -
 *EBITDA=Operating Income + Goodwill Amortization + Depreciation and Amortization
37   Highlights of 1ST Half Results for FY Ending Feb. 2022
                                                                                                                         Unit:Million Yen
     Net Sales                                    1ST Half 2021 Ending
                                                                                                  1ST Half 2022 Ending Feb.
     Per Channel                                              Feb.

                                                                                                                               Composition
                                                    Results      Composition        Results         Composition
                                                                                                                   Y/Y (%)       Rate Y/Y
                                                 (Million yen)       Rate (%)     (Million yen)      Rate (%)
                                                                                                                                 Change

              Department Stores                         5,107              9.1           6,314              9.8       123.6            0.7

              Commercial Facilities(*1)                22,768             40.5         27,359             42.3        120.2            1.8

                  In-house EC                           8,124             14.4           8,993            13.9        110.7           -0.5

                  3rd Party                            10,434             18.5           9,792            15.1          93.8          -3.4

              E-Commerce                               18,559             33.0          18,785            29.0        101.2           -4.0

              Others(*2)                                6,218             11.1           7,438            11.5        119.6            0.4

              Domestic                                 52,653             93.6          59,898            92.5        113.8           -1.1

              E-Commerce                                1,508              2.7           1,603              2.5       106.3           -0.2

              Overseas(*3)                              3,617              6.4           4,852              7.5       134.1            1.1

            E-Commerce TOTAL                           20,067             35.7          20,388            31.5        101.6           -4.2

            TOTAL                                      56,270            100.0          64,751           100.0        115.1                 -
          *1 Fashion buildings, shopping centers, railroad station buildings, individual stores, outlet shops etc. except for department stores.
          *2 Apparel businesses such as wholesale, intercompany sales and non-apparel businesses of the group companies.
          *3 Results of Efuego Corp. which operates EC sites centering on Tactics.com in the U.S. is to be consolidated from the second

             quarter of 2021 and onward. The results are recorded in overseas sales.
38    Highlights of 1ST Half Results for FY Ending Feb. 2022

                                                                                                                             Unit:Million Yen
      Brands Overview                   1ST Half 2021 Ending Feb.             1ST Half 2022 Ending Feb.                      Y/Y

                                             Composition   Gross Profit             Composition   Gross Profit                Gross Profit
                                    Sales                                  Sales                                 Sales (%)
                                              Rate (%)     Ratio (%)                 Rate (%)      Ratio (%)                   Ratio (pt)
       1.    nano・universe           8,004          14.2            36.1    7,598          11.7           46.2        94.9            +10.1

       2.    PEARLY GATES            5,315           9.4            47.2    7,136          11.0           63.6       134.3            +16.4

       3.    MARGARET HOWELL         3,509           6.2            43.4    5,173           8.0           66.4       147.4            +23.1

       4.    NATURAL BEAUTY BASIC    5,066           9.0            43.1    4,978           7.7           58.8        98.3            +15.6

       5.    HUF                     1,778           3.2            45.6    2,749           4.2           51.2       154.6              +5.6

       6.    AVIREX                  2,359           4.2            55.4    2,535           3.9           59.4       107.4              +3.9

       7.    UNDEFEATED              1,887           3.4            40.6    2,493           3.9           41.7       132.1              +1.2

       8.    STUSSY                  2,049           3.6            62.9    2,076           3.2           70.1       101.3              +7.2

       9.    ROSE BUD                1,839           3.3            34.5    1,669           2.6           45.0        90.8            +10.5

      10.    new balance golf        1,069           1.9            37.1    1,646           2.5           57.8       153.9            +20.6

     TOP10                          32,880          58.4            43.6   38,057          58.8           56.6       115.7            +13.0

     Other Brands                   21,479          38.2            42.6   26,649          41.2           51.6       124.1              +8.9

     Continuing Brands              54,360          96.6            43.2   64,707          99.9           54.5       119.0            +11.3

     Closed Brands                   1,910           3.4            35.7       43           0.1         114.0          2.3            +78.3

     TOTAL                          56,270         100.0            43.0   64,751         100.0           54.5       115.1            +11.6
39   Highlights of 1ST Half Results for FY Ending Feb. 2022

     Domestic Monthly Sales Information
                                      1ST Half 2021 Ending Feb.                 All Stores       Existing Stores            Q1ST 2022 Ending Feb.
                                          All Stores:66.6%                                                                   All Stores:149.2%
                                       Existing Stores:82.0%                                                               Existing Stores:108.0%

          220.0
                                                                                                                                        218.4
          205.0

          190.0

          175.0
                                                                                                                                                    159.3
          160.0

          145.0

          130.0
                                                                                                                                113.0
                         110.6                                                                                     110.5                    110.4
                                                                                101.7
          115.0
                                 105.7                                                                                                                               98.0
                                                                                                                                   98.3                 90.9
                                             93.5
          100.0                                                                                             89.0                                                            86.3
                                                              84.3                      84.8   87.2
                                                     82.8              83.1
                                                              81.2              97.1                                   88.0
           85.0                                                                                                                                                95.0
                  66.6                                                                                67.0
                                              90.8                                             86.1                                                    88.3
                         65.4                                                           82.4
           70.0                                       80.1           77.0                                                                                                   82.8

           55.0                                                                                         66.9

                          33.7        43.3
           40.0

           25.0
                   3       4      5           6        7        8           9   10       11    12       1          2        3       4           5       6        7           8

                                                             Ending Feb.2021                                                               Ending Feb.2022
40   Highlights of 1ST Half Results for FY Ending Feb. 2022

     The Number of Stores

                                     1ST H alf 2021      FY Ending Feb.   St ore       St ore       1ST H alf 2022          Y/Y        Q2/Q4
                                      En d in g Feb .        2021         O p en       Clos e        En d in g Feb .       Change      Change

                         Domestic                 983               872      +19          -43                    848          -135         -24

         Ap p arel       Over seas                  64               52        +1           -5                     48          -16             -4

                             Total             1,047                924      +20          -48                    896          -151         -28

       R es t au ran t   Domestic                   11                9            -            -                      9          -2            -

       Cos met ics       Domestic                   27               33        +4           -5                     32             +5           -1

                     Total                     1,085                966      +24          -53                    937          -148         -29
Descriptions about future within this document are based on the information that the company obtains on the date of this report and
certain assumptions deemed to be reasonable. Actual earnings may differ materially from various future factors.
You can also read