Roof Failure Mechanism of Thin Bedrock Working Faces under Loading and Analysis Based on Microseismic Monitoring Technology
←
→
Page content transcription
If your browser does not render page correctly, please read the page content below
Hindawi
Geofluids
Volume 2022, Article ID 7566637, 10 pages
https://doi.org/10.1155/2022/7566637

Research Article
Roof Failure Mechanism of Thin Bedrock Working Faces under
Loading and Analysis Based on Microseismic
Monitoring Technology

 Wei Miao ,1,2 Lin Zhao,1 Shiqi Liu ,1 Wenhao Jiang,3 Ermeng Zhang,1 and Jingkai Li 1

 1
 School of Energy and Mining, China University of Mining and Technology, Beijing 100083, China
 2
 Jiaozuo Coal Industry Group, Henan Province, Jiaozuo City 454000, China
 3
 Zhaoguyi Coal Mine, Henan Province, Xinxiang City 453634, China

 Correspondence should be addressed to Wei Miao; wilson09@126.com and Shiqi Liu; liushiqi0217@qq.com

 Received 15 September 2021; Accepted 12 January 2022; Published 16 March 2022

 Academic Editor: Zetian Zhang

 Copyright © 2022 Wei Miao et al. This is an open access article distributed under the Creative Commons Attribution License,
 which permits unrestricted use, distribution, and reproduction in any medium, provided the original work is properly cited.

 The resistance transfer coefficient of supports plays an important role in support selection in coal mines, which is the main factor
 in support crushing accidents. Based on the key layer theory, the formula for calculating the resistance transfer coefficient of
 supports under the load of a loose layer was deduced. The analysis of four working faces with thick loose layers and the
 corresponding mining pressure data were used to deduce the load transfer coefficients of the thick loose layers and ultimately
 illustrate the relationship between thick loose layers and different influencing factors. By using microseismic technology to
 monitor the process of roof failure in a thin bedrock working face with a thick loose layer during mining, the roof failure
 characteristics of a large-mining-height working face under the load of a thick loose layer were further verified. The results show
 that a thicker loose layer and thinner bedrock caused more of the load to transfer to the working face, the roof microseismic events
 were mainly concentrated in the range of 60 m to 75 m above the coal seam, and the most active events occurred during the square
 stage (the length of the working face’s goaf is equal to its width). The height of the water-conducting fracture zone was analyzed by
 microseismic data and then verified with theoretical calculations.

1. Introduction layers. A dynamic loading method for achieving a reasonable
 working resistance of the working face was proposed [1, 2].
There is a widely distributed layer of thick and loose rock Additionally, the law of the random horizontal movement of
overlying a coal seam in eastern and northern China. Often, the thick loose layer under the influence of mining was
the roof bedrock is thinner than the height of the water- summarized [3]. The coal seam overburden movement and
conducting fracture zone, which is a typical thin bedrock the control mechanism of thin bedrock coal seams with thick
under a thick loose layer, with single key strata. There are loose layers were studied by various methods [4–6], and the
great differences between thin bedrock working faces and results showed that the stability of the overburden mainly
thick bedrock working faces in terms of stratal movement depended on the thickness of the bedrock and loose layers
and overburden failure. According to the many cases of roof [7, 8]. Engineering practice has shown that, at the working
caving and roof flooding accidents in China, working faces faces, a significant difference in the movement of the thick
with thin bedrock and thick loose layers are more likely to loose layer and the bedrock was observed [9].
experience roof carving, roof water, and sand collapse ac- A large number of theoretical studies have focused on
cidents, which greatly threatens coal mine safety. the movement and deformation laws of overlying strata and
 Many studies have been conducted to prevent roof loose strata [10, 11], but the specific influence of loose layer
pressure disasters in mines with thin bedrock and thick loose overload on the working face has not been studied and

2 Geofluids

analyzed; furthermore, the load transfer coefficient of a thin is 0.24∼0.30 [14]. Due to the obvious difference in the
bedrock working face with a thick loose layer has not been structure between the upper strata and the loose strata, the
deduced. This paper is based on four typical engineering transfer coefficient is also greatly different.
examples collected from different mines of thin bedrock in Based on the known maximum working resistance P of
China. According to the specific influence of the loose layer the support in the thin bedrock working face and the for-
load on the working face supports under the condition of mula above, the transfer coefficient Ks of the load of the loose
thin bedrock, the transfer coefficient is obtained, and its layer to the working face is deduced:
influencing factors are analyzed. To monitor the process and P − PZ + T tan(ϕ − θ) − QJ − QL
the distribution features of working face roof breakage, KS � , (4)
microseismic monitoring technology was used at a typical hsi csi
thin bedrock working face with a thick loose layer. Based on where QJ is the weight of the bedrock transfer load and QL is
the distribution features of the microseismic events in the the load weight of the upper hard roof on the working face
coal seam, the overall height of the caving zone and the support.
water-conducting fracture zone distribution are determined.

2. Theoretical Analysis and Governing Equation 2.2. Analysis of the Load Transfer Coefficient of the Loose Layer
 in the Working Face. Table 1 shows the pressure observation
2.1. Analysis of the Loose Layer Load Transfer Effect on the data of four typical thick loose layer working faces during
Working Face. The influence of the loose layer load on the mining and the geological data from different mining areas
resistance of the working face supports is mainly transmitted in China; these data are used to deduce the loose layer load
through the upper hard roof load. A load on the loose layer is transfer coefficient. Because the top coal is not completely
transmitted downward to the upper hard roof and then released in the top coal caving process, the top coal release
further transmitted downward to the working face. There- rate is calculated to be 60%. According to (4), the load
fore, a simple mechanical model is established; that is, in a transfer coefficient of the loose layer is obtained by
coal seam with a thick loose layer and thin bedrock structure, substituting the data of each working face, which are
the load carried by the working face (P) contains the sup- summarized in Table 1. The friction factor used in the
porting force on the bedrock key layer and the supporting process of calculating tan (φ − θ) is 0.8, the hulking coeffi-
force on the immediate roof: cient is 1.3, the mudstone and coal powder sandstone
 hulking coefficient is 1.50, and the transfer coefficient of the
 P � P 1 + P2 , (1)
 bedrock is set at 0.2. Table 1 shows that the load transfer
where P1 is the supporting force of the broken rock block coefficient of the thick loose layer ranges from 0.017 to 0.087.
and P2 is the total supported weight of the immediate roof, Other working face data can be analyzed similarly to de-
false roof, and top coal within the range of the roof control termine the load transfer coefficient of the loose layer.
distance. According to the derivation results in Table 1, the re-
 gression curve and the regression equation between bedrock
 P2 � ΣhcL, (2) thickness and transfer coefficient are obtained, which are
 shown in Figure 1.
where Σh is the thickness of the immediate roof, c is the unit Figure 1 shows that with the increase in the thickness of
weight of the immediate roof, and L is the hanging arch the bedrock in the working faces, the transfer coefficient of
length of the immediate roof. the loose layer decreases. The relation between the transfer
 In the calculation of the fracture support force of the key coefficient and the thickness of bedrock is as follows: when
strata, the overburden load consists of the load of the loose the bedrock is thinner than 40 m, the transfer coefficient
layer and the load of the key strata in the bedrock, which are decreases slowly; when the bedrock is thicker than 40 m, the
the main factors causing the instability of the key strata. transfer coefficient decreases rapidly; and when the bedrock
Researchers [12, 13] have performed a large number of field is thicker than 50 m, the transfer coefficient approaches zero.
measurement studies and concluded that the load transfer It can be concluded that the thickness of bedrock has an
effect in the rock strata above the working face does not obvious influence on the load transfer coefficient of the loose
consider all the weight loaded on the key strata. With layer, and the characteristics can be summarized as follows:
transfer coefficients Ks and Kj, the formula of the upper load First, the increase in bedrock thickness is conducive to the
of the key layer is summarized as formation of a stable bedrock layer structure. The thick
 QZ � KS hsi csi + KJ hji cji , (3) bedrock can effectively reduce the subsidence of the rock
 strata, enhance the stability of the overburden, and efficiently
where Qz is the weight loaded on the working face, hsi is the form a stable “voussoir beam” structure, which can bear the
thickness of the different soil layers, hji is the thickness of the load of the overlying loose layer and reduce its transfer
different rock layers, csi is the unit weight of the different soil coefficient. Second, the increase in bedrock thickness slows
layers, and cji is the unit weight of the different rock layers. the pressure transfer in the working face. As seen from the
 Researchers have established a geomechanical model mining pressure performance data of the working face in
and deduced that the load transfer coefficient Kj of the upper Table 1, the increase in bedrock thickness improves the
strata of a thin bedrock working face with a thick loose layer stability of the roof to a certain extent and mitigates the
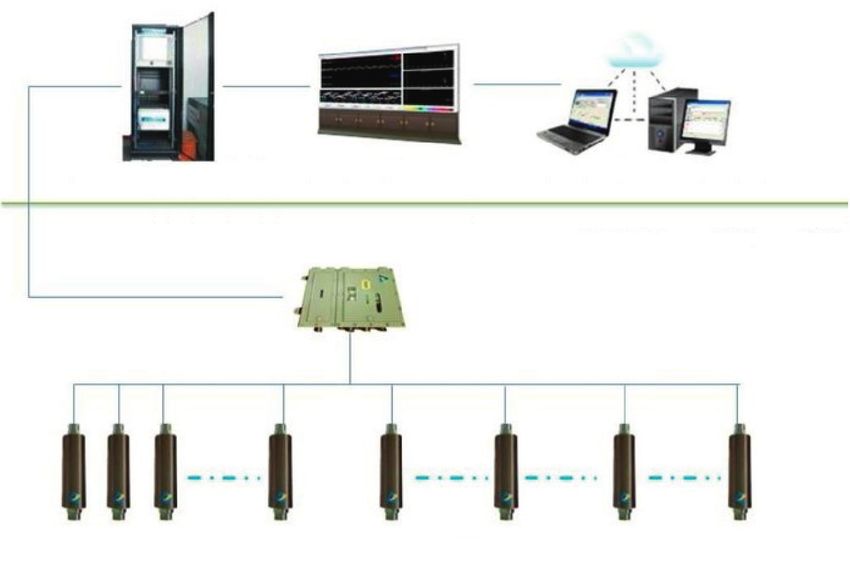
Geofluids 3

 Table 1: Statistical table of data related to the transfer coefficient of the loose layer in the working face.
 First Periodic Maximum Mining Thickness of
 Thickness of Mining Transfer
Working face weighting weighting resistance height loose layer
 bedrock height coefficient
 distance (m) distance (m) (kN) (m) (m)
Longdong Coal Mine
 41.34 2.4 22 12 3840 270 228.66 0.017
7130 working face
Longdong Coal Mine
 27.83 2.4 25 15 4120 230 202.17 0.073
7128 working face
Zhuxianzhuang Coal
Mine 870 working 15.9 2.2 28 10 2800 280 264.1 0.083
face
Zhaoguyi Coal Mine
 40.1 3.5 18.9 9.5 7980 510 465.7 0.05
11071 working face

 0.1 According to the above analyses, roof collapse and roof
 Y=-0.0001x2 + 0.0037x + 0.05 water disasters are more likely to occur at working faces with
 0.09
 R2 = 0.8532 thin bedrock and thick loose layers, and it is necessary to
 0.083
 0.08 predict the deformation and failure patterns of roof rock in
 0.073
 the working face [15, 16]. The methods used to conduct
 0.07 prediction mainly include the empirical formula method,
 transfer coefficient

 numerical simulation method, borehole observation
 0.06
 method, and electric detection method. The accuracy of the
 0.05 0.05 empirical formula method and numerical simulation
 method is lower than that of the field measurement results,
 0.04 while the borehole observation and electrical method are
 0.03
 mainly in the form of point observations, and the obser-
 vation results have certain limitations [17].
 0.02
 0.017
 0.01 3. Construction of the Microseismic Monitoring
 0
 System at the Working Face
 10 20 30 40 50
 thickness of bedrock (m) 3.1. Principle of Microseismic Monitoring Technology. The
 process of surrounding rock stress change is inevitably ac-
Figure 1: The regression curve of bedrock thickness and transfer companied by rock mechanics phenomena such as crack
coefficient. expansion and rock mass rupture [18, 19], which lead to
 microseismic events. Microseismic monitoring technology
damage to the balanced structure of key layers. Third, as the captures the small vibration signals generated by rock rupture
thickness of the bedrock gradually increases, the load during the formation of water-inrush channels through
transfer coefficient of the loose layer decreases. multiple sets of high-sensitivity geophones arranged in the
 In addition, the thickness of the loose layer has a sig- mining space; the data from the geophones and resulting focal
nificant influence on the load transfer coefficient of the loose mechanisms are interpreted to locate events in time and space
layer. According to the comparison between the 7130 working [20] and dynamically analyze the rupture degree and range of
face of the Longdong Coal Mine and the 11071 working face the surrounding rock (especially water-resistant coal pillars).
of the Zhaoguyi Coal Mine in Figure 2, it can be concluded A microseismic monitoring system is mainly composed of
that the 7130 working face of the Longdong Coal Mine and working face geophones, underground master stations, ground
11071 working face of the Zhaoguyi Coal Mine are similar in master controllers, and ground computer terminal modules.
terms of bedrock thickness, mining height, first weighting The KJ551 microseismic monitoring system was adopted in
distance, and periodic weighting distance; however, the this study, and its components are shown in Figure 3.
thickness of the loose layer of the 11071 working face is A 20 mm diameter anchor rod is required to install a
approximately twice that of the 7130 working face, and the geophone in the roadway position, and the anchor rod
transfer coefficient of the loose layer of the 11071 working face length in the roof needs to be more than 0.5 m. Thus, full-
is nearly three times that of the 7130 working face. length resin anchorage (more than 0.5 m) was required to
 It can be summarized that a thicker loose layer will cause a ensure stability. To ensure that the anchor rod and the roof
greater load on the bedrock and destroy the balance structure were connected firmly, the tray was not installed on the
formed by key layers in the bedrock layer, which intensifies lower side of the anchor rod. The geophone was fixed on
the movement of the roof of the working face and makes it the anchor rod to ensure that the geophone installation
difficult to form a stable structure in the bedrock layer; was in a vertical and downward direction, as shown in
therefore, the transfer coefficient of the loose layer increases. Figure 4.

4 Geofluids

 Periodic Thickness
 Thickness of Mining First weighting Transfer
 weighting of loose
 bedrock (m) height (m) distance (m) coefficient
 distance (m) layer (m)

 7103 working face 41.34 2.4 22 12 228.66 0.017

 11071 working face 40.1 3.5 18.9 9.5 465.7 0.05

 7103 working face
 11071 working face
 Figure 2: Comparison chart between the 7130 working face and 11071 working face.

 Ground computer Real time Ground master Ground
 terminal modules monitoring controller Underground

 Underground
 master station

 Working face sensors

 Figure 3: Microseismic monitoring system components.

3.2. Construction of a Working Face Microseismic System. With working face advancement, when the distance
A total of 4 roof geophones were installed in the working between the working face and the geophones became less
face, and the first roof geophone was installed 30 m from the than 20 m, the geophones were moved outside and main-
open-off cut tunnel in the roadway. The distance between tained at a spacing of 200 m from adjacent geophones. In this
each geophone in the same roadway was 200 m, and the way, the geophones remained around the working face until
initial layout is shown in Figure 5. the end of the advancement.

Geofluids 5

 Drill hole Φ 28 mm

 ≧500 mm
 Resin
 anchorage ≧2400 mm
 Anchor
 Φ 20 mm
 rod

 The roof

 150 mm

 The
 geophone

 Figure 4: Installation diagram of roof geophone.

 16001working face upper roadway

 30 meters 200 meters
 16001 working face open-off cut tunnel

 16001 working face

 16001 working face donw roadway
 roof geophone

 Figure 5: Plan of initial geophone layout.

4. Analysis of Roof Failure Characteristics Table 2: Roof strata of the coal seam.

The microseismic monitoring system was installed in the Thickness range (m)
 Roof type Lithology
 Average thickness (m)
16001 working face of the Zhaoguyi Mine to monitor and
analyze the roof failure characteristics during working face 2.1–12.3
 Upper hard roof Medium sandstone
mining. The mining thickness was 5.8 m to 6.8 m, the roof 7.2
elevation was −429.9 m to −499.0 m, the working face was 5.3~21.7
 Immediate roof Sandy mudstone
205 m long, the roadways were 901.5 m long on average, with 13.5
a flat area of 185258.25 m2, the bedrock thickness ranged from 0.2~1.4
 False roof Mudstone
50.0 to 73.7 m, and the loose layer thickness was 410 m. The 0.8
mining method was large mining height and full thickness
mining. Table 2 shows the roof strata of the coal seam. with a total energy of 7851083 J and a daily average energy of
 Monitoring was conducted from January 17, 2018, to 23,719 J were analyzed. According to the 16001 working face
January 30, 2019, and a total of 21509 microseismic events mining method, microseismic monitoring results, and mine
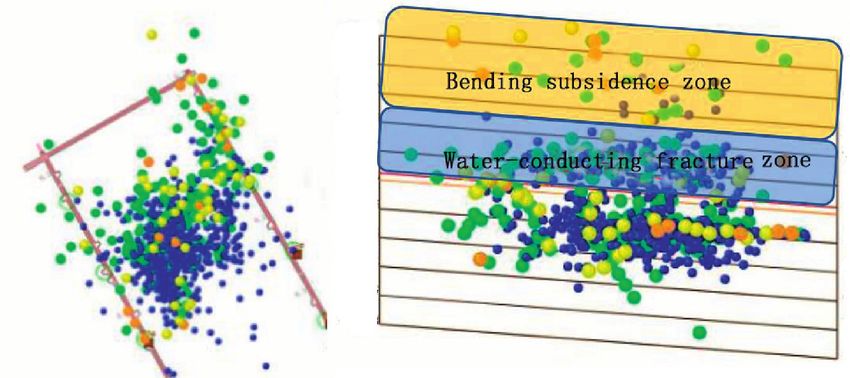
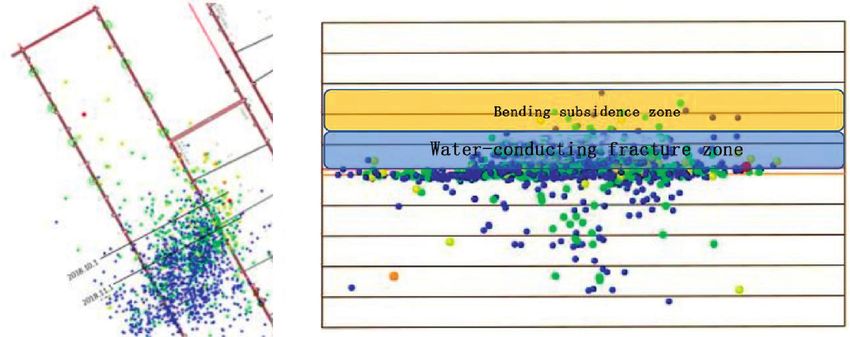
6 Geofluids

pressure observation results, the working face mining discontinuously distributed, which was consistent with the
process can be divided into different mining stages: the characteristics of the formation of a high density of rock
initial mining stage, the stage before the square stage, the fractures. Therefore, it was difficult to form a water-con-
square stage (the length of the working face’s goaf is equal to ducting fracture zone above 60 m from the coal seam, and
its width), the stage after the square stage, and the final stage. the height of the water-conducting fracture zone in the roof
 was approximately 60 m, which was relatively close to the
 thickness of bedrock.
4.1. The Characteristics of the Initial Mining Stage. The initial
mining stage of the 16001 working face was from January 9
to February 21. During this time, the working face was 4.3. The Characteristics of the Square Stage. In the period of
advanced 65.1 m, the daily frequency of microseismic events May 11 to June 9, the working face advanced from 185 m to
in this stage was 83 times, and the average daily energy was 310 m (measured from the open-off cut tunnel), the average
15,408 J. From January 19 to January 23, the daily frequency daily frequency of the microseismic events was 100 times,
of microseismic events reached 141 times, a 69.8% increase and the average daily energy of the microseismic events was
compared to the period before, and the average daily energy 59,616 J. Compared with the previous stages, the energy
released by surrounding rock failure was 26,295 J, a 70.6% distribution range of microseismic events increased signif-
increase compared to the period before. According to the icantly, and the range of events of 500 J to 1,000 J and the
microseismic monitoring results, the first weighting of the range of events above 1,000 J increased by 11.9%. This period
working face occurred in this period, and the first weighting is considered to be the square stage.
distance was 27 to 37 m. Figure 6 shows that failures of the Compared with the stage before the square stage, in the
surrounding rock were mainly caused by weak energy in the square stage, the height of the caving zone of the working
initial mining stage, and the microseismic events in the roof face was increased (Figure 8). The microseismic events in the
were mostly concentrated within 30 m above the coal seam. roof were mainly concentrated within 75 m above the coal
 Compared with the working resistance of the supports in seam, and the highest distribution position reached ap-
the 16001 working face, the characteristics of the initial proximately 190 m above the coal seam. The density of
mining stage were as follows: The pressure detection exten- microseismic events within 75 m to 190 m above the coal
sion sites in the working face showed that the working face seam was far less than that within 75 m above the coal seam,
support resistance remained stable before January 21, which and the microseismic events within 75 m to 190 m above the
was 6341 kN to 8449 kN. The working resistance of the coal seam were high energy and had a scattered and dis-
support increased obviously from January 21 to January 23, continuous distribution, which can be seen in Figure 8.
during which time the working face advanced 33 m to 37 m There were only 8 to 10 energy events over 100,000 J in the
from the open-off cut tunnel. The working face support re- upper strata (marked with red circles); therefore, it was
sistance increased from 9119 kN to 14223 kN. According to challenging to form a water-conducting fracture zone above
the support resistance monitoring results, the first weighting 75 m. Analysis suggests that the height of the water-con-
of the working face occurred on January 22, during which ducting fracture zone was approximately 75 m in this stage,
time the working face advanced approximately 35 m from the which was close to or exceeded the thickness of the bedrock.
open-off cut tunnel, and clear increases in pressure and
deformation, such as coal wall sliding, occurred frequently.
 4.4. The Characteristics of the Stage after the Square Stage and
 the Final Stage. In the stage after the square stage and the
4.2. The Characteristics of the Stage before the Square Stage. final stage, the average daily energy of the 16001 working
In the period of February 21 to May 9, the working face face decreased to 11,442 J. The energy of microseismic events
advanced from 65 m to 185 m (measured from the open-off between 100 J and 500 J accounted for 70% of the total
cut tunnel). Compared with the initial mining stage, the amount of energy recorded in the two stages, which indi-
average daily frequency of microseismic events was 46 times, cated that the main damage to the surrounding rock oc-
the average daily energy was 7,647 J, and the damage to the curred near the coal seam, the energy was obviously weaker
surrounding rock decreased and maintained stable condi- than that in the square stage, and the movement of the
tions. It is concluded that in the stage before the square stage, surrounding rock was relatively stable.
the energy of most microseismic events was less than 500 J, Figure 9 shows that the height of the water-conducting
and the events between 100 J and 300 J accounted for nearly fracture zone in the roof of the stage after the square stage
50% of the events, which indicated that the degree of rock was approximately 60 m, which was lower than the height of
failure was low. the water-conducting fracture zone in the square stage.
 Figure 7 shows that the microseismic events that occur in
the roof were mainly concentrated within the range of 60 m
above the coal seam, and the highest distribution position 4.5. Comparison of Three Stages. By comparing the distri-
was approximately 170 m above the coal seam. The density of bution of microseismic events from the stage before the
microseismic events within 60 m to 170 m above the coal square stage to the stage after the square stage, the following
seam was far less than that within 60 m above the coal seam. characteristics can be found: The energy of microseismic
In addition, the microseismic events within 60 m to 170 m events in the square stage was significantly higher than that
above the coal seam were high energy, being scattered and in the other two stages (Table 3), and the energy that greater
Geofluids 7

 -310.8
 -335.2 -335.8
 -360.2 -360.8

 -385.2 -385.9

 -410.3 -410.9

 -435.3 -436.0

 -460.4 -461.0

 -485.4 -486.1

 -510.5 -511.1

 -535.5 -536.1

 -560.5 -561.2

 -585.6

 Figure 6: Plan and profile of the 16001 working face microseismic event distribution in the initial mining stage.

 -307.1

 -332.1 -337.2
 -357.2 -362.3
 -382.3 -387.4
 -407.3 -412.4
 -432.4 -437.5
 -457.5 -462.6
 -482.6 -487.7
 -507.6 -512.7
 -532.7 -537.8
 -557.8 -562.9

 -587.9

 Figure 7: Plan and profile of the 16001 working face microseismic event distribution in the stage before the square stage.

 -348.6
 -360.1
 -373.6
 -385.1
 -398.7
 -410.1
 -423.7
 -435.1
 -448.7
 -460.1
 -473.7
 -485.1
 -498.7
 -510.1
 -523.7
 -535.1
 -548.7
 -560.1
 -573.7
 -585.1
 -598.7
 -610.1

 Figure 8: Plan and profile of the 16001 working face microseismic event distribution in the square stage.

than 500 J increased significantly According to the mech- the seismic events were mainly distributed in 75 m range
anism of structure in the mining length space, when the above roof in the square stage; in stage after the square stage,
length of the working face’s goaf is equal to its width, the microseismic events were again distributed in 60 m range
mining supporting pressure reaches the maximum, which is above roof, which indicated that the square stage was the
in accord with the microseismic monitoring results. most active phase of roof rock failure, and the process of
Therefore, the seismic events were mainly distributed in water-conducting fracture zone development was recurrent
60 m range above roof in the stage before the square stage; fluctuating.
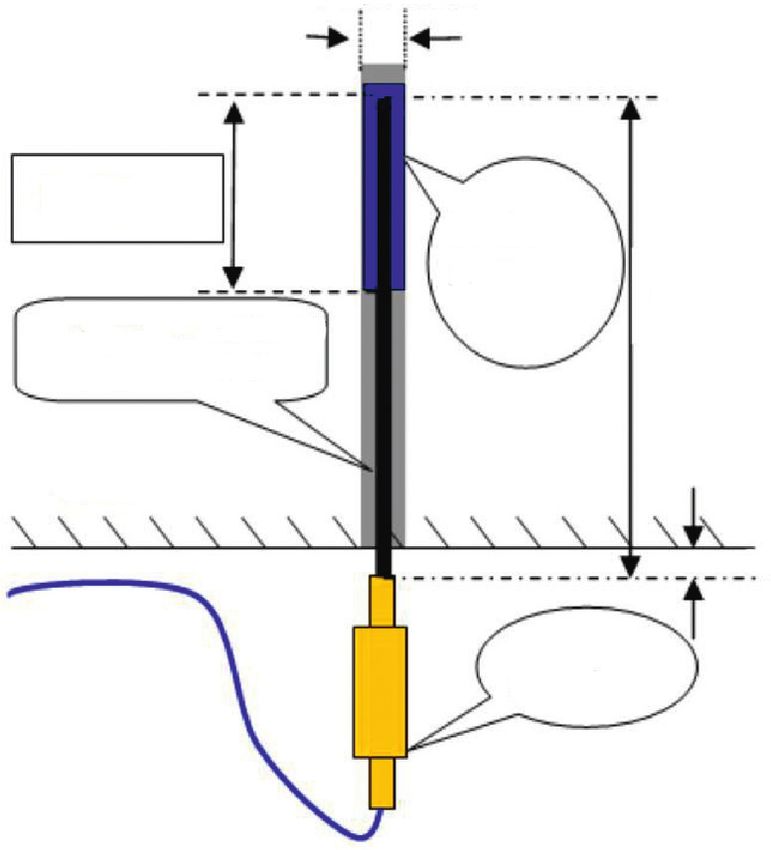
8 Geofluids

 -336.0 -336.0

 -366.0 -366.0

 -396.0 -396.0

 -426.0 -426.0

 -456.0 -456.0

 -486.0 -486.0

 -516.0 -516.0

 -546.0 -546.0

 -576.0 -576.0

 -606.0 -606.0

 -636.0 -636.0

 Figure 9: Plan and profile of the 16001 working face microseismic event distribution in the stage after the square stage.

 Table 3: The energy percent of three stages.
 The percent of energy event in stage before The percent of energy event in The percent of energy event in stage after
Energy (J)
 the square stage (%) square stage (%) the square stage (%)
0–100 29.8 5.1 15.0
101–300 49.1 35.9 42.5
301–500 8.8 29.5 26.5
501–1000 8.8 21.8 13.0
>1000 3.5 77 3.0

 None
 shear-n shear-p
 shear-n shear-p tension-p
 shear-n tension-n shear-p tension-p
 shear-p
 shear-p tension-p
 tension-n shear-p tension-p
 tension-n tension-p
 tension-p

 (a)

 None
 shear-n shear-p
 shear-n shear-p tension-p
 shear-n tension-n shear-p tension-p
 shear-p
 shear-p tension-p
 tension-n shear-p tension-p
 tension-n tension-p
 tension-p

 (b)

 Figure 10: Plastic distribution diagram: (a) the stage before the square stage; (b) the square stage.

4.6. Verification 100M
 Hli � ± 11.49, (5)
 0.26M + 6.88
4.6.1. Verification with Formula Method. The height of the
water-conducting fracture zone can be calculated where M is the mining height. The average mining height of
with the following formula (State Bureau of Coal In- the 16011 working face was 5.8 m, and the height of the
dustry 2013), and the accuracy has been verified in the water-conducting fracture zone of the 16001 working face
Zhaoguer Coal Mine in the same coalfield via field was 69.15 ± 11.49 m, which is consistent with the results of
measurements. 60 m to 75 m interpreted with the microseismic method.
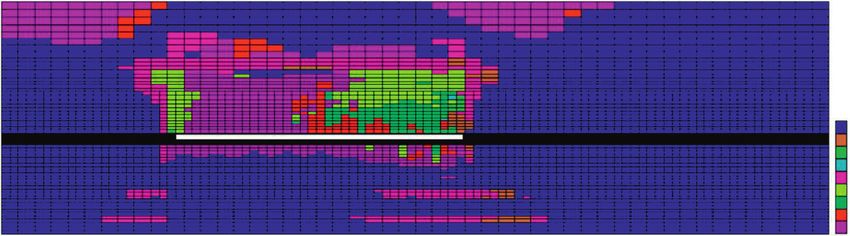
Geofluids 9

4.6.2. Verification with Numerical Simulation Method. square stage, the square stage, the stage after the
FLAC3D software is used to conduct numerical simulation square stage, and the final stage. The monitoring
calculation of surrounding rock failure rules under the results show that the initial weighting distance of the
condition of full mining height in the stage before the square 16001 working face was approximately 35 m, which
stage (advanced 180 m) and the square stage (advanced is consistent with the pressure data monitored by the
220 m) (Figure 10). In the model, the roof height is 80 m working face supports.
above the coal seam. (4) The square stage was the most active stage in the
 It can be seen from Figure 10 that the rock mass failure mining process, and the height of the water-con-
field in the square stage of the working face is significantly ducting fracture zone in this stage was approximately
larger than that in the stage before the square stage, and the 75 m above the coal seam, which is similar to or
failure range of the plastic zone of the roof reaches the exceeds the thickness of the bedrock in the roof. The
maximum. Shear failure mainly occurs in the rock mass near heights of the water-conducting fracture zone in
and in front of the coal wall, indicating that the surrounding other stages were between 60 m and 70 m, which are
rock is subjected to great shear stress after mining. basically consistent with the results calculated by the
According to the above analysis, the plastic failure zone can formula. The results indicated that the microseismic
be approximately regarded as the water-conducting fracture monitoring technology applied in the thin bedrock
zone. The figure shows that the maximum height of the working face with a thick loose layer was successful
plastic failure zone of the roof of 16001 working face is 66 m, in monitoring the process of roof failure.
which is consistent with the height of the water-conducting
fracture zone of the working face of 60 m–75 m monitored
by the microseismic monitoring results. Data Availability
 The data used to support the findings of this study are
 available from the corresponding author upon request.
5. Summary and Conclusion
 (1) The load of a thin bedrock working face with a thick
 Conflicts of Interest
 loose layer is composed of the load of the false roof,
 the immediate roof, the upper hard roof, the bed- The authors declare no conflicts of interest.
 rock, and the loose layers. The formula of the load
 transfer coefficient of loose layers is deduced, and
 based on this formula, the transfer coefficients of the Acknowledgments
 loose layers of four working faces in different areas The authors are grateful to the Zhaoguyi Coal Mine for their
 are calculated, which are 0.017 to 0.087. The re- partial funding of the in situ experiments and for providing
 gression formula between the thickness of the field testing sites and related data. The National Key Basic
 bedrock and the load transfer coefficient of the loose Research Development Program of China (the Fundamental
 layer shows that the transfer coefficient approaches Research Funds for the Central Universities, 2021YQNY09)
 zero when the bedrock is thicker than 50 m. is also gratefully acknowledged.
 (2) The load transfer coefficient of the loose layer is
 directly related to the thickness of bedrock in the
 References
 working face; the thinner the bedrock, the greater the
 influence of the loose layer on the working face [1] J. Wang, S. Yang, Y. Li, and Z. Wang, “A dynamic method to
 supports. The load transfer coefficient of the loose determine the supports capacity in long wall coal mining,”
 layer has a certain relationship with the thickness of International Journal of Mining, Reclamation and Environ-
 the loose layer; the thicker the loose layer, the smaller ment, vol. 29, no. 4, pp. 277–288, 2015.
 the ratio between the bedrock and the loose layer, [2] J. Wang and Z. Wang, “Stability of main roof structure during
 and the greater the load transferred to the working the first weighting in shallow high-intensity mining face with
 thin bedrock,” Journal of Mining and Safety Engineering,
 face. Microseismic monitoring technology captures
 vol. 31, no. 6, pp. 838–844, 2014.
 the small vibration signals generated by rock rupture [3] Y. Xu, S. Liu, Y. Gao, and Q. Zhang, “Study on the internal
 during the formation of water-inrush channels micro deformation law of thick loose layer,” Coal Science and
 through multiple sets of high-sensitivity geophones. Technology, vol. 42, no. 10, pp. 10–13, 2014.
 (3) To monitor the process of roof fracture formation [4] X. Fang, H. Huang, T. Jin, and J. Bo, “Strata behavior of fully-
 and determine the rules of roof weighting in a thin mechanized top coal caving in thin bedrock and thick top-
 bedrock working face with a thick loose layer, a soil,” Journal of Mining & Safety Engineering, vol. 24, no. 3,
 microseismic monitoring system was applied at the pp. 326–330, 2007.
 [5] L. Hartley and S. Joyce, “Approaches and algorithms for
 16001 working face of the Zhaoguyi Coal Mine.
 groundwater flow modeling in support of site investigations
 Based on the microseismic monitoring results and and safety assessment of the Forsmark site, Sweden,” Journal
 mine pressure observation results, the working face of Hydrology, vol. 129, 2013.
 mining process can be divided into different mining [6] Y. Xu, E. Zhang, Y. Luo, L. Zhao, and K. Yi, “Mechanism of
 stages: the initial mining stage, the stage before the water inrush and controlling techniques for fault-traversing
10 Geofluids

 roadways with floor heave above highly confined aquifers,”
 Mine Water and the Environment, vol. 39, pp. 320–330, 2020.
 [7] X. Fang, H. Huang, T. Jin, and J. Bo, “Movement rules of
 overlying strata around long wall mining in thin bedrock with
 thick surface soil,” Chinese Journal of Rock Mechanics and
 Engineering, vol. 27, no. Sup 1, pp. 2700–2706, 2008.
 [8] L. Ma, D. Zhang, and G. Sun, “Thick alluvium full-mecha-
 nized caving mining with large mining height face roof
 control mechanism and practice,” Journal of China Coal
 Society, vol. 38, no. 2, pp. 199–203, 2013.
 [9] J. Zuo, Y. Sun, and M. Qian, “Research on movement
 mechanism and analogous hyperbola model of overlying
 strata with thick alluvium,” Journal of China Coal Society,
 vol. 42, no. 6, pp. 1372–1379, 2017.
[10] D. Xue, J. Zhou, Y. Liu, and L. Gao, “On the excavation-
 induced stress drop in damaged coal considering a coupled
 yield and failure criterion,” International Journal of Coal
 Science and Technology, vol. 7, no. 5, pp. 58–67, 2020.
[11] L. Qin, C. Ma, S. Li et al., “Mechanical damage mechanism of
 frozen coal subjected to liquid nitrogen freezing,” Fuel,
 vol. 309, Article ID 122124, 2022.
[12] Q. Huang, P. Zhang, and A. Dong, “Mathematical model of
 “arch beam” of thick sandy soil layer movement in shallow
 seam,” Rock and Soil Mechanics, vol. 30, no. 9, pp. 2722–2726,
 2009.
[13] Q. Huang, “Studies on load-transmitting factor of thick sandy
 soil layer on key roof stratum in shallow seam mining,”
 Chinese Journal of Geotechnical Engineering, vol. 27, no. 6,
 pp. 672–676, 2005.
[14] J. Li, Y. Xu, P. Jiang, and Y. Mou, “Study on load transmission
 characteristics of overburden rock above coal mining face in
 thin bedrock of super thick unconsolidated stratum,” Coal
 Science and Technology, vol. 45, no. 11, pp. 95–100, 2017.
[15] M. Vanini, M. Corigliano, E. Faccioli et al., “Improving
 seismic hazard approaches for critical infrastructures: a pilot
 study in the Po Plain,” Bulletin of Earthquake Engineering,
 vol. 16, no. 6, pp. 2529–2564, 2018.
[16] D. Zhou, K. Wu, G. Cheng, and L. Liang, “Mechanism of
 mining subsidence in coal mining area with thick alluvium
 soil in China,” Arabian Journal of Geosciences, vol. 8, no. 4,
 pp. 1855–1867, 2015.
[17] Y. Liu, Y. Pritam, X. Hu, R. Peng, and T. Bülent, “Effects of
 electrical anisotropy on long-offset transient electromagnetic
 data,” Geophysical Journal International, vol. 222, no. 2,
 pp. 1074–1089, 2020.
[18] G. Cheng, C. Tang, L. Li, X. Chuai, T. Yang, and L. Wei,
 “Micro-fracture precursors of water flow channels induced by
 coal mining: a case study,” Mine Water and the Environment,
 vol. 40, 2021.
[19] X. Li, S. Chen, E. Wang, and Z. Li, “Rock burst mechanism in
 coal rock with structural surface and the microseismic (MS)
 and electromagnetic radiation (EMR) response,” Engineering
 Failure Analysis, vol. 124, 2021.
[20] C. Zhang, G. Jin, C. Liu et al., “Prediction of rockbursts in a
 typical island working face of a coal mine through micro-
 seismic monitoring technology,” Tunnelling and Underground
 Space Technology, vol. 113, 2021.
You can also read