WETLAND DELINEATION - Knoxville, IA
←
→
Page content transcription
If your browser does not render page correctly, please read the page content below
WETLAND DELINEATION
                                      Edwards Park Pond

                                Knoxville, Iowa | June 22, 2021

                                         Prepared for:

                                       City of Knoxville
                                       305 Third Street
                                     Knoxville, Iowa 50138
                      Snyder & Associates, Inc. Project No. 121.0520.01

                                            6/22/2021
Don LaPietra
Environmental Scientist

Reviewed by:

                                            6/22/2021
Jeff Walters, PWS
Principal Environmental Scientist
TABLE OF CONTENTS
1. Introduction ................................................................................................................................. 1
2. Methodology ............................................................................................................................... 1
3. Site Review ................................................................................................................................. 2
4. Environmental Setting ................................................................................................................ 3
5. Field Observations ...................................................................................................................... 4
6. Summary ..................................................................................................................................... 7

LIST OF TABLES
1. Soil Map Units and Descriptions .................................................................................................2
2: Climatological Data for KNOXVILLE, IA – May-June 2021 ....................................................4

APPENDICES
Exhibits ........................................................................................................................ Appendix A
         Vicinity Map ........................................................................................................ Exhibit 1
         USGS Topographic Map...................................................................................... Exhibit 2
         National Wetlands Inventory ............................................................................... Exhibit 3
         USDA Soil Survey ............................................................................................... Exhibit 4
         Wetland Delineation ............................................................................................ Exhibit 5
Data Forms ..................................................................................................................... Appendix B

                                                                                                                     SNYDER-ASSOCIATES.COM

V:\Projects\2021\121.0520.01\StudiesReports\Report_2021-06-22_WD.docx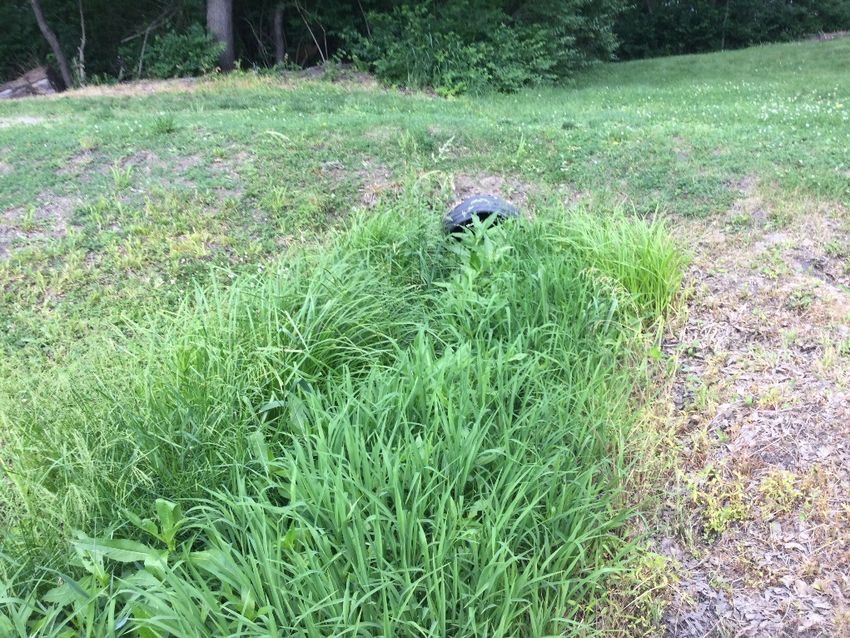
Edwards Park Pond | 1

1. Introduction
Snyder & Associates, Inc. delineated the project area for the proposed Edwards Park Pond in Knoxville, Iowa
for the presence of wetlands on June 9, 2021 in accordance with the proposal and general conditions. The
project boundary is centrally located in of Section 1, Township 75 North, Range 20 West in Marion County,
Iowa.

The scope of this investigation was to indicate the presence/absence of wetlands, identify wetlands that could
be impacted by the project, and delineate the upper boundaries of potential jurisdictional wetlands within the
project area. In addition to wetlands, Waters of the United States (WUS), which include lakes, ponds, rivers,
and streams, were included in the delineation. This report is used by the United States Army Corps of
Engineers (USACE) and the Iowa Department of Natural Resources (IDNR). The USACE has discretion to
use this report for the purposes of making jurisdictional determinations and enforcing Section 404 of the Clean
Water Act. The IDNR uses the report for the purpose of enforcing Section 401 of the Clean Water Act.

The information and recommendations presented in this report are professional opinions based on visual
observation, review of available data pertaining to the subject property, and interpretation of available public
records. The opinions and recommendations presented herein apply to the subject property conditions at the
time of Snyder & Associates, Inc. investigation.

2. Methodology
Prior to performing the wetland delineation, several map and aerial photograph resources were reviewed to
assist with identifying WUS within the project area.

USGS Topographic Maps
United States Geological Survey (USGS) topographic maps were used to identify drainage areas, streams,
forests, and topography that may indicate the presence of WUS. One unnamed intermittent stream and one
pond were identified within the project area.

National Wetlands Inventory
The National Wetlands Inventory (NWI), published by the United States Department of the Interior’s Fish
and Wildlife Services (USFWS), were reviewed for probable wetland areas. The following NWI-indicated
wetland areas were identified on the project site:

     •    R5UBH: Riverine, unknown perennial, unconsolidated bottom, permanently flooded.
     •    R4SBC: Riverine, intermittent, streambed, seasonally flooded.
     •    PUBGh: Palustrine, unconsolidated bottom, intermittently exposed, diked or impounded.

USDA Soil Survey
The Marion County Soil Survey provided by the United States Department of Agriculture (USDA) was used
to identify the hydric soils in the project area. As shown in Exhibit 4, USDA Soil Survey, no soils with hydric
components are indicated in the project area. The soil descriptions identified in the project area are identified
in Table 1.

                                                                                     SNYDER-ASSOCIATES.COM

V:\Projects\2021\121.0520.01\StudiesReports\Report_2021-06-22_WD.docx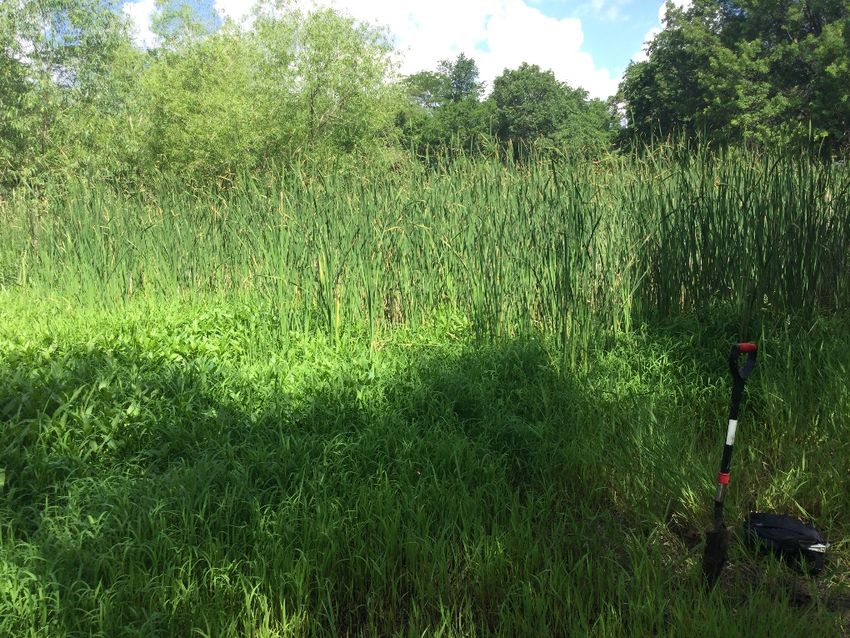
Edwards Park Pond | 2

Table 1. Soil Map Units and Descriptions
    Soil Map Unit                                          Description                                    Hydric
    76D2                  Ladoga silt loam, 9 to 14 percent slopes, eroded                                   No
    1313F2                Munterville silt loam, 18 to 25 percent slopes, moderately eroded                  No
    W                     Water                                                                              No

3. Site Review
During a pedestrian field survey potential wetlands were examined for wetland indicators using the Routine
On-Site Determination Method as defined in the 1987 Corps of Engineers Wetlands Delineation Manual and
the Regional Supplement to the Corps of Engineers Wetland Delineation Manual: Midwest Region (Version
2.0) (2010 Midwest Supplement). Wetlands are defined by the USACE and the Environmental Protection
Agency (EPA) as:

“Those areas that are inundated or saturated by surface or groundwater at a frequency and duration sufficient
to support, and that under normal circumstances do support, a prevalence of vegetation typically adapted for
life in saturated soil conditions. Wetlands generally include swamps, marshes, bogs, and similar areas. 1”

Under normal conditions, if one (1) or more of the wetland criteria are not identified, the area was not
considered a wetland. If all three (3) wetland indicators were identified, the area was classified a wetland.
Additional observations were made throughout the wetland areas to define the wetland/non-wetland boundary,
which was mapped with GPS technology. Vegetation, soil, and hydrology assessment data from at least one
(1) location within each wetland and the characteristics of one (1) upland location outside of the wetlands
were recorded on a USDA Wetland Determination Form. The recorded data forms for the project area are
enclosed in Appendix B and the data point locations are shown on Exhibit 5, Wetland Delineation.

Plant Community Assessment
The project area was visually observed to assess the plant species and absolute percentage of ground cover
for four stratums of plant community types including tree, scrub/shrub, herbaceous and woody vine stratums.
The vegetation for each selected area was identified using Midwestern Wetland Flora, A Field Office Guide
to Plant Species (Mohlenbrock and Mohlenbrock), and Wildflowers and other Plants of Iowa Wetlands
(Runkel and Roosa, 1999).

Each dominant species of vegetation observed was evaluated for their wetland indicator status. Indicator status
was assessed using the USDA North American Digital Flora, National Wetland Plant List and the national
List of Plant Species that Occur in Wetlands – Region 3 (Reed 1988). Indicator categories for vegetation are
presented below:

       •   Obligate Wetland (OBL) – occurs almost always (estimated probability greater than 99%) under
           natural conditions in wetlands.
       •   Facultative Wetland (FACW) – usually occur in wetland (estimated probability 67% – 99%) but
           occasionally found in not-wetlands.
       •   Facultative (FAC) – equally likely to occur in wetlands or non-wetlands (estimated probability 34% -
           66%).
1   Environmental Laboratory. 1987 Corps of Engineers Wetlands Delineation Manual. Vicksburg, MS: U.S. Army Corps of Engineers, 1987.

                                                                                                       SNYDER-ASSOCIATES.COM

V:\Projects\2021\121.0520.01\StudiesReports\Report_2021-06-22_WD.docx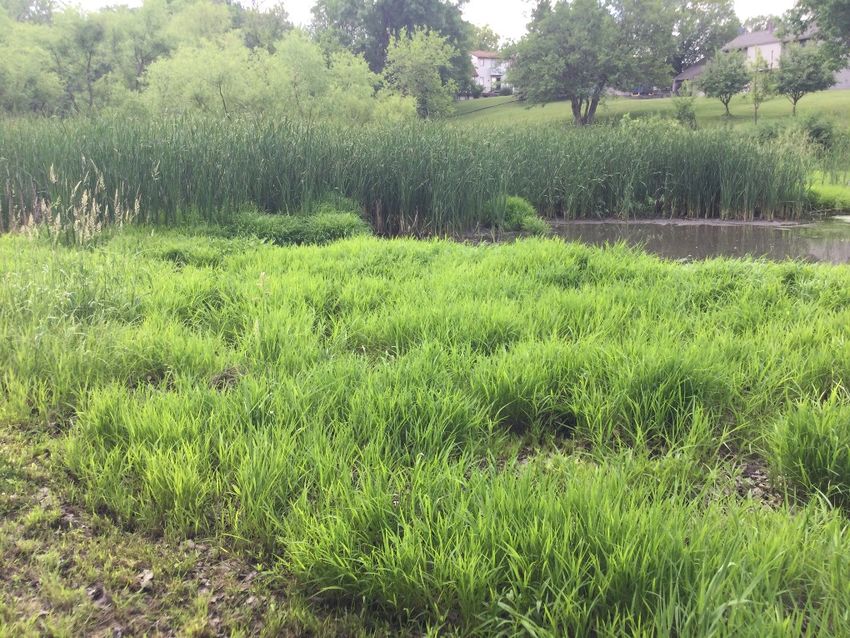
Edwards Park Pond | 3

     •    Facultative Upland (FACU) – usually occur in non-wetlands (estimated probability 67% - 99%) but
          occasionally found in wetlands.
     •    Obligate Upland (UPL) – rarely occurs in wetlands, but occur almost always (estimated probability
          greater than 99%) under natural conditions in non-wetlands.

Hydric Soil Assessment
Subsurface soil samples to a depth of approximately 24 inches were collected and evaluated using Munsell
Soil Color Charts (Munsell 1994). The soil samples were also evaluated for hydric soil indicators listed on
the USACE Midwest Region Wetland Determination Data Form including hydrogen sulfide, depletion below
dark surface, thick dark surface, depleted matrix, redox depressions, loamy gleyed matrix and stripped matrix.
Soil was considered to be hydric if hydric soil indicators were observed in the subsurface soil sample.

Wetland Hydrology Assessment
Potential wetlands were visually evaluated for wetland hydrology indicators. If one (1) primary or two (2)
secondary indicators were observed, the location was considered to have wetland hydrology. Primary wetland
indicators include surface water, high water table, saturation, water marks, drift deposits, iron deposits,
presents of reduced iron, and oxidized rhizospheres on living roots. Secondary wetland indicators include
surface soil cracks, drainage patterns, stunted or stressed plants and crayfish burrows.

4. Environmental Setting

Weather during the wetland delineation on June 9, 2021 was partly cloudy at approximately 84º F with winds
blowing from the N at about 5 mph 2.

According to the National Climatic Data Center, 3 data for KNOXVILLE, IA, the average precipitation for
May was 4.75 inches. Current climate data was obtained from the Natural Resources Conservation Service
(NRCS) Field Office Technical Guide website 4 for KNOXVILLE, IA. Total precipitation recorded to date for
month prior to the delineation was 4.18 inches.

2
  http://www.wunderground.com/history/
3
  http://cdo.ncdc.noaa.gov/cgi-bin/climatenormals/climatenormals.pl?directive=prod_select2&prodtype=CLIM20&subrnum=
4
  http://efotg.sc.egov.usda.gov/efotg_locator.aspx

                                                                                                   SNYDER-ASSOCIATES.COM

V:\Projects\2021\121.0520.01\StudiesReports\Report_2021-06-22_WD.docx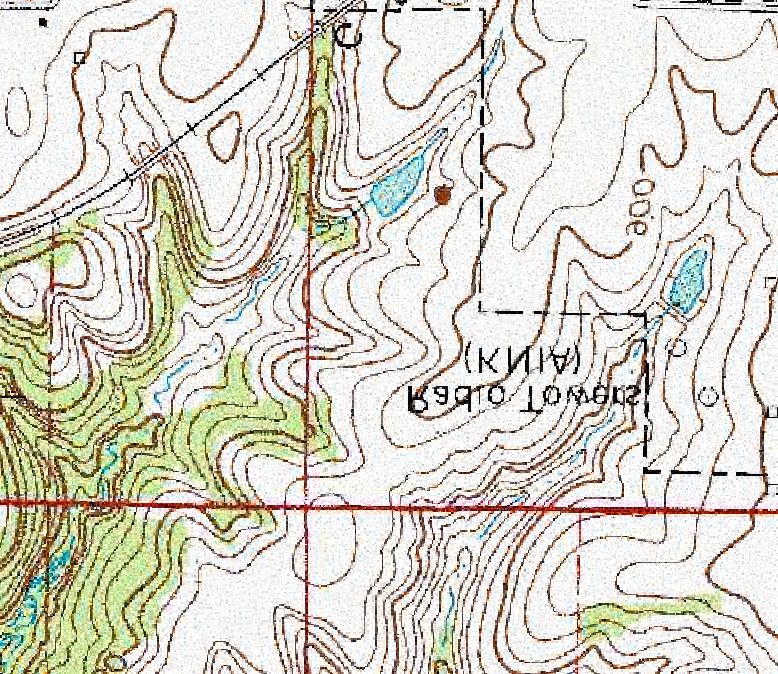
Edwards Park Pond | 4

          Table 2: Climatological Data for KNOXVILLE, IA – MAY-JUNE 2021
                            Max                  Min                Avg
         Date                                                                   Precipitation
                         Temperature          Temperature        Temperature
 2021-05-09             55                  39                 47              1.48
 2021-05-10             62                  39                 50.5            T
 2021-05-11             63                  38                 50.5            0
 2021-05-12             62                  35                 48.5            0
 2021-05-13             64                  38                 51              0
 2021-05-14             67                  37                 52              0
 2021-05-15             67                  54                 60.5            0.22
 2021-05-16             66                  49                 57.5            0.04
 2021-05-17             62                  52                 57              0.94
 2021-05-18             64                  57                 60.5            0.08
 2021-05-19             67                  60                 63.5            0.16
 2021-05-20             76                  60                 68              0.32
 2021-05-21             73                  66                 69.5            0.41
 2021-05-22             77                  63                 70              0.04
 2021-05-23             77                  63                 70              0.03
 2021-05-24             81                  66                 73.5            0.08
 2021-05-25             79                  66                 72.5            T
 2021-05-26             77                  57                 67              0.03
 2021-05-27             80                  58                 69              0.18
 2021-05-28             78                  41                 59.5            0.16
 2021-05-29             47                  40                 43.5            0.01
 2021-05-30             63                  43                 53              0
 2021-05-31             65                  52                 58.5            0
 2021-06-01             70                  51                 60.5            0
 2021-06-02             76                  53                 64.5            0
 2021-06-03             79                  58                 68.5            0
 2021-06-04             86                  62                 74              0
 2021-06-05             86                  67                 76.5            0
 2021-06-06             90                  64                 77              0
 2021-06-07             83                  67                 75              0
 2021-06-08             87                  65                 76              0
 Average|Sum            71.9                53.5               62.7            4.18
Product generated by ACIS - NOAA Regional Climate Centers.

5. Field Observations
Field investigations were performed on June 9, 2021 by Snyder & Associates, Inc. to identify potential WUS,
including wetlands within the project boundary. One emergent wetland, one deepwater habitat, one
intermittent stream, and one drainageway were identified within the project boundary during the wetland
delineation. WUS identified during the wetland delineation are shown on Exhibit 5, Wetland Delineation.
Wetland Determination Data Forms for each wetland area can be found in Appendix B. Photographic
documentation provide a record of the physical characteristics of the field sites observed during the field
survey.

                                                                                                SNYDER-ASSOCIATES.COM

V:\Projects\2021\121.0520.01\StudiesReports\Report_2021-06-22_WD.docx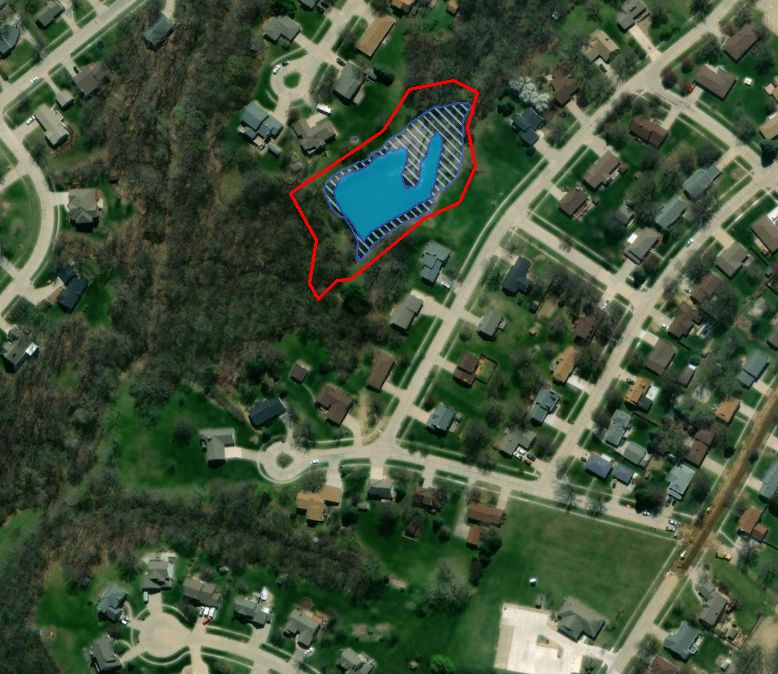
Edwards Park Pond | 5

Wetland 1 is an emergent fringe wetland approximately 0.45 acres in size. Wetland 1 encircles a ponded
deepwater habitat. The emergent wetland appears to be the result of siltation from stormwater siltation coming
from adjacent roads. The wetland was observed to contain hydric vegetation such as and cattail (Typha
latifolia) and rice cutgrass (Leersia oryzoides). Multiple willows were observed on the southern edge of
wetland.

Photo 1: North view of Emergent Wetland 1 showing cattails and rice cutgrass near data point W1.

Photo 2: South view of Emergent Wetland 1 showing vegetation cover extending into deepwater habitat.

                                                                                  SNYDER-ASSOCIATES.COM

V:\Projects\2021\121.0520.01\StudiesReports\Report_2021-06-22_WD.docx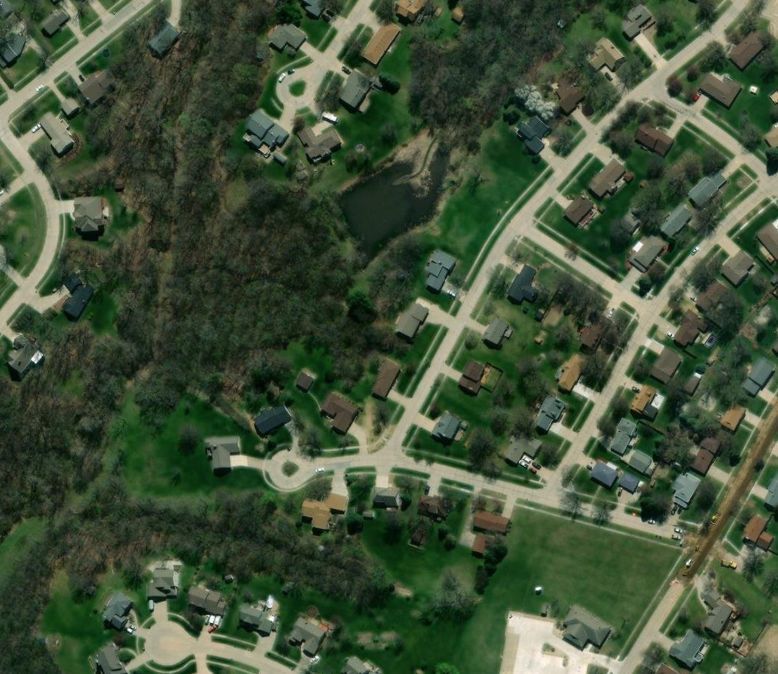
Edwards Park Pond | 6

Deepwater Habitat 1 is a ponded area that receives water from an intermittent stream and stormwater. The
pond drains through a small drainage pipe to the north. After reviewing aerial imagery from prior years, it
was observed that the boundary has receded due to siltation.

Photo 3: West view showing boundary between Deepwater Habitat 1 and Emergent Wetland 1.
Stream 1 is an intermittent stream that flows north into Wetland 1 for approx. 221 linear feet. The stream was
observed to contain banks approx. 2 feet tall with a defined stream bed. Minimal water flow was observed.

Photo 4: North view of Steam 1 showing streambanks.

                                                                                  SNYDER-ASSOCIATES.COM

V:\Projects\2021\121.0520.01\StudiesReports\Report_2021-06-22_WD.docx
Edwards Park Pond | 7

Drainageway 1 flows north through this drainage pipe for approx. 80 linear feet. Water exits on the north
side of a berm containing steep slopes.

Photo 5: North view of drainage pipe where water drains through berm.

6. Summary
Snyder & Associates, Inc. has performed a Wetland Delineation in conformance with the 1987 Corps of
Engineers Wetlands Delineation Manual and the Midwest Regional Supplement of the proposed Edwards
Park Pond project located in Knoxville, Iowa. Based on the findings of the wetland delineation, one
emergent wetland, one deepwater habitat, one intermittent stream, and one drainageway were found.

According to Regulation 33CFR §328.3, WUS include traditional navigable waters, interstate
waters, tributaries of navigable and interstate waters, interstate lakes, rivers, streams (including intermittent
streams), mudflats, sandflats, wetlands, sloughs, prairie potholes, wet meadows, playa lakes, or natural
ponds, and certain isolated wetlands. WUS are under the jurisdiction of the USACE.

Discharges of dredged or fill material, excavation, and mechanized land clearing in the WUS will require
authorization from the USACE. Final determination of the limit of WUS, including wetlands, for
permitting purposes rests with the USACE. For final authorization for activities in WUS, the USACE must
approve these findings.

                                                                                     SNYDER-ASSOCIATES.COM

V:\Projects\2021\121.0520.01\StudiesReports\Report_2021-06-22_WD.docx
APPENDIX A
                                                               EXHIBITS

                                                                          SNYDER-ASSOCIATES.COM

V:\Projects\2021\121.0520.01\StudiesReports\Report_2021-06-22_WD.docx
FILE PATH: V:\Projects\2021\121.0520.01\GIS\Exh_20210524_WD_Ex1.mxd
SOURCES: Sources: Esri, HERE, DeLorme, USGS, Intermap, increment P Corp., NRCAN, Esri Japan, METI, Esri China (Hong Kong), Esri (Thailand), MapmyIndia, © OpenStreetMap contributors, and the GIS User Community
Legend
Project Area
0 1,000 2,000 Exhibit 1 - Vicinity Map
Feet Edwards Park Pond | Knoxville, IA | 5/24/2021FILE PATH: V:\Projects\2021\121.0520.01\GIS\Exh_20210524_WD_Ex2.mxd
SOURCES: IA DNR
Legend
Project Area
0 250 500 Exhibit 2 - USGS Topographic Map
Feet Edwards Park Pond | Knoxville, IA | 5/24/2021FILE PATH: V:\Projects\2021\121.0520.01\GIS\Exh_20210524_WD_Ex3.mxd
SOURCES: Source: Esri, DigitalGlobe, GeoEye, Earthstar Geographics, CNES/Airbus DS, USDA, USGS, AeroGRID, IGN, and the GIS User Community;https://www.fws.gov/wetlands/data/mapper.html
R4SBC
PUBGh
R5UBH
R4SBC
Legend
Project Area
0 100 200 Exhibit 3 - National Wetlands Inventory
Feet Edwards Park Pond | Knoxville, IA | 5/24/2021FILE PATH: V:\Projects\2021\121.0520.01\GIS\Exh_20210524_WD_Ex4.mxd
SOURCES: Source: Esri, DigitalGlobe, GeoEye, Earthstar Geographics, CNES/Airbus DS, USDA, USGS, AeroGRID, IGN, and the GIS User Community;https://websoilsurvey.sc.egov.usda.gov/App/WebSoilSurvey.aspx
76D2
1313F2
W
76D2
Legend
Soil Map Unit
Project Area
0 100 200 Exhibit 4 - USDA Soil Survey
Feet Edwards Park Pond | Knoxville, IA | 5/24/2021FILE PATH: V:\Projects\2021\121.0520.01\GIS\Exh_20210524_WD_Ex5.mxd
SOURCES: Source: Esri, DigitalGlobe, GeoEye, Earthstar Geographics, CNES/Airbus DS, USDA, USGS, AeroGRID, IGN, and the GIS User Community;https://websoilsurvey.sc.egov.usda.gov/App/WebSoilSurvey.aspx
U1
W1
Legend
DataPoints
Intermittent Stream
Drainageway
Deepwater Habitat
Emergent Wetland
Project Area
0 100 200 Exhibit 5 - Wetland Delineation
Feet Edwards Park Pond | Knoxville, IA | 6/14/2021APPENDIX B
DATA FORMS
SNYDER-ASSOCIATES.COM
V:\Projects\2021\121.0520.01\StudiesReports\Report_2021-06-22_WD.docxWETLAND DETERMINATION DATA FORM – Midwest Region
Project/Site: Edwards Park Pond City/County: Marion Sampling Date: 6-9-2021
Applicant/Owner: City of Knoxville State: IA Sampling Point: DLW1
Investigator(s): Don LaPietra Section, Township, Range: Section 1, T75N, R20W
Landform (hillside, terrace, etc.): depressional area Local relief (concave, convex, none): concave
Slope (%): Lat: 41.330375 Long: -93.117436 Datum: NAD83
Soil Map Unit Name Water NWI classification: PUBGh
Are climatic / hydrologic conditions on the site typical for this time of year? Yes X No (If no, explain in Remarks.)
Are Vegetation , Soil , or Hydrology significantly disturbed? Are “Normal Circumstances” present? Yes X No
Are Vegetation , Soil , or Hydrology naturally problematic? (If needed, explain any answers in Remarks.)
SUMMARY OF FINDINGS – Attach site map showing sampling point locations, transects, important features, etc.
Hydrophytic Vegetation Present? Yes X No Is the Sampled Area
Hydric Soil Present? Yes X No within a Wetland? Yes X No
Wetland Hydrology Present? Yes X No
Remarks:
VEGETATION – Use scientific names of plants.
Absolute Dominant Indicator
Tree Stratum (Plot size: ) % Cover Species? Status Dominance Test worksheet:
1. Salix nigra 16 Yes OBL Number of Dominant Species
2. That Are OBL, FACW, or FAC: 4 (A)
3. Total Number of Dominant
4. Species Across All Strata: 4 (B)
5. Percent of Dominant Species
16 =Total Cover That Are OBL, FACW, or FAC: 100.0% (A/B)
Sapling/Shrub Stratum (Plot size: )
1. Prevalence Index worksheet:
2. Total % Cover of: Multiply by:
3. OBL species 90 x1= 90
4. FACW species 24 x2= 48
5. FAC species 0 x3= 0
=Total Cover FACU species 0 x4= 0
Herb Stratum (Plot size: ) UPL species 0 x5= 0
1. Typha latifolia 43 Yes OBL Column Totals: 114 (A) 138 (B)
2. Carex bromoides 24 Yes FACW Prevalence Index = B/A = 1.21
3. Leersia oryzoides 22 Yes OBL
4. Sagittaria latifolia 7 No OBL Hydrophytic Vegetation Indicators:
5. Eupatorium perfoliatum 2 No OBL 1 - Rapid Test for Hydrophytic Vegetation
6. X 2 - Dominance Test is >50%
7. X 3 - Prevalence Index is ≤3.01
8. 4 - Morphological Adaptations1 (Provide supporting
9. data in Remarks or on a separate sheet)
10. Problematic Hydrophytic Vegetation1 (Explain)
98 =Total Cover 1
Indicators of hydric soil and wetland hydrology must
Woody Vine Stratum (Plot size: ) be present, unless disturbed or problematic.
1.
Hydrophytic
2. Vegetation
=Total Cover Present? Yes X No
Remarks: (Include photo numbers here or on a separate sheet.)
US Army Corps of Engineers Midwest Region – Version 2.0SOIL Sampling Point: DLW1
Profile Description: (Describe to the depth needed to document the indicator or confirm the absence of indicators.)
Depth Matrix Redox Features
(inches) Color (moist) % Color (moist) % Type1 Loc2 Texture Remarks
0-12 10YR 2/1 100 Loamy/Clayey
12-24 10YR 5/1 90 10YR 5/6 10 C PL/M Loamy/Clayey
1 2
Type: C=Concentration, D=Depletion, RM=Reduced Matrix, MS=Masked Sand Grains. Location: PL=Pore Lining, M=Matrix.
Hydric Soil Indicators: Indicators for Problematic Hydric Soils3:
Histosol (A1) Sandy Gleyed Matrix (S4) Coast Prairie Redox (A16)
Histic Epipedon (A2) Sandy Redox (S5) Iron-Manganese Masses (F12)
Black Histic (A3) Stripped Matrix (S6) Red Parent Material (F21)
Hydrogen Sulfide (A4) Dark Surface (S7) Very Shallow Dark Surface (TF12)
Stratified Layers (A5) Loamy Mucky Mineral (F1) Other (Explain in Remarks)
2 cm Muck (A10) Loamy Gleyed Matrix (F2)
X Depleted Below Dark Surface (A11) Depleted Matrix (F3)
3
X Thick Dark Surface (A12) Redox Dark Surface (F6) Indicators of hydrophytic vegetation and
Sandy Mucky Mineral (S1) Depleted Dark Surface (F7) wetland hydrology must be present,
5 cm Mucky Peat or Peat (S3) Redox Depressions (F8) unless disturbed or problematic.
Restrictive Layer (if observed):
Type:
Depth (inches): Hydric Soil Present? Yes X No
Remarks:
HYDROLOGY
Wetland Hydrology Indicators:
Primary Indicators (minimum of one is required; check all that apply) Secondary Indicators (minimum of two required)
Surface Water (A1) Water-Stained Leaves (B9) Surface Soil Cracks (B6)
X High Water Table (A2) Aquatic Fauna (B13) Drainage Patterns (B10)
X Saturation (A3) True Aquatic Plants (B14) Dry-Season Water Table (C2)
Water Marks (B1) Hydrogen Sulfide Odor (C1) Crayfish Burrows (C8)
Sediment Deposits (B2) Oxidized Rhizospheres on Living Roots (C3) Saturation Visible on Aerial Imagery (C9)
Drift Deposits (B3) Presence of Reduced Iron (C4) Stunted or Stressed Plants (D1)
Algal Mat or Crust (B4) Recent Iron Reduction in Tilled Soils (C6) X Geomorphic Position (D2)
Iron Deposits (B5) Thin Muck Surface (C7) X FAC-Neutral Test (D5)
X Inundation Visible on Aerial Imagery (B7) Gauge or Well Data (D9)
Sparsely Vegetated Concave Surface (B8 Other (Explain in Remarks)
Field Observations:
Surface Water Presen Yes No X Depth (inches):
Water Table Present? Yes X No Depth (inches): 5
Saturation Present? Yes X No Depth (inches): 0 Wetland Hydrology Present? Yes X No
(includes capillary fringe)
Describe Recorded Data (stream gauge, monitoring well, aerial photos, previous inspections), if available:
Remarks:
US Army Corps of Engineers Midwest Region – Version 2.0WETLAND DETERMINATION DATA FORM – Midwest Region
Project/Site: Edwards Park Pond City/County: Marion Sampling Date: 6-9-2021
Applicant/Owner: City of Knoxville State: IA Sampling Point: U1
Investigator(s): Don LaPietra Section, Township, Range: Section 1, T75N, R20W
Landform (hillside, terrace, etc.): hillside Local relief (concave, convex, none): None
Slope (%): 9-14% Lat: 41.330544 Long: -93.117296 Datum: NAD83
Soil Map Unit Name Ladoga silt loam NWI classification: none
Are climatic / hydrologic conditions on the site typical for this time of year? Yes X No (If no, explain in Remarks.)
Are Vegetation , Soil , or Hydrology significantly disturbed? Are “Normal Circumstances” present? Yes X No
Are Vegetation , Soil , or Hydrology naturally problematic? (If needed, explain any answers in Remarks.)
SUMMARY OF FINDINGS – Attach site map showing sampling point locations, transects, important features, etc.
Hydrophytic Vegetation Present? Yes No X Is the Sampled Area
Hydric Soil Present? Yes No X within a Wetland? Yes No X
Wetland Hydrology Present? Yes No X
Remarks:
VEGETATION – Use scientific names of plants.
Absolute Dominant Indicator
Tree Stratum (Plot size: ) % Cover Species? Status Dominance Test worksheet:
1. 16 Yes Number of Dominant Species
2. That Are OBL, FACW, or FAC: 1 (A)
3. Total Number of Dominant
4. Species Across All Strata: 3 (B)
5. Percent of Dominant Species
16 =Total Cover That Are OBL, FACW, or FAC: 33.3% (A/B)
Sapling/Shrub Stratum (Plot size: )
1. Prevalence Index worksheet:
2. Total % Cover of: Multiply by:
3. OBL species 0 x1= 0
4. FACW species 0 x2= 0
5. FAC species 30 x3= 90
=Total Cover FACU species 66 x4= 264
Herb Stratum (Plot size: ) UPL species 0 x5= 0
1. Digitaria sanguinalis 45 Yes FACU Column Totals: 96 (A) 354 (B)
2. Poa pratensis 30 Yes FAC Prevalence Index = B/A = 3.69
3. Trifolium repens 17 No FACU
4. Taraxacum officinale 4 No FACU Hydrophytic Vegetation Indicators:
5. 1 - Rapid Test for Hydrophytic Vegetation
6. 2 - Dominance Test is >50%
7. 3 - Prevalence Index is ≤3.01
8. 4 - Morphological Adaptations1 (Provide supporting
9. data in Remarks or on a separate sheet)
10. Problematic Hydrophytic Vegetation1 (Explain)
96 =Total Cover 1
Indicators of hydric soil and wetland hydrology must
Woody Vine Stratum (Plot size: ) be present, unless disturbed or problematic.
1.
Hydrophytic
2. Vegetation
=Total Cover Present? Yes No X
Remarks: (Include photo numbers here or on a separate sheet.)
US Army Corps of Engineers Midwest Region – Version 2.0SOIL Sampling Point: U1
Profile Description: (Describe to the depth needed to document the indicator or confirm the absence of indicators.)
Depth Matrix Redox Features
(inches) Color (moist) % Color (moist) % Type1 Loc2 Texture Remarks
0-11 10YR 3/1 100 Loamy/Clayey rocks/cobbles
1 2
Type: C=Concentration, D=Depletion, RM=Reduced Matrix, MS=Masked Sand Grains. Location: PL=Pore Lining, M=Matrix.
Hydric Soil Indicators: Indicators for Problematic Hydric Soils3:
Histosol (A1) Sandy Gleyed Matrix (S4) Coast Prairie Redox (A16)
Histic Epipedon (A2) Sandy Redox (S5) Iron-Manganese Masses (F12)
Black Histic (A3) Stripped Matrix (S6) Red Parent Material (F21)
Hydrogen Sulfide (A4) Dark Surface (S7) Very Shallow Dark Surface (TF12)
Stratified Layers (A5) Loamy Mucky Mineral (F1) Other (Explain in Remarks)
2 cm Muck (A10) Loamy Gleyed Matrix (F2)
Depleted Below Dark Surface (A11) Depleted Matrix (F3)
3
Thick Dark Surface (A12) Redox Dark Surface (F6) Indicators of hydrophytic vegetation and
Sandy Mucky Mineral (S1) Depleted Dark Surface (F7) wetland hydrology must be present,
5 cm Mucky Peat or Peat (S3) Redox Depressions (F8) unless disturbed or problematic.
Restrictive Layer (if observed):
Type: rocks/cobbles
Depth (inches): 11 Hydric Soil Present? Yes No X
Remarks:
HYDROLOGY
Wetland Hydrology Indicators:
Primary Indicators (minimum of one is required; check all that apply) Secondary Indicators (minimum of two required)
Surface Water (A1) Water-Stained Leaves (B9) Surface Soil Cracks (B6)
High Water Table (A2) Aquatic Fauna (B13) Drainage Patterns (B10)
Saturation (A3) True Aquatic Plants (B14) Dry-Season Water Table (C2)
Water Marks (B1) Hydrogen Sulfide Odor (C1) Crayfish Burrows (C8)
Sediment Deposits (B2) Oxidized Rhizospheres on Living Roots (C3) Saturation Visible on Aerial Imagery (C9)
Drift Deposits (B3) Presence of Reduced Iron (C4) Stunted or Stressed Plants (D1)
Algal Mat or Crust (B4) Recent Iron Reduction in Tilled Soils (C6) Geomorphic Position (D2)
Iron Deposits (B5) Thin Muck Surface (C7) FAC-Neutral Test (D5)
Inundation Visible on Aerial Imagery (B7) Gauge or Well Data (D9)
Sparsely Vegetated Concave Surface (B8 Other (Explain in Remarks)
Field Observations:
Surface Water Presen Yes No X Depth (inches):
Water Table Present? Yes No X Depth (inches):
Saturation Present? Yes No X Depth (inches): Wetland Hydrology Present? Yes No X
(includes capillary fringe)
Describe Recorded Data (stream gauge, monitoring well, aerial photos, previous inspections), if available:
Remarks:
US Army Corps of Engineers Midwest Region – Version 2.0You can also read