ROOTED IN REAL FOOD - Campbell Soup
←
→
Page content transcription
If your browser does not render page correctly, please read the page content below

2021 CORPORATE RESPONSIBILITY REPORT UPDATE

        ROOTED IN
        REAL FOOD
                                                       SHARED

         SOURCED

GROWN                             PRODUCED

                              A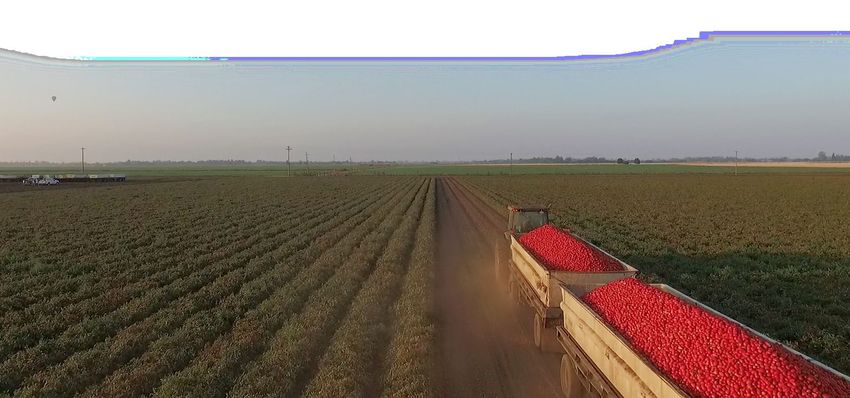
TABLE OF
CONTENTS
  CORPORATE
 RESPONSIBILITY   pg.   7              SHARED:
                                      EMPLOYEES                     pg.   45

    GROWN         pg.   22            SHARED:
                                     CONSUMERS                      pg.   52

   SOURCED        pg.   29            SHARED:
                                    COMMUNITIES                     pg.   58

   PRODUCED       pg.   38       Many of the photographs used throughout this report
                                 were taken before the COVID-19 pandemic began.

                             B
ROOTED IN
           REAL FOOD
   In 1869, a fruit merchant had a simple idea: to make the most
 delicious food with the best ingredients affordable to all. Rooted
in farm-grown ingredients, sourced responsibly and delivering the
 same delicious taste, every time. More than 150 years later, we’re
     still staying true to those ideals while striving to fulfill our
  purpose, Real food that matters for life’s moments. This report
    demonstrates the progress we made in fiscal year (FY) 2020
   across our Corporate Responsibility priorities, focusing on the
   family of brands that now make up Campbell Soup Company.

                                  11
CAMPBELL AT A GLANCE
     OUR PURPOSE: Real food that matters for life’s moments.
                                         REAL FOOD PHILOSOPHY

                                THE NEW CAMPBELL SOUP COMPANY

                                     ONE GEOGRAPHY: NORTH AMERICA
» World Headquarters                      » Administrative Offices
   Camden, New Jersey                      •C harlotte, North Carolina           • Toronto, Canada
                                           • Norwalk, Connecticut

» Manufacturing Facilities                • Indiana: Jeffersonville (S)          •P ennsylvania: Denver (S),
• Arizona: Goodyear (S)                    • Massachusetts: Hyannis (S)             Downingtown (S), Hanover (S)
•C alifornia: Dixon (MB), Stockton (MB)   •N orth Carolina: Charlotte (S),      • Texas: Paris (MB)
• Connecticut: Bloomfield (S)                Maxton (MB)                          • Utah: Richmond (S)
• Florida: Lakeland (S)                    •O hio: Ashland (S), Napoleon (MB),   •W isconsin: Beloit (S), Franklin (S),
• Georgia: Columbus (S)                      Willard (S)                            Milwaukee (MB)
• Illinois: Downers Grove (S)              •O regon: Salem (S), Tualatin (MB)
MB- Meals and Beverages, S- Snacks

                                                            2
VALUES
LEAD US FORWARD

                                                                 WE ARE DELIVERING ON THE PROMISE OF OUR
                                                                 PURPOSE BY ADVANCING OUR COMMITMENT TO
                                                                 REAL FOOD, TRANSPARENCY AND SUSTAINABILITY,
                                                                 AND BY FOSTERING DEEP COMMUNITY
                                                                 CONNECTIONS WHERE WE HAVE OPERATIONS.

                                                                Mark Clouse
                                                                President and Chief Executive Officer, Campbell Soup Company

DEAR CAMPBELL STAKEHOLDERS,
FY2020 brought with it extraordinary                                     Real Food Comes From Real Heroes
                                                                         To effectively respond to the pandemic, we simplified our
challenges as our country and company                                    mission by focusing on three clear priorities:
grappled with a global pandemic that                                       1. Take care of our people;
fundamentally altered our society                                          2. Produce and distribute our products as safely and as
                                                                              quickly as possible for our customers, consumers and
and economy.                                                                  communities across North America; and
Throughout the pandemic, consumers across North America                    3. Anticipate and plan for the future.
have relied on Campbell for comfort and sustenance. In the first
half of FY2020, we established a strong foundation for our               Our top priority is always the safety and well-being of our
business, which served as a springboard during the pandemic.             employees. From the outset of COVID-19, we put protective
Our brands were reintroduced to millions of households as a              measures in place, including protocols to identify potential
result of the unprecedented demand for food. This demand                 employee exposure, quarantines and contact tracing, and
translated to historic business performance for Campbell in              enhanced cleaning procedures. We also implemented daily
FY2020. We believe that many of the consumer behaviors                   health screenings with thermal imaging temperature checks,
developed during this time, such as “quick-scratch” cooking, will        mandatory use of masks, vigilant social distancing and other
be lasting, and Campbell will continue to play an integral role in       policies to help employees who may be out of work due to
peoples’ lives, offering comfort, convenience, quality and value.        caregiving or health-related needs.

Campbell’s purpose, anchored in making real food, has never              The efforts of our employees, particularly our front-line teams and
been more relevant than it is right now.                                 our supply chain, have been nothing short of heroic. Our entire
                                                                         organization rallied around the essential role we’ve been playing
Delivering on the promise of our purpose through real food,              to ensure food is on tables across North America. In recognition
environmental and social remain key pillars of our strategic             of the extraordinary efforts of our front-line employees, we intro-
plan, even as we navigate this new environment.                          duced increased compensation through the end of FY2020 to
                                                                         more than 11,000 employees. The premium pay was in place for
                                                                         18 weeks, which was one of the longest-running programs in the
                                                                         food industry, and deservedly so, given the tremendous contribu-
                                                                         tions of our front-line teams during this time.

                                                                     3
CEO MESSAGE

                                                                           community and made a $400,000 contribution to the Equal
                                                                           Justice Initiative and $100,000 to the Boris L. Henson Foundation.
                                                                           The Foundation also worked with all of our Employee Resource
                                                                           Groups (ERGs) to create social justice funds for each ERG,
                                                                           matching employee donations at 100% – above our typical
                                                                           50% match for charitable contributions.

                                                                           In October 2020, Camille Pierce joined Campbell as our first
                                                                           Chief Culture Officer. In this newly created role, Camille leads
                                                                           Campbell’s enterprise-wide I&D strategy, working across the
                                                                           organization to build a winning team and culture, and aligning
                                                                           the company’s I&D goals with business outcomes. Camille
                                                                           brings with her years of experience from senior roles in I&D at
From the outset of the pandemic, we recognized the immediate               Whirlpool Corporation and human resources and marketing at
call for food and funding to help nonprofits meet the urgent needs         Procter & Gamble. She will be integral to our approach to I&D
of their communities. We quickly mobilized and in mid-March made           and in enhancing our culture in a systemic and sustainable way
an initial commitment of $1 million in funding and product donations       – by making I&D a company-wide priority, supported by an
to support food banks and local pantries in our 33 hometown                integrated plan with measurable goals over multiple years.
communities. We have since increased that contribution to more
than $8 million in financial support and food donations across             As part of this work, we have committed to building a more
our footprint in North America.                                            diverse supplier base, setting a goal to increase our spend with
                                                                           diverse suppliers by 25% over the next three years. In October,
Going forward, the Campbell Soup Foundation will continue to               I was proud to stand with a coalition of executives from across
focus on COVID-19 relief as communities navigate the social                our home state of New Jersey to announce a commitment to
and economic impact of COVID-19.                                           increase spending with small and diverse local suppliers.

Building a Winning Team and Culture                                        Empowering Stronger, Healthier Communities
Building a winning team and culture is another core component              This year, we will complete the final year of Campbell’s
of our strategic plan. We are focused on creating an inclusive and         Healthy Communities – our 10-year, $10 million initiative
diverse company and elevating the Campbell Employee Experience             focused on improving the health of young people, especially
– the key moments that are integral to working at Campbell.                in Camden, and other communities where Campbell has
                                                                           operations. Now, we are working on the next installment
COVID-19 was not the only challenge this past year. 2020 was               of that multiyear commitment – with the long-term goal of
also a year of reckoning around racial issues and social injustice.        creating a school food environment in which all students
We believe that as a company, Campbell can help drive societal             have access to food that provides the nourishment they
change, and that starts with our organization, which is why we             need to thrive and excel.
are creating an atmosphere where people can be real, and feel
safe, valued and supported to do their best work.                          Building a Sustainable and Resilient Supply Chain
                                                                           We will deliver on the promise of our purpose through our
In July 2020, we introduced an actionable inclusion and                    corporate responsibility and sustainability strategy. We made
diversity (I&D) strategy focused on standardizing key business             several environmental commitments over the course of the year,
processes and increasing learning opportunities; advocating for            including in May 2020, when we rolled out new sustainability
ally networks and communities; and acting with transparency                commitments to reduce packaging waste by increasing circularity
and accountability. As part of this work, we have committed                – keeping materials in use and out of landfills. To achieve this,
$1.5 million in financial support over three years to nonprofit            we have committed to transitioning 100% of our packaging to
organizations to raise awareness, advance education and fight              recyclable or industrially compostable materials and designs by
racism and discrimination. Working alongside the leaders of our            2030. These goals, listed below, are designed to address all
Black Resource Group (BRG), the Campbell Soup Foundation                   phases of the packaging life cycle, from sourcing to end-of-life,
identified organizations that are making an impact in the Black            including recycling or composting.

                                                                       4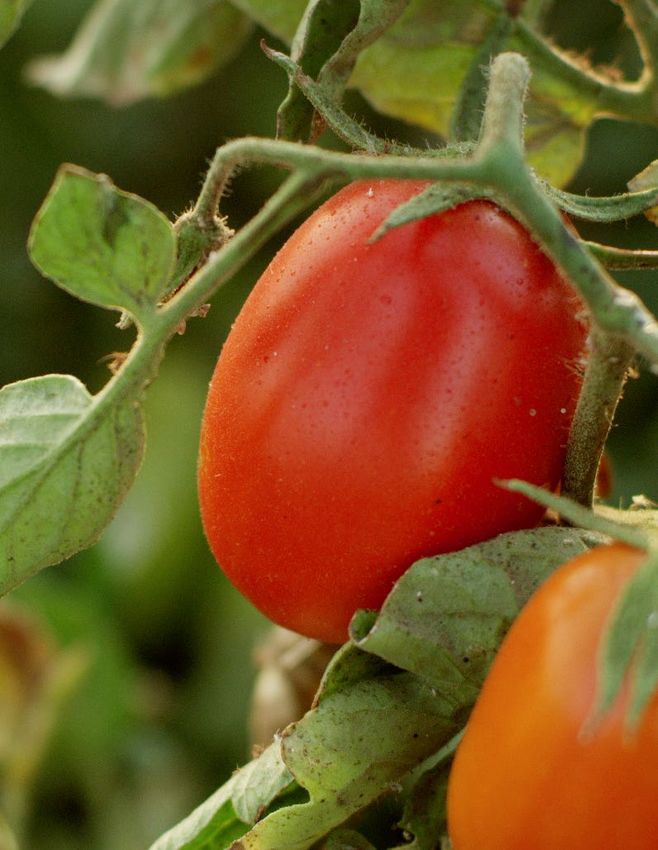
CEO MESSAGE

In September 2020, we joined retailers and food industry peers           In closing, Campbell plays an integral role in the fabric of our
in the “10x20x30” initiative with the goal of halving food loss          society, from the real food we make for consumers to the respon-
and waste by 2030. The 10x20x30 initiative is dedicated to               sibility we have in serving our communities and protecting our
achieving the United Nations Sustainable Development Goal                environment. We will continue to accelerate our impact in the
(SDG) Target 12.3, which calls for a 50% reduction in food loss          areas of real food, sustainability, societal change and community
and waste worldwide by 2030. As part of this commitment, we              support, as we advance our growth agenda and create value for
will continue to measure and publish our own food loss and               our stakeholders.
waste inventories.
                                                                         I’d like to thank the entire Campbell organization for rising to all
We also continued to advance our farmer engagement work                  of the challenges we faced in FY2020.
in our tomato, wheat and potato supply chains. A year ahead
of schedule, we reached our goal to improve fertilizer use on            Sincerely,
70,000 acres of wheat. Reaching this milestone boosts farmers’
profitability, benefits surrounding water quality and reduces the
impact on the climate.

As we look ahead and build upon our years of progress in                 Mark Clouse
advancing corporate responsibility and sustainability initiatives,       President and Chief Executive Officer
we are taking a more holistic approach to environmental, social          Campbell Soup Company
and governance opportunities. Our new approach will help us
further bring our purpose to life for our consumers, customers,
investors, the environment and the communities we call home.

                                                                     5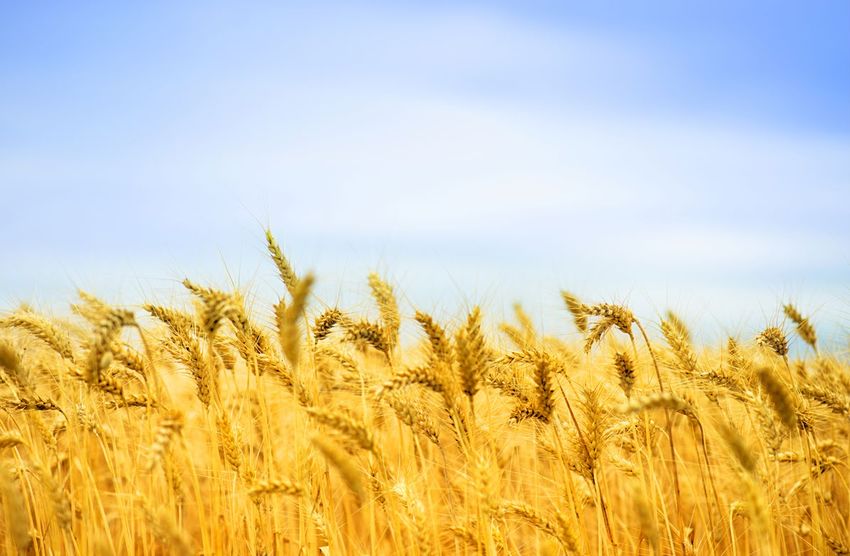
CELEBRATING OVER
   150 YEARS
   In 2019, we proudly celebrated Campbell’s 150th
   anniversary. This anniversary is much more than
   a number for us. It’s a testament to Campbell’s
   heritage and to the iconic brands that Campbell                          1876                             1897
   employees – past and present – have created and                    Our original packaging –       Dr. John T. Dorrance invents
                                                                     tin cans and glass jars – is     condensed soup. By con-
   continue to nurture and grow. Not many companies              inherently sustainable, meant to     densing soup and letting
   have endured such a test of time, particularly given           be reused over and over again.     consumers add the water at
                                                                 At this time, the company name      home, the cans are smaller
   today’s rapidly changing trends. Campbell has                 is stamped into the glass so the     and lighter, which in turn
   demonstrated staying power, being guided by a                  jars can easily be sent back to       means using less steel
   clear purpose and a strong corporate responsibility             Campbell to be sanitized and           and less fuel when
                                                                             used again.                shipping to customers.
   and sustainability strategy. Take a look at some key
   milestones along our journey.

          1914                                            1920s                                              1948
 Dr. John T. Dorrance becomes          Throughout the 1910s and 1920s, John Dorrance and            Campbell acquires V8 and with
  President of Campbell, and            his wife, Ethel, host annual meetings for farmers at         it, the Napoleon, Ohio, plant.
 his approach to procurement          their home on Campbell's research farm in New Jersey.           With this plant, we can now
becomes the company standard:          Campbell's in-house agricultural experts discuss new         procure vegetables from local
don't buy anything you wouldn't      growing techniques and methods, educating our farmers          farmers in Ohio and Michigan.
 put in front of your own family.    on crop rotation, water savings, seed selection and how        Many vegetables going to the
  This is where our Real Food                             to maximize yields.                         Napoleon plant continue to
      Philosophy originates.                                                                         be sourced from those same
                                                                                                    regions today. Later, this plant
                                                                                                    becomes the first in the legacy
                                                                                                         Campbell family to have
                                                                                                          solar installed on site.

          1961                                            1980s                                              2014
Campbell acquires Pepperidge        Snyder's of Hanover consolidates its operations in Hanover,      Campbell declares its intention
 Farm, founded by Margaret            Pennsylvania, beside a wheat field owned by the brand's           to be a purpose-driven
  Rudkin in 1937. Margaret          founder. The wheat from that field is used to make Snyder′s       company and launches our
  Rudkin becomes the first             of Hanover pretzels, and continues to supply us today.       purpose, Real food that matters
 woman to sit on Campbell’s             Later, the site builds a LEED Gold certified Research         for life’s moments. The Real
   Board of Directors the                          Center and a 26-acre solar field.                Food Philosophy, rooted in the
         same year.                                                                                 values of Campbell’s founders,
                                                                                                           is launched in 2016.

                                                                 6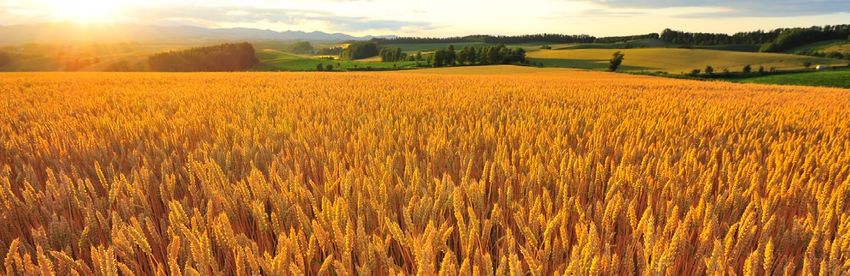
CORPORATE
RESPONSIBILITY STRATEGY
As a food company, we continually evolve our business to meet market conditions, best practices, and social
and environmental demands. We take the same approach with our corporate responsibility (CR) strategy. After
a series of key acquisitions and divestitures over the last few years, we took a step back and reevaluated our
focus areas and targets against a renewed Campbell. We asked ourselves where we could have the greatest
impact with our new family of brands and have evolved accordingly to reflect that new focus.

Transitioning to a More Holistic Strategy                               In FY2020, owners of each focus area were identified within
To make an even greater impact, we are evolving our CR strategy         the business to build out three-year strategic plans for their
to a more holistic approach with a focus on environmental, social       focus area. While we have been reporting on these focus areas
and governance (ESG) opportunities. This approach will allow            for years, this new approach will enable Campbell to manage
for increased engagement across the organization and help               corporate responsibility in a more holistic and strategic way
us to continue meeting the expectations of our consumers,               over the long term by building strategies for progress into the
customers, investors and other stakeholders.                            business itself with alignment from our senior leadership team.

We have identified 14 ESG focus areas that were determined by           While we continue to report our corporate responsibility work
three key considerations:                                               in the Grown, Sourced, Produced and Shared framework in this
• Issues that are most material to Campbell                            report, we will be co-creating and launching a new communications
• Issues that have historically been a strength for Campbell           framework in FY2021 that reflects our new approach and builds
• Issues that the company and our brands can leverage to               an aspirational vision for Campbell.
  make a measurable impact into the future

                                       OUR 14 ESG FOCUS AREAS:

       ENVIRONMENTAL                                     SOCIAL                                     GOVERNANCE
       RESPONSIBILITY                                RESPONSIBILITY                                   & ETHICS
                  Climate                              Food Safety & Quality                            Board Diversity
                   Water                                   Transparency                                Code of Conduct
                   Waste                                Community Impact                              Risk Management
                 Packaging                                   Nutrition                               Customer Satisfaction
                                                         Animal Welfare
                                                         Human Rights

                                                                    7
CORPORATE RESPONSIBILITY STRATEGY

Completing Our Commodity Risk Assessment                                • We enabled food access across the country during the
In FY2020, we worked with The Sustainability Consortium (TSC)             COVID-19 pandemic by increasing production to help
to complete a commodity risk assessment that represented                  meet demand and giving over $8 million in cash and
our new family of brands. This assessment reviewed the                    in-kind donations to community organizations in our
environmental and social risks associated with 30 ingredient              33 Campbell hometowns.
categories in our product portfolio. The results indicated that         • We prioritized the health and safety of our employees during the
we needed to make the following changes to our priority raw               pandemic, especially our front-line workers with supplemental
materials list:                                                           payments, temperature checks, personal protective equipment,
• Removed beef, eggs, pork, soy and sweeteners because we                social distancing practices and other accommodations.
  source primarily from the U.S. and Canada, which is lower risk.       •W  e advanced our farmer engagement work in our tomato,
• Removed jalapeños and seafood because we purchase small                wheat and potato supply chains, and reached our wheat
  volumes of these categories, and 89% of our seafood is Marine           fertilizer optimization goal one year ahead of schedule.
  Stewardship Council (MSC) certified.                                  • We advanced traceability of priority raw materials along our
• Focused dairy on cheese ingredients, as they feature most              supply chain.
  prominently in our products.
• Added almonds and cashews because of volumes purchased               As we build the next generation of our corporate responsibility
  and shift in brand focus since purchasing the Pacific Foods,          strategy, we will continue to advance these efforts, and
  Emerald and Lance brands, along with the environmental and            others, and report on our progress in our annual Corporate
  social risks associated with these ingredients.                       Responsibility Report.

For the ingredients removed from our priority list, we will             Our strategy will also continue to be built with major food
continue to monitor our suppliers to ensure continued                   industry trends in mind. From water scarcity, climate change
compliance with our Responsible Sourcing Supplier Code.                 and animal welfare to affordability, nutrition and transparency,
                                                                        we are driving impact. And as we work together now to lay the
Celebrating Notable Wins                                                foundation for Campbell’s next 150 years, we remain resolute in
We also achieved some notable corporate responsibility wins.            our belief that while the world continues to change around us,
• We launched four new sustainable packaging                           some things must remain constant: our commitment to real
  commitments focused on packaging recyclability,                       food and our commitment to transparency.
  recycled content, consumer education and expanding
  access to recycling infrastructure.

CURRENT CORPORATE RESPONSIBILITY STRATEGY
  OUR VISION                                                                OUR MISSION
  We strive to build a more resilient food system, making                  To deliver on the promise of our purpose through
  real food that improves the world we all share, for                      food that is ethically and sustainably grown, sourced,
  generations to come.                                                     produced and shared.

          GROWN                          SOURCED                              PRODUCED                              SHARED
        Protect natural                   Ensure ethical                     Promote stewardship                Improve stakeholder
         resources and                   and sustainable                          of natural                        value through
     livelihoods on farms                practices in our                        resources in                     transparency and
                                           supply chain                         our operations                      our Real Food
                                                                                                                     Philosophy
     • Resource conservation           • Responsible sourcing                      • Climate
        • Farmer livelihoods                 • Traceability                         • Water
                                                                                                                      • Employees
    • Pesticide & fertilizer use          • Supplier diversity                      • Waste
                                                                                                                • Customers/Consumers
    • Agricultural innovations              • Human rights
                                                                                                                       • Investors
                                                                                                                     • Communities

                                                                    8
CORPORATE
RESPONSIBILITY GOALS
CATEGORY TARGET SCOPE PROGRESS
GROWN
Reduce GHGs per short ton of tomatoes by 20% by the end of 2020, as U.S. tomatoes Goal achieved,
compared to 2012 26% reduction
Reduce water use per pound of tomatoes by 20% by the end of 2020, as U.S. tomatoes Goal achieved,
compared to 2012 23% reduction
Reduce nitrogen applied per short ton of tomatoes by 10% by the end of 2020, U.S. tomatoes Reduced 6%
as compared to 2012
Enroll 70,000 acres of wheat in a fertilizer optimization plan by the end of 2020 U.S. wheat 70,000 acres
flour
Source 50% (by volume) of each plant-based priority ingredient from suppliers Global
Agriculture engaged in an approved sustainable agriculture program by FY20251
Almonds 0%
Cashews 0%
Potatoes 0%
Tomatoes 83% of volume
Wheat 19% of volume
SOURCED
Source 100% cage-free eggs by the end of 20252 Global 10%
Source 100% “No Antibiotics Ever” (NAE) chicken for diced and canned U.S. and 100%
chicken products by the end of 2017 Canada
Source 100% gestation crate-free pork by the end of 20222 Global 16%
Advance the welfare of broiler chickens in partnership with our suppliers U.S. 0%
to source chicken meat from birds that have been raised in improved
environments, including litter and enrichments by 20243
Purchase 100% Roundtable on Sustainable Palm Oil (RSPO) certified palm oil Global Campbell legacy
Responsible
by the end of FY2021 brands: 100%
Sourcing
Snyder’s-Lance
brands:CORPORATE RESPONSIBILITY GOALS
CATEGORY TARGET SCOPE PROGRESS
SOURCED
Transition 100% of packaging to recyclable or industrially compostable Entire portfolio, 91%
designs and materials by 2030 by weight
Increase the use of post-consumer recycled content and incorporate 25% Entire portfolio, Aluminum – 70%
post-consumer recycled content into polyethylene terephthalate (PET) on average Corrugate – 38%
bottles by 2030 Glass – 35%
Steel – 35%
Plastic – 0%
Packaging Drive increases in recycling rates through standardized on-pack labeling by Entire portfolio Establishing
including the How2Recycle label on 100% of packaging by 2022 baseline
Expand access to recycling and advance the development of infrastructure to United States Joined The
improve the collection and recycling of packaging by building and investing in Recycling
partnerships with peers and industry groups Partnership
PRODUCED
Reduce Scope 1 and 2 greenhouse gas (GHG) emissions by 25% on an North America Increased 5%
absolute basis by FY2025, as compared to FY20171
Climate Source 40% of our electricity from renewable or alternative energy sources North America 10% renewable
by FY20202 electricity
Reduce water use by 20% on an absolute basis by FY2025, as compared to North America Reduced 7%
Water FY2017
Reduce the amount of waste sent to landfills by 25% on an absolute basis by North America Increased 19%
FY2025, as compared to FY2017
Cut food waste in half by FY2030, as compared to FY20173 North America Reduced 14%
Waste plants
SHARED
Increase food access for 100,000 residents in Campbell communities Campbell 46,666
communities
Provide nutrition education to 50,000 people to encourage healthy living Campbell 19,369
in Campbell communities communities
Invest $5 million to improve the school food environment for children Campbell $1.4M
Community communities
Engage 70% of Campbell employees in community-based activities Campbell 11%
communities
Contribute 75,000 traditional and skills-based employee volunteer hours Campbell 6,075
across Campbell’s footprint to increase the capacity of our community partners communities
Achieve 3% decrease in reportable and lost time incidents per year with North America
long-term goal of 0 incidents
Reportable incidents 15%
Safety
Lost time incidents 11%
1. Scope 2 GHG emissions data prior to FY2020 were calculated using the location-based method. FY2019 GHG emissions were third-party verified.
FY2020 Scope 2 GHG emissions data within the table were calculated using market-based calculations and include the application of RECs.
Location-based Scope 2 GHG emissions were 251,477 metric tonnes of CO2e. They were third-party verified, as well as our water and waste to
landfill data for FY2020.
2. We set our renewable goal in 2010. While we did not meet our goal as we had set out to, it led us to develop and install 28 MWs of renewable energy
at our manufacturing sites for which we are proud. We expect to continue to expand renewable energy in our portfolio in the coming years and
incorporate our renewable intentions into our Science Based Target that we committed to setting in October 2020.
3. Campbell defines its food waste commitment in accordance with Sustainable Development Goal 12.3. As such, we exclude animal feed and biomaterial
processing from the scope of our goal.
10PERFORMANCE SCORECARD
BUSINESS OVERVIEW (USD in millions) FY2016 FY2017 FY2018 FY2019 FY2020
Net Sales $5,868 $5,837 $6,615 $8,107 $8,691
R&D $93 $91 $91 $93
EBIT $865 $1,431 $1,010 $979 $1,107
Taxes on Earnings $392 $106 $151 $174
Capital Expenditures $341 $338 $407 $384 $299
Dividends Paid $390 $420 $426 $423 $426
GROWN FY2016 FY2017 FY2018 FY2019 FY2020
GHG Emissions (tonnes CO2e/short ton of tomato) 0.0057 0.0057 0.0060 0.0054 0.0054
Water Use (gallons/pound of tomato) 7.53 7.53 8.16 7.20 7.44
Nitrogen Use (pounds nitrogen/short ton of tomato) 4.12 4.12 4.33 4.01 4.03
% of Acres with Drip Irrigation 69% 69% 72% 78% 75%
Acres Enrolled in Fertilizer Optimization Plan 0 0 10,000 30,000 70,000
% by Volume Engaged in Sustainable Ag Program1
Almonds 0%
Cashews 0%
Jalapeños 0% 0% N/A
Potatoes 0% 0% 0%
Soy 0% 0% N/A
Tomatoes 87% 90% 83%
Wheat 3% 8% 19%
1. In FY2020, Jalapenos and Soy were removed from the program; Almonds and Cashews were added.
11PERFORMANCE SCORECARD
SOURCED FY2016 FY2017 FY2018 FY2019 FY2020
Cage-Free Eggs N/A 12% 16% 11% 10%1
“No Antibiotics Ever” Chicken N/A 97% 98% 100% 100%
Gestation Crate-Free Pork 34% 21% 57% 18% 16%1
Roundtable on Sustainable Palm Oil (RSPO) 100% 100% 100% for 100% for 100% for
Certified Palm Oil Campbell, still Campbell Campbell
integrating legacy brands; legacy brands;
Snyder′s-Lance 0.33% forPERFORMANCE SCORECARD
PRODUCED FY2016 FY2017 FY2018 FY2019 FY2020
Energy Use
Electricity Use (mmbtu) 2,337,129 1,994,463 1,942,019 1,929,600 2,046,158
Fuel Use (mmbtu) 7,249,795 8,046,984 8,340,258 8,189,545 8,562,372
Total Energy Use (mmbtu) 9,586,924 10,041,447 10,282,277 10,119,145 10,608,530
Energy Intensity (mmbtu/tonne of food produced) 2.58 3.03 3.05 3.14 3.14
Renewable Energy Generated (kWh) for the Grid 22,116,941 31,873,837 34,722,775 54,650,6971 59,189,926
Percent of Total Electricity Use 3% 6% 6% 10% 10%
Greenhouse Gas Emissions2
GHG Emissions (tonnes CO2e) 724,996 687,420 693,876 649,134 722,200
GHG Intensity (tonnes CO2e/tonne of 0.19 0.21 0.21 0.20 0.20
food produced)
Direct (Scope 1) Emissions (tonnes CO2e) 403,057 427,564 443,186 434,869 469,912
Indirect (Scope 2) Emissions (tonnes CO2e) 321,939 259,856 250,690 214,265 252,288
Indirect (Scope 3) Emissions (tonnes CO2e) 8,443 9,742 7,262 4,110,3823 5,575,6124
Carbon Offsets Purchased (tonnes CO2e) 51 77 6 421 05
Water Use
Water Use (m3) 31,858,298 22,800,911 21,835,395 20,772,388 21,248,755
Water Intensity (m3/tonne of food produced) 8.56 6.87 6.47 6.45 6.45
Waste Generation
Waste Generated (tonnes) 450,814 183,436 174,824 173,340 178,333
Waste to Landfill (tonnes) 44,161 33,184 30,573 32,584 39,386
Waste to Incineration/Controlled 2,231 1,500 1,457 1,849 2,924
Combustion (tonnes)
Waste Recycled (tonnes) 43,343 37,974 39,686 30,530 42,674
Other Diverted Waste (tonnes) 361,079 110,778 103,108 108,377 93,349
Total Waste Diverted from Landfill (tonnes) 406,653 150,252 144,251 140,756 138,947
Landfill Diversion Rate (%) 90% 82% 83% 81% 78%
Total Waste Intensity (tonnes/tonne of 0.12 0.06 0.05 0.05 0.05
food produced)
Hazardous Waste Generated (tonnes) 50 15 34 41 13
1. In FY2019, we generated renewable energy, and in prior years we sold it to others.
2. Scope 2 GHG emissions data prior to FY2020 were calculated using the location-based method. FY2019 GHG emissions were third-party verified.
FY2020 Scope 2 GHG emissions data within the table were calculated using market-based calculations and include the application of RECs. Location-based Scope 2 GHG emissions
were 251,477 metric tonnes of CO2e. They were third-party verified, as well as our water and waste to landfill data for FY2020.
3.In prior years, Scope 3 emissions included only employee business travel by car, plane and train. In FY2019, Campbell estimated additional emissions categories, including Purchased
Goods and Services, Capital Goods, Fuel and Energy Related Activities, Waste Generated in Operations, Business Travel, Employee Commuting, Upstream Leased Assets, Downstream
Transportation and Distribution, and End of Life Treatment of Sold Products. We have also corrected a unit error from kg to metric tons, removed divestitures and included acquisitions.
4. In partnership with an external consultant, we have improved our Scope 3 calculation methodology to be more detailed and accurate, and have restated our FY2020 Scope 3
emissions using this methodology.
5. The Plum Organics brand previously purchased carbon offsets to cover the GHG emissions associated with its office footprint. The brand did not purchase carbon offsets in FY2020.
13PERFORMANCE SCORECARD
SHARED FY2016 FY2017 FY2018 FY2019 FY2020
Occupational Health and Safety
Total Reportable Incident Rate (TRIR)/200,000 hours1 1.96 1.37 1.67 1.43 1.21
Lost Time Incident Rate (LTIR)/200,000 hours 1
0.23 0.20 0.39 0.27 0.24
Employee Fatalities 0 0 1 0 0
Environmental Notice of Violations (NOVs) 1 5 4 5 9
Environmental Fines (USD) $1,500 $7,100 $4,450 $2,600 $0
Workplace Diversity
Women in Global Workforce (%) 43% 43% 42% 42% 41%
Women in Management (%) 41% 43% 43% 41% 42%
Women on the Board of Directors (%) 31% 33% 33% 33% 33%
Community
Charitable Giving, including In-Kind (USD in millions) $65.1 $61.9 $54.4 $64.2 $55.9
Residents with Increased Food Access 2
46,666
Residents Provided with Nutrition Education2 19,369
School Food Investment $1.4 million
% Campbell Employees Engaged 11%
Employee Volunteer Hours 6,075
Employee Benefits (USD in millions)
Tuition Assistance Paid $0.79 $0.80 $0.89 $0.96 $0.35
U.S. Health Care Expense $115 $123 $121 $125 $120
Pension Income/Expense $279 $(230) $(150) $109 $91
Postretirement Medical & Life Expense $38 $(28) $(35) $(6) $2
401 (k) Retirement & Supplemental Plan Contributions $31 $42 $52 $62
1. Safety data for Pacific Foods and the Snyder’s-Lance brands began to be included in FY2018. This contributed to the increase in TRIR and LTIR over FY2017.
2. Final Grant Reports for FY2020 Foundation grants are not due until Spring 2021, so these numbers represent partial data.
14PERFORMANCE SCORECARD
SHARED (Continued) FY2016 FY2017 FY2018 FY2019 FY2020
Nutrition 1,2
Total Products with Reduced Negative Nutrients $5,691 $6,115 $6,096 $7,102 $7,724
(revenue in millions)
M&B Products with Reduced Negative Nutrients N/A N/A N/A $2,909 $3,146
(revenue in millions)
Snacks Products with Reduced Negative N/A N/A N/A $4,193 $4,578
Nutrients (revenue in millions)
Total Products with Reduced Negative Nutrients 55% 59% 59% 68% 70%
(revenue/total revenue)
M&B Products with Reduced Negative Nutrients N/A N/A N/A 49% 51%
(revenue/total revenue)
Snacks Products with Reduced Negative N/A N/A N/A 92% 93%
Nutrients (revenue/total revenue)
Total Products with Increased Positive Nutrients $3,158 $3,250 $3,145 $2,751 $3,232
(revenue in millions)
M&B Products with Increased Positive Nutrients N/A N/A N/A $1,969 $2,286
(revenue in millions)
Snacks Products with Increased Positive N/A N/A N/A $783 $947
Nutrients (revenue in millions)
Total Products with Increased Positive Nutrients 31% 32% 30% 26% 29%
(revenue/total revenue)
M&B Products with Increased Positive Nutrients N/A N/A N/A 33% 37%
(revenue/total revenue)
Snacks Products with Increased Positive N/A N/A N/A 17% 19%
Nutrients (revenue/total revenue)
Total Healthy Products (revenue in millions) $2,853 $2,919 $2,490 $1,742 $1,970
M&B Healthy Products (revenue in millions) N/A N/A N/A $1,362 $1,570
Snacks Healthy Products (revenue in millions) N/A N/A N/A $381 $400
Total Healthy Products (revenue/total revenue) 28% 28% 24% 17% 18%
M&B Healthy Products (revenue/total revenue) N/A N/A N/A 23% 25%
Snacks Healthy Products (revenue/total revenue) N/A N/A N/A 8% 8%
Servings of Vegetables Delivered to 14.98 15.7 billion 16 billion 9 billion1 >10.5 billion
Global Marketplace billion
Servings of Vegetables Delivered from M&B N/A N/A 10.2 billion N/A N/A
Portfolio Alone
Servings of Whole Grains Delivered to 150 million Not reported Not reported 1.5 billion 1.7 billion
Global Marketplace (Vita-Wheat only) servings from
Pepperidge Farm
and Campbell
brands
1. Historical data for FY2016-FY2019 have been adjusted to correct a reporting error impacting the products with increased positive nutrients and healthy products categories.
In FY2019, we began to report divisional nutrition information along with total nutrition information.
2. Reduced in Negative Nutrients: Products that (1) are reduced in at least one negative nutrient of public health concern such as saturated fat, trans fat, sodium, sugar or calories
AND (2) for which total fat, saturated fat, cholesterol and sodium are all below established thresholds.
Positive Nutrients: Products that (1) supply a meaningful amount of at least one positive nutrient, fiber, and/or vegetables AND (2) for which total fat, saturated fat, cholesterol and
sodium are all below established thresholds.
Healthy Products: Based on FDA regulatory definition for healthy, which includes strict limits for total fat, saturated fat, cholesterol and sodium AND has a requirement for a good
source of at least one beneficial nutrient.
Data reported for nutrition-related metrics are based on gross sales.
15ALIGNING WITH THE UNITED
NATIONS SUSTAINABLE
DEVELOPMENT GOALS
While Campbell’s material corporate responsibility initiatives and commitments map to all 17 of the
United Nations Sustainable Development Goals (see page 88), we have prioritized the following
six goals for our business. You can learn more about our commitments on page 9 of this Report.
UN SDGs Our Commitments
Campbell is improving food security and nutrition by:
• investing in food innovations that enable consumer health and well-being
• crafting food that is accessible to all as part of our Real Food Philosophy
• increasing access to affordable, healthy food through several strategies, including Healthy Corner
Stores, school and community gardens, farmer's markets, food prescription programs and school
food programs
Campbell is promoting good health and well-being by:
• providing options that offer positive ingredients, like vegetables and whole grains
• providing options that have fewer negative nutrients, like sodium, sugar and saturated fat
• increasing nutrition education in our schools and communities through culinary arts
trainings for families and students, taste tests in the cafeteria and nutrition education
lessons in corner stores
Campbell is promoting decent work for all by:
• ensuring all Campbell-owned facilities comply with our Human Rights Principles
• continuing to build a safety-focused culture with a long-term goal of zero incidents
• enforcing our Responsible Sourcing Supplier Code to identify and eliminate labor violations
in our supply chain, if any
• strengthening farmer livelihoods, by supporting innovations that enhance soil health, yields
and resiliency
Campbell is reducing inequality by:
• crafting food that is accessible to all as part of our Real Food Philosophy
• enforcing our Code of Business Conduct and Ethics and Responsible Sourcing Supplier
Code to identify and eliminate labor violations, if any, and ensure equal opportunities for all
• procuring from certified diverse suppliers, and ensuring that such suppliers have equal
access to procurement opportunities
• ensuring that our grantmaking approach incorporates the voice of those being served in
the community
Campbell is promoting sustainable consumption and production by:
• committing to responsibly source and trace our priority raw materials
• reducing water use by 20%, waste sent to landfills by 25% and food waste
by 50%
• ethically sourcing ingredients through commitments to certified palm oil,
cage-free eggs and gestation crate-free pork
Campbell is combatting climate change and its impacts by:
• reducing greenhouse gas emissions in our operations
• sourcing electricity from renewable sources and advocating for responsible
climate policy
• employing sustainable agriculture programs to improve fertilizer efficiency and develop more
climate-resilient agriculture
16RECOGNITIONS
100 Best Bloomberg Gender JUST Capital
Corporate Citizens Equality Index Ranked #81
Ranked #35 Included for demonstrating Recognized on the JUST 100
Corporate Responsibility commitment to transparency in list as one of the most JUST
Magazine gender reporting and advancing companies in America
11th consecutive year women’s equality 4th among food and
2nd consecutive year beverage companies
100 Most Sustainable America’s Most FTSE4Good Index
Companies in the World Responsible Companies 6th consecutive year
Ranked #93 Ranked #58
One of only two U.S. food Included in Newsweek’s second
companies included annual list of the top 400 most
2nd consecutive year responsible companies
in America
17RECOGNITIONS
“CAMPBELL PLAYS AN INTEGRAL ROLE IN THE FABRIC OF OUR SOCIETY, FROM
THE REAL FOOD WE MAKE FOR CONSUMERS TO THE RESPONSIBILITY WE HAVE
IN SERVING OUR COMMUNITIES AND PROTECTING OUR ENVIRONMENT.”
Mark Clouse
President and CEO, Campbell Soup Company
Greater Toronto’s MSCI Index Series Produce for Better
Top Employers Score of AA and included Health Foundation
Recognized for investment in employee as a constituent of the MSCI Fruits & Veggies
education and development, parental Global ESG and SRI Indices More Matters® Role Model
leave and flexible work arrangements. 7th consecutive year
Barron’s 100 ISS-oekom
Most Sustainable Achieved “Prime” status for
Companies in America strong ESG performance in
Ranked #60 the Food & Beverages sector
3rd consecutive year
FMI Foundation America’s Best
Gold Plate Award Employers for Women
Awarded the Gold Plate Award Ranked #151
in the Supplier category for Included on Forbes’ list for strong
encouraging family meals hiring and retention practices that
directly benefit female employees
6th among Food and Beverage companies
18MATERIALITY
Corporate responsibility topics are considered material for us if and Labor Practices, Product Responsibility and Environmental
they influence the judgment and decisions of our external and Responsibility. Stakeholders were also asked, of the 17 United
internal stakeholders, as well as having an impact on them and Nations Sustainable Development Goals, where Campbell could
our business. In FY2019, we conducted a robust assessment have the most impact. The responses reaffirmed our previous
with internal and external stakeholders to understand where alignment with Goals 2, 3, 8, 10, 12 and 13. We received nearly
to focus as our company evolves and identified and prioritized 1,500 responses in total with employees accounting for
our material corporate responsibility topics through a four-step 88% of responses.
assessment process.
Step 3: Survey Leadership – We surveyed Campbell leadership
Step 1: Identify Issues – We reviewed the material corporate to understand how the 25 topics might impact the business over
responsibility topics reported publicly by our peers and assessed the next five years. Leaders from across the business were asked
issues that are trending in the media and with Campbell’s inves- to rate our ability to control potential impacts, the likelihood of
tors, customers, suppliers and NGO partners. From this research, such impacts and how these might impact our reputation,
we added a few new topics to our list, including Risk and Crisis strategic plan, purpose and/or values.
Management, Product Innovation, Supply Chain Resilience and
Commodity Availability, Pesticides and Chemical Contaminants, Step 4: Validate – The results of the assessment were shared
Women’s Empowerment and Responsible Use of Technology. with leaders across the business who provide feedback on the
topics. These results were validated against the results of the
Step 2: Survey Stakeholders – We surveyed internal and external research along with the feedback of our Campbell leaders. The
stakeholders, including employees, suppliers, retail customers, results are shared below and are reevaluated throughout the
NGOs, trade associations, etc. We also posted the survey on year, as topics can shift in priority. We did see significant shifts
Twitter for consumer feedback, which we received. The survey in the rating of select topics compared to our last assessment
asked stakeholders to rate the importance of 25 topics in four in FY2016, including the ranking of Transparency along with
broad categories: Responsible Business Practices, Societal Impact Health, Nutrition and Wellness, among others.
ECONOMIC ENVIRONMENTAL SOCIAL
Food Safety
and Quality
IMPORTANCE TO STAKEHOLDERS
Business Ethics
Occupational Health and Safety
Culture and Human Capital Management
Human Rights Transparency
Pesticides and Chemical Contaminants Responsible Labeling
and Marketing
Responsible Sourcing Risk and Crisis Management
Packaging
Sustainable Agriculture and Traceability
Footprint Product Innovation
Waste Reduction
Water Supply Chain Resilience and Commodity Availability
Women’s Empowerment
Stewardship Inclusion and Diversity
Health, Nutrition and Wellness
Food Access Food Waste Energy and Climate Change
Animal Welfare
Responsible Use
of Technology Community Involvement
Issues of importance to certain stakeholder groups Issues actively managed & addressed in the report but as Key Material Issues addressed through business
monitored & addressed as necessary part of one of the nine key material issues strategies & in the report
IMPORTANCE TO THE BUSINESS
For material issue definitions, please refer to the Appendix.
19STAKEHOLDER
ENGAGEMENT
Proactive and consistent engagement with both internal and Our approach to stakeholder engagement includes:
external stakeholders is critical to effectively executing our • Identification of issues that are most important
corporate responsibility strategy. to stakeholders
•E stablishment of processes for meaningful and
effective engagement
•B enchmarking for leadership performance within
and outside our sector
The following table summarizes our engagement with major stakeholder groups:
STAKEHOLDERS TYPES OF ENGAGEMENT ISSUES
Advocacy Groups/Non-Governmental • Organizational Memberships • Health, Nutrition & Wellness
Organizations (NGOs) • Direct Engagement • Nutrition & Labeling Standards
• Strategic Issue Partnerships • Animal Welfare
• Professional Conferences • Deforestation
• Roundtable Events • Climate Change
• Social Media • Human Rights
• Website and Corporate Responsibility Report • Sustainable Agriculture
• Packaging
Communities • Direct, On-the-Ground Relationships • Critical Local Needs (such as food access and
• Corporate & Employee Giving nutrition education)
• Networking Events • Disaster Relief
• Surveys • Environmental Initiatives
• Signature Partnerships • Health, Nutrition & Wellness
• Regional Priority Plans • Strategic Partnership Priorities (such as health
• Employee Volunteerism and well-being)
Consumers • Dedicated 24-Hour Toll-Free Hotline • Food Safety & Quality
• Consumer Insights • Transparency
• Branded Websites • Packaging Information
• Campbell’s Kitchen Website • Health, Nutrition & Wellness
• Campbell’s Nutrition Website • Affordability
• What’s in My Food Website • Food Waste
• Social Media • GMOs
• Brand PR • Environmental Practices
Customers • Dedicated Customer Teams • Product Innovation
• Customer Meetings and Presentations • Trade Practices
• Customer Surveys • Social Accountability
• Customer Letters and Responses to Inquiries • Environmental Practices
• Sales Materials • Transparency
• Industry Trade Groups (such as FMI) • Sales Support & Service
• Health, Nutrition & Wellness
Employees • Quarterly Employee Forums • Inclusion & Diversity
• Town Hall Meetings • Occupational Health & Safety
• Leadership Teams • Recognition
• Focus Groups • Equitable Compensation & Benefits
• Employee Resource Groups • Talent Management
• Workplace by Facebook Site • Business Trends
• Email Communications • Health, Nutrition & Wellness
• Surveys • Real Food
• Digital Signage • Transparency
• Anonymous Hotline • Sustainability
• Community Engagement
20STAKEHOLDER ENGAGEMENT
STAKEHOLDERS TYPES OF ENGAGEMENT ISSUES
Investors • Meetings with Institutional and Socially • Business Performance
Responsible Investors • Governance Practices
• Direct Engagement on Specific Topics of Interest • Sustainability Strategies
• Ratings/Rankings & Indices • Health & Well-Being Strategies
• Quarterly Earnings Releases • Ethical Business Practices
• Annual Report • Human Rights
• Annual Shareholder Meetings • Nutrition
• Investor Calls and Forums
• Conferences
• Non-Deal Roadshows (NDRs)
Regulators & Policymakers • Campbell Political Action Committee • Food Safety & Quality
• In-Person Meetings and Plant Tours • Product Labeling and Marketing
• Direct Engagement on Issues Important to Campbell • Trade Policy Implications
• Advocacy • Health, Nutrition & Wellness Policy
• Significant Monitoring and Communication of • Environmental Policy
Regulatory Activities • Sustainable Agriculture
• Industry Trade Associations
Suppliers • Collaborative Partnerships • Product Safety & Quality
• Responsible Sourcing Supplier Code • Human Rights
• Sourcing Events • Ethical Sourcing
• Strategic Relationship Management Program • Sustainable Packaging
• Face-to-Face Meetings • Ingredient Traceability
• Supplier Diversity Program • Cost-Savings Opportunities
• Surveys • Supply Chain Risk Mitigation
• Assessments & Audits • Sustainable Agriculture
21GROWN
22OUR APPROACH
Real food has roots. Roots in farm-grown ingredients, delicious taste and
sustainable agriculture. Real food has roots in quality and heritage. And our
focus on integrating sustainability principles into how we grow our food and
nurture our land continues in partnership with farmers across the country.
Campbell’s priority ingredients for sustainable agriculture are tomatoes, wheat, potatoes,
almonds and cashews – ingredients important to our brands and our stakeholders. In fact,
with the acquisition of Snyder’s-Lance and the formation of the Campbell Snacks division,
we are now one of the largest purchasers of chipping potatoes in America.
WE BUY OVER 600 We recognize our impact can be significant. That’s why we have
been working on projects that conserve natural resources, improve
MILLION POUNDS OF
livelihoods on farms and connect farmers with the latest innova-
CHIPPING POTATOES tions and data analytics. These efforts empower farmers to make
EVERY YEAR – MAKING US better-informed decisions. They also help us be transparent with
ONE OF THE LARGEST our customers and consumers on the progress we make and on
PURCHASERS OF CHIPPING challenges that are too complex to be solved with short-term
POTATOES IN AMERICA. solutions. After all, real food must also be rooted in respect for
nature – and we continue to learn from nature about how to best
nurture it while growing enough food sustainably and responsibly
to feed an ever-growing world.
Partnerships are a core component of our approach. In 2019, we
partnered with The Sustainability Consortium (TSC) to help launch
a task force on Responsible Pest Management. We assisted in
recruiting a broader set of members for the task force and helped
inform its guidelines and objectives. The task force is up and running
and currently working to collect and analyze available data on pest
management. The goal: to develop metrics and tools that can be used
by farmers and companies to measure and report on responsible pest
management and identify opportunities to reduce risk on farms.
23GROWN
GOALS & PROGRESS
HIGHLIGHTS
GOAL: GHG EMISSIONS GOAL:
Source 50% (by volume) of each plant-based priority (tonnes CO2e/short ton of tomato) Reduce GHGs per
ingredient from suppliers engaged in an approved short ton of tomatoes
0.0073
sustainable agriculture program by FY2025 by 20% by the end of
0.0060
0.0054 0.0054 2020, as compared
PRIORITY % BY VOLUME ENGAGED IN GOAL: 0.0058
INGREDIENT SUSTAINABLE AG PROGRAM
to 2012
Almonds
Cashews
0%
0%
26%
SINCE 2012
Potatoes1 0%
Tomatoes 83%
2012 2018 2019 2020
Wheat 19% BASELINE
ACRES ENROLLED
IN FERTILIZER
GOAL: WATER USE
(gallons/pound of tomato)
GOAL:
OPTIMIZATION PLAN Enroll 70,000 acres Reduce water
of wheat in a fertilizer 9.65
use per pound of
70,000 optimization plan 8.16 tomatoes by 20% by
GOAL: 70,000
by the end of 2020 7.20 7.44
GOAL: 7.72
the end of 2020, as
compared to 2012
30,000
100%
of goal met
23%
SINCE 2012
10,000
2018 2019 2020 2012 2018 2019 2020
BASELINE
ACRES WITH DRIP IRRIGATION2 NITROGEN USE
(pounds nitrogen/short ton of tomato)
GOAL:
(percent) Reduce nitrogen
4.33
applied per short ton
78% 4.28 4.03
72% 75% 4.01 of tomatoes by 10%
GOAL: 3.85 by the end of 2020,
as compared to 2012
75% 6%
SINCE 2012
OF TOMATO
ACRES HAVE
DRIP IRRIGATION
2018 2019 2020 2012 2018 2019 2020
BASELINE
1. In FY2020, 100% of potato supply was baselined, laying the foundation for engagement in a sustainable agriculture program in FY2021.
2. Some annual fluctuation in irrigation adoption rates is expected due to factors such as crop rotations and increased furrow-irrigated organic tomato use.
24GROWN // STORIES OF PROGRESS
NEW DATA ANALYTICS TOOL HELPS ADVANCE
WHEAT FARMERS’ SUSTAINABILITY EFFORTS
In 2015, we set a goal to enroll 70,000 acres of wheat in a began working with local agricultural retailer, The Mill, to advance
fertilizer optimization plan by 2020. In 2018, we expanded stewardship efforts with farmers across 10,000 acres of wheat.
our commitment by setting a target to sustainably source In 2019, we began collaborating with Heritage Cooperative to
50% of our wheat by 2025. launch a similar effort in Ohio, another important wheat sourcing
region for Campbell. By the end of FY2020, Heritage had engaged
To accomplish these goals, we collaborated with Truterra, LLC 60,000 acres of wheat in the Truterra program, bringing our
(the sustainability solutions business of Land O’Lakes, Inc.) as partnership to an important milestone: the completion of our
they developed a data analytics tool called the Truterra™ Insights 70,000-acre commitment, one year ahead of schedule.
Engine. This data platform helps farmers advance their
environmental stewardship acre-by-acre and see the financial WE REACHED OUR 70,000-ACRE
return on their sustainability investments. It also creates a
framework for continuous improvement while benchmarking
FERTILIZER OPTIMIZATION GOAL
against yield and profitability ONE YEAR EARLY.
to ensure specific and
scalable on-farm solutions
that benefit both natural Another key milestone in FY2020 was the release of results
resources and the farmer. from year two of the program, enabling us to draw insights from
year-on-year data for the Chesapeake Bay area. Among other
Additionally, the Truterra things, we learned that participating acres were, on average,
partnership leverages the GHG emissions-neutral, and that nitrogen-use efficiency and
nationwide network of Land soil erosion reduction improved between 2018 and 2019. Jason
O’Lakes’ agricultural retailers. Weller, Vice President of Truterra, LLC, conveyed the significance
As trusted advisors to farmers, of these results: “These data help to provide proof of concept
these retailers are ideally for farmer-led, and ag retailer-supported, stewardship efforts.”
positioned to deploy the
Truterra™ Insights Engine, Powered by these data, we continue to make progress to
deliver expert advice on each enhance farm stewardship, productivity and resiliency. Truterra
field and facilitate flows of and the National Fish and Wildlife Foundation have also formed
information between farmers a partnership that will integrate conservation agronomy
and other partners in the wheat specialists into the services at Heritage Cooperative in Ohio. In
value chain. In 2017, we the Chesapeake Bay region, The Mills’ agronomists also
launched the first phase of our collaborate with a local Pheasants Forever Biologist, a resource
wheat sustainability program funded in the 2018 Farm Bill. The ultimate goal of these efforts:
in the Chesapeake Bay water- to equip wheat farmers with new best-in-class tools to help
shed area of Maryland and protect air, land and water – and the economic health of their
Pennsylvania. Here, Truterra farms – while supporting sustainability across the supply chain.
25GROWN // STORIES OF PROGRESS
WHEN IT COMES TO TOMATOES, WE’RE FAMILY
The most notable strengths of our tomato supply chain relate to Sustainability doesn’t just stop at the edge of the tomato field.
our partnership with our tomato farmers. Two key aspects are It is also embedded throughout our plant operations. Over
the proximity of the family-owned farms we work with – many 80% of the tomatoes that go into Campbell products come
within just five miles of our processing plants – and the close from our two tomato processing plants in California at Dixon
and long-term relationships we enjoy with our tomato farmers, and Stockton. Acquired in 1976, these two plants serve as an
some of them working with us since the 1940s. important step in our tomatoes’ journey as they ultimately make
their way into over 60 million households across the United
WE WORK WITH Working closely with these States every year. And there is not a single part of the tomato
farmers and seed compa- that is wasted in the process. The tomato ingredients are
APPROXIMATELY 50 nies each year, we select crafted via Campbell’s proprietary methods specifically for use
TOMATO GROWERS tomato varieties that have in our high-quality product recipes.
TODAY, MOST higher initial “tomato solids”
OF WHOM HAVE content (sugars, minerals, The people at our plants have their own personal stories, rich
proteins, etc.). This helps to with appreciation for Campbell, their work and the familial
BEEN PARTNERS reduce the amount of en- bonds they have established over decades. The average
OF CAMPBELL ergy required to evaporate length of employment at our tomato plants is 20 years, but
FOR MORE THAN the water out of them to some workers have been working at the plants for over 40
25 YEARS. create tomato paste. In the years. Three Dixon, California, plant employees – Rosalio,
fields, farmers increasingly Eugenia and Sara – have been there since 1975, when the
adopt drip irrigation, which plant opened. Our operations manager started at the plant
helps save water, and regularly test soil samples to optimize when he was 18 years old as a mechanic, and one of our top
fertilizer use. For years, we have worked with growers individu- mechanics began his career years ago as a sorter on the line.
ally to embed sustainability into field management, while using And it goes on. These are the stories that make us proud –
data to inform best practices. and help us live up to our Real Food Philosophy, one tomato
at a time.
Campbell tomatoes are generally processed within eight hours of being harvested,
helping lock in nutrients and ensuring the tomatoes are preserved at peak ripeness.
Tomatoes are mechanically
harvested when fully ripe
Harvesters shake the
tomatoes off cut vines
Within eight hours or less
of being picked, they are at
our facilities being turned
They are sorted and loaded into paste or diced tomato
The paste or diced tomato is
into trucks
stored until it is time for our
plants to make soups, sauces,
salsas and juices
26You can also read