Satellite normalized difference vegetation index data used in managing Australian plague locusts
←
→
Page content transcription
If your browser does not render page correctly, please read the page content below
Satellite normalized difference
                vegetation index data used in managing
                Australian plague locusts

                Edward D. Deveson

Downloaded From: https://www.spiedigitallibrary.org/journals/Journal-of-Applied-Remote-Sensing on 11 Dec 2021
Terms of Use: https://www.spiedigitallibrary.org/terms-of-use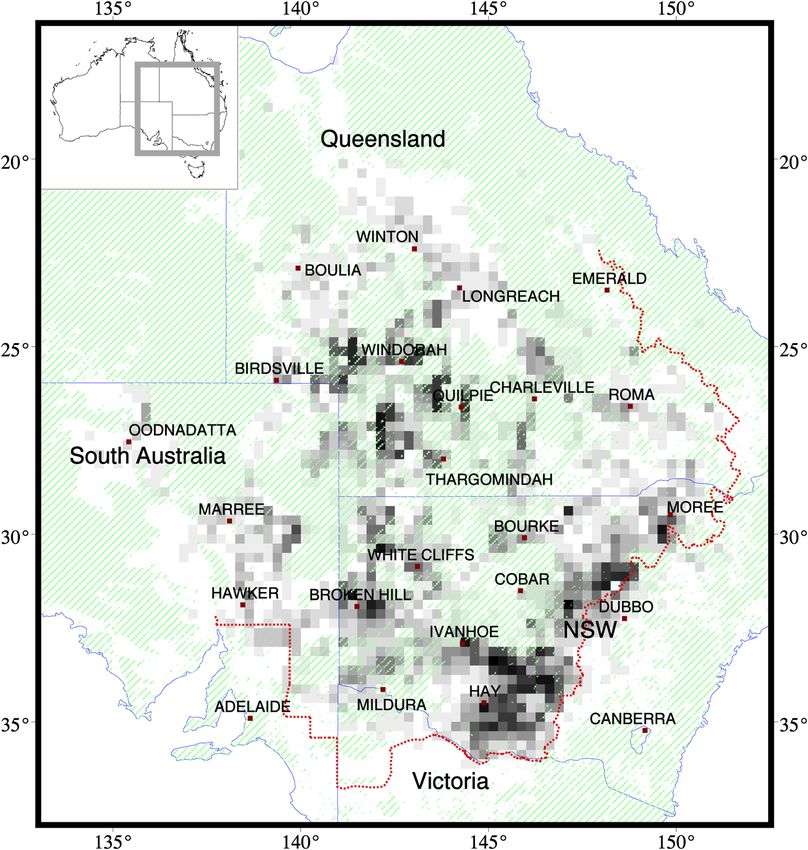
Satellite normalized difference vegetation index data
                                          used in managing Australian plague locusts

                                                                          Edward D. Devesona,b
                                  a
                                      Australian Plague Locust Commission, Australian Government Department of Agriculture,
                                                 Fisheries and Forestry, GPO Box 858, Canberra, ACT 2601, Australia
                                                                        Ted.deveson@daff.gov.au
                                       b
                                         Australian National University, Fenner School of Environment and Society, College of
                                                  Medicine, Biology and Environment, Canberra, ACT 0200, Australia

                                 Abstract. The Australian Plague Locust Commission (APLC) has a mandated role in monitor-
                                 ing, forecasting, and managing populations of key locust species across four Australian states.
                                 Satellite normalized difference vegetation index (NDVI) imagery is used to monitor vegetation
                                 condition in locust habitat and is integrated with mapping software to support forecasting and
                                 operations within the strategic framework of APLC activities. The usefulness of NDVI data for
                                 monitoring locust habitats is tested using historical control and survey records for the Australian
                                 plague locust, Chortoicetes terminifera (Walker). In arid habitat areas, control of high-density
                                 nymphal populations was consistently associated with high and increased relative NDVI during
                                 summer and autumn, providing important information for locating possible infestations.
                                 Regression models of NDVI data and regional biogeographic factors were fitted to summer
                                 survey records of C. terminifera presence and abundance. Models identified increased vegetation
                                 greenness, measured by a one-month positive change in NDVI, as having a significant positive
                                 relationship with nymph distributions, while NDVI was significant in adult distributions.
                                 Seasonal rainfall regions and a binary habitat stratification were significant explanatory factors
                                 in all models. © The Authors. Published by SPIE under a Creative Commons Attribution 3.0 Unported
                                 License. Distribution or reproduction of this work in whole or in part requires full attribution of the origi-
                                 nal publication, including its DOI. [DOI: 10.1117/1.JRS.7.075096]
                                 Keywords: National Oeanic and Atmospheric Administration normalized difference vegetation
                                 index; remote sensing; locusts; Australian plague locust; Chortoicetes terminifera; generalized
                                 linear models.
                                 Paper 13099SS received Mar. 31, 2013; revised manuscript received May 24, 2013; accepted for
                                 publication May 30, 2013; published online Jul. 10, 2013.

                                 1 Introduction
                                 The Australian Plague Locust Commission (APLC) is responsible for the monitoring of locust
                                 populations across 2 million km2 , covering the inland areas of four states in eastern Australia,
                                 and for strategic management of those that could pose an interstate migration threat to agricul-
                                 ture. The management of the three locust species under the APLC charter1—the Australian
                                 plague locust, Chortoicetes terminifera (Walker), the spur-throated locust, Austracris guttulosa
                                 (Walker), and the migratory locust, Locusta migratoria (L.)—relies on strategic population inter-
                                 vention through the detection and the aerial insecticide treatment of nymphal bands or adult
                                 swarms early in breeding sequences that potentially lead to plagues.2
                                     C. terminifera is the most common and widespread locust pest of agriculture in the eastern
                                 states of Australia and regional infestations are frequent. Major infestations or plagues, affecting
                                 numerous regions across several states, occur irregularly and usually last 1 or 2 years.3 Plagues
                                 result from several consecutive generations of successful breeding and rapid population increase,
                                 often linked by long-distance migrations to different regions. Impacts on agricultural crops
                                 usually occur in autumn or spring, coinciding with winter grain crop establishment and matu-
                                 ration, and can result in significant economic losses.4,5 Swarm outbreaks of A. guttulosa and
                                 L. migratoria are less common and agricultural impacts have been largely restricted to
                                 Queensland and northern New South Wales (NSW).

                                 Journal of Applied Remote Sensing                    075096-1                                    Vol. 7, 2013

Downloaded From: https://www.spiedigitallibrary.org/journals/Journal-of-Applied-Remote-Sensing on 11 Dec 2021
Terms of Use: https://www.spiedigitallibrary.org/terms-of-use
Deveson: Satellite normalized difference vegetation index data used in managing Australian plague locusts

                                     Managing locust populations within APLC member states relies on ground surveillance
                                 monitoring of population distribution and age structures across a large area of inland
                                 Queensland, NSW, South Australia, and Victoria. This provides continuous field data for pro-
                                 ducing forecasts of likely population developments, based upon the species phenology, behavior
                                 and measurable environmental correlates of population outcomes. It also gives direct identifi-
                                 cation of high-density populations that pose an immediate or potential subsequent threat to inter-
                                 state agriculture, therefore warranting control intervention.
                                     The principal known environmental factor associated with C. terminifera and A. guttulosa
                                 population increase is the distribution, amount and sequence of rainfall in areas of locust hab-
                                 itat,6–8 which can produce soil and vegetation conditions that favor egg maturation, oviposition
                                 and nymphal survival.9,10 Monitoring of inland rainfall and the direct measurement of vegeta-
                                 tion response through satellite normalized difference vegetation index (NDVI) images are
                                 therefore logical primary environmental data requirements for identifying the location and
                                 likely timing of possible breeding events. For these species, long-distance migrations also
                                 play an important role in population dynamics, often producing major redistributions over
                                 wide areas.11–14 Remote sensing data from insect monitoring radar15–17 observations are used
                                 to analyze migrations and, along with atmospheric circulation model data, are used to simulate
                                 migration displacements.
                                     This paper deals with the use of satellite remote sensing applied to the monitoring and man-
                                 agement of C. terminifera. Section 2 provides background biological information and a review
                                 of global and APLC uses of satellite remote sensing (RS) data, principally NDVI images, as a
                                 means of improving the detection of areas where high-density locust breeding is likely to have
                                 occurred. Section 3 presents research addressing the value of NDVI image data, in particular a
                                 relative index of NDVI for identifying potential locations of higher density C. terminifera
                                 activity leading to infestations. The relationship of locust distribution with NDVI, both
                                 for the probability of occurrence and as an indicator of habitat conditions suitable for
                                 high density population development, is tested using historical data on locust control and
                                 surveillance.

                                 2 Australian Locusts and Satellite Remote Sensing

                                 2.1 Australian Plague Locust
                                 The APLC has been responsible for managing C. terminifera since its inception in 1975, whereas
                                 L. migratoria and A. guttulosa were included under its charter in 1987.18 The monotypic
                                 C. terminifera is endemic and widely distributed on the Australian mainland. Together with
                                 the related genus Austroicetes, it forms a distinct phylogenetic clade within the acridid subfam-
                                 ily, Oedipodinae.19 C. terminifera is a “model” locust in exhibiting behavioral phase polyphen-
                                 ism at both nymph and adult stages,20 which, because of its consequences for abundance and
                                 behavior, has contributed to its status as a serious agricultural pest.
                                      C. terminifera population dynamics are irruptive and are understood to be driven by habitat
                                 productivity during periods of rapid population increase. This is primarily determined by rainfall
                                 which, in inland environments with highly variable rainfall, produces a short-lived flush of
                                 ground vegetation, although this pattern varies with season, region, vegetation composition,
                                 and rainfall amount. The primary habitat of C. terminifera is open tussock grassland and grassy
                                 open woodland; vegetation formations that cover ∼1 million km2 in eastern Australia and a
                                 similar area in the western half of the country. Most of the habitat is climatically arid and semi-
                                 arid although it extends into natural and Euro-anthropogenic grasslands in the southern and
                                 eastern parts of the species range.
                                      C. terminifera generally completes three generations annually in areas north of 32°S and two
                                 in the southern part of the distribution area. Infestations can develop from sparse initial pop-
                                 ulations in a single year, following two to three generations of high recruitment.21 A feature
                                 of C. terminifera ecology is frequent nocturnal, high altitude, wind-assisted adult migrations
                                 with overnight displacements of several hundred kilometers.11–14,22 Interseasonal or interannual
                                 prediction of population outbreak location is therefore complicated by rapid population fluxes

                                 Journal of Applied Remote Sensing                    075096-2                                Vol. 7, 2013

Downloaded From: https://www.spiedigitallibrary.org/journals/Journal-of-Applied-Remote-Sensing on 11 Dec 2021
Terms of Use: https://www.spiedigitallibrary.org/terms-of-use
Deveson: Satellite normalized difference vegetation index data used in managing Australian plague locusts
resulting from migrations. It also displays a dormancy syndrome of facultative egg and nymph
diapause during winter and egg quiescence in dry soils.23,24 Development rate of nondormant life
stages is a function of temperature although nymphs and adults behaviorally regulate body tem-
perature by basking or seeking shade. Lifecycle turnover during summer can be as short as 60
days and nymphal stages can be completed inDeveson: Satellite normalized difference vegetation index data used in managing Australian plague locusts
environmental monitoring satellites.47,48 Processed images were used to estimate rainfall from
cloud-top temperatures and directly monitor vegetation condition.49 Even in the early 1990s,
there was a lag of several weeks in obtaining rainfall records and the reporting network in
the Australian arid zone remains sparse today. Image analysis was also investigated for discrimi-
nating possible oviposition sites using Landsat multispectral data.50,51 During the 1990s, the
increased availability of a range of weather data (daily rainfall and temperature observations)
and vegetation monitoring products (AVHRR NDVI) through the internet superseded the infor-
mation content of the APLC satellite system.
In 1998, regular, calibrated NOAA AVHRR imagery, processed at Australian ground sta-
tions, was made available to the APLC by the Australian Department of Environment and
Heritage.52 Images were composited on a 14-day series, with cloud masking based on large
NDVI differences between successive images. NDVI data were delivered as a rescaled index
designed to discriminate variation in ground layer vegetation, with current pixel NDVI value
above the previous dry season minimum (taken to represent the woody evergreen component
typical of Australian vegetation), calculated as a percentage of its historic range.53 From 2002 to
2009, APLC obtained AVHRR NDVI imagery directly from the Western Australian Department
of Land Administration (DOLA), making data available within 2 weeks at the end of the com-
positing period. A simplified relative index of NDVI values was adopted, recalculating current
pixel value as a percentage of its historical range (r-NDVI), allowing direct comparison between
all years.
2.4 Current APLC Application of Satellite NDVI Data
Image composite mosaics of 14-day Moderate Resolution Imaging Spectroradiometer (MODIS)
NDVI data from NASA Terra/Aqua satellites are supplied by Landgate (Western Australian Land
Information Authority) as scaled 8-bit files of positive integer pixel values. The NDVI is sensi-
tive to actively photosynthesizing vegetation amount, but small variations in values in low veg-
etation cover environments (where range in NDVI is small and historical maxima area 40 mm) during summer, the peak NDVI response in ground vegetation
occurs 3 to 5 weeks later.55,56 Given that high-density egg laying often occurs within a week of
rainfall,55 and the subsequent time to mid-instar stages during summer of 4 to 5 weeks, peak
Journal of Applied Remote Sensing 075096-4 Vol. 7, 2013
Downloaded From: https://www.spiedigitallibrary.org/journals/Journal-of-Applied-Remote-Sensing on 11 Dec 2021
Terms of Use: https://www.spiedigitallibrary.org/terms-of-useDeveson: Satellite normalized difference vegetation index data used in managing Australian plague locusts
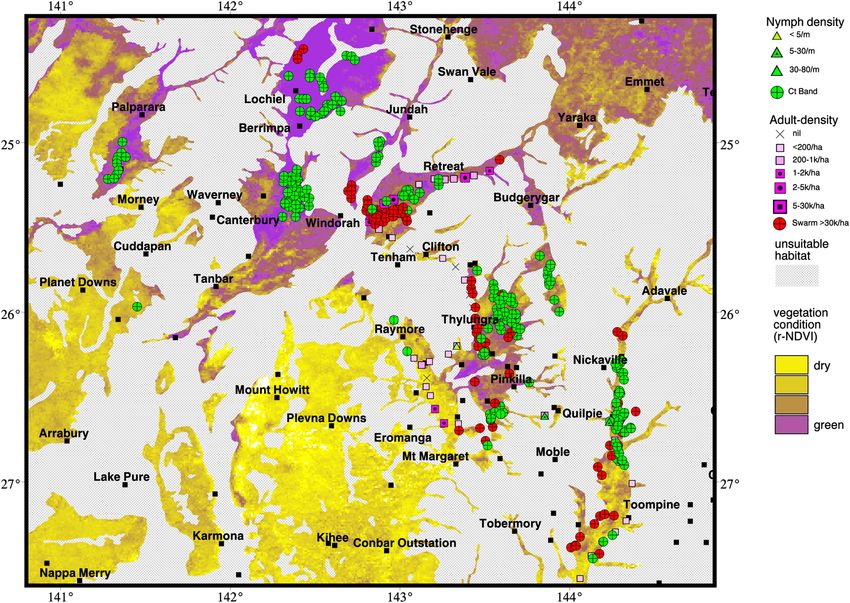
Fig. 1 Seasonal frequency of Chortoicetes terminifera infestation in eastern Australia, using
1986 to 2007 locust survey and control data, covering 65 season-generations gridded to
0.25 × 0.25 deg. Density threshold >30 m2 for nymphs, >5000∕ha for adults. Frequency graded
from white ¼ 0 to black ¼ 15 seasons. Areas hatched green are unsuitable habitat. APLC oper-
ations area boundary is shown in red.
NDVI response is likely to coincide with band development. Nymphal bands rarely move more
than 2 km during the entire duration of formation and their location is taken to be in habitat
suitable for oviposition (APLC unpublished data). Adult swarms can move through habitat
in any condition, although control of swarms has often been carried out in areas of nymphal
infestations following fledging.
The indication from observations (e.g., Fig. 2) that high-density nymphs often occur
in habitat areas during the time that vegetation response is detectable with NDVI imagery was
tested using historical C. terminifera control and surveillance data. Control data were analyzed
by comparison of monthly NDVI trends using grouping factors of seasonal rainfall, bioregion,
and landuse. Locust records from survey presented response variables for regression against
NDVI variates and grouping factors. Complementary models dealing with presence or absence
and density data separately were used to account for zero inflation in the survey data.
3.1 Data Sources
Control data for nymph (bands) and adult (swarm) are observations that represent only locations
of gregarious very high locust densities because insects are dense enough to be seen from the air.
The APLC aerial control of bands generally occurs during instar stages 3 to 5. Surveillance data
are obtained by APLC staff on regular vehicle surveys, using GPS-connected palmtop com-
puters. Data are records of density classes for each lifestage based on counts from 250-m
foot transects adjacent to roads, at intervals of ∼10 km. Surveys regularly sample most
known habitat areas and include sampling in landscapes generally unsuitable for locust breeding.
Journal of Applied Remote Sensing 075096-5 Vol. 7, 2013
Downloaded From: https://www.spiedigitallibrary.org/journals/Journal-of-Applied-Remote-Sensing on 11 Dec 2021
Terms of Use: https://www.spiedigitallibrary.org/terms-of-useDeveson: Satellite normalized difference vegetation index data used in managing Australian plague locusts
Fig. 2 Example of NDVI image for February 2004 displayed as relative NDVI (r-NDVI), with non-
habitat areas masked gray, showing APLC survey and control data for February 2004.
Monthly maximum NDVI and r-NDVI ArcInfo grids at ∼1 km resolution were generated
from an 18-year sequence (April 1991 to May 2009) of 14-day composite NOAA AVHRR
imagery.52 The data generation methods are given in the Appendix. NDVI and r-NDVI values
for the month of control and two previous months, along with values for a bioregional classi-
fication57,58 and gridded land use data,59 were calculated for point locations of all locust control
events for this period. A one-month change in r-NDVI was calculated by subtracting previous
month values from those in the month of observation. Control locations within bioregions were
grouped by seasonal rainfall characteristics into arid (Deveson: Satellite normalized difference vegetation index data used in managing Australian plague locusts
°E °E °E °E
Legend
APLC control
SEASON
Normanton
Spring (Sep-Nov)
Summer (Dec-Feb)
Autumn (Mar-May)
Tennant Creek uniform-winter maximum
°S arid °S
Hughenden summer maximum
Urandangi
Boulia
Longreach Emerald
Alice Springs
°S °S
Birdsville
Quilpie Roma
Oodnadatta
St George
Marree
°S Bourke °S
Narrabri
Hawker Broken Hill
Dubbo
Yunta
Ivanhoe
Sydney
Mildura
Hay
Adelaide
°S Canberra °S
°E °E °E °E
Fig. 3 Map of APLC Chortoicetes terminifera control locations (October 1991 to April 2009) by
season, showing seasonal rainfall regions. White areas represent habitats mostly unsuitable for
locust breeding.
control in areas classed as having different land use is shown in Table 2. Results for maximal
regression models of presence or absence of locusts from survey data are given in Table 3 and
results for density categories are given in Table 4.
Seasonal and regional variations in the NDVI trends for control result from both the genera-
tional phenology and predominant locations of high-density populations. In the arid and summer
rainfall regions, nymph control during summer and autumn regularly occurred in areas with high
and significantly increased monthly r-NDVI values from the previous month. Swarm control
generally occurred when NDVI was declining, but there was a positive association in the
arid region during summer months (Figs. 5 and 6).
Control events during spring generally took place where NDVI values had declined, con-
sistent with the predominance of control during September to November in the southern tem-
perate region [Fig. 4(a) and 4(b)]. NDVI trend was reversed in summer, when both nymph and
adult control during each month (December to February) in the arid and summer rainfall regions
occurred following increases in NDVI (Figs. 5 and 6). December presents a transitional response
pattern in those regions (Fig. 5) with increased NDVI at second generation nymph control loca-
tions. For swarms, there was an increase in NDVI in the arid region and a decrease in the summer
rainfall region, where most swarms were fledged from spring nymphs in northern NSW.
Journal of Applied Remote Sensing 075096-7 Vol. 7, 2013
Downloaded From: https://www.spiedigitallibrary.org/journals/Journal-of-Applied-Remote-Sensing on 11 Dec 2021
Terms of Use: https://www.spiedigitallibrary.org/terms-of-useTable 1 Relative NDVI (r-NDVI) values at APLC nymph and adult control locations (October 1991 to April 2009) by rainfall region in each month. Mean and standard error are
shown for monthly values at time of control events and change from month previous to control. Significance levels of change for angular transformed values (paired t -test
p < 0.001, p < 0.05). Missing values indicate insufficient numbers for testing.
Rainfall regions
Arid (1) Uniform/winter (2) Summer (3)
Terms of Use: https://www.spiedigitallibrary.org/terms-of-use
Month r-NDVI
Nymph Adult Nymph Adult Nymph Adult
October Mean 55.16 1.14 45.61 4.30 59.58 0.55 — 42.86 1.28 51.52 1.73
Journal of Applied Remote Sensing
Change 6.35 1.14 −2.33 1.27 −8.49 0.57 — 23.37 0.99 −19.59 2.24
November Mean 36.28 0.51 43.82 1.14 41.31 0.56 35.25 0.67 — 25.04 0.69
Change −20.5 1.94 −13.04 0.92 −27.80 0.49 −25.25 0.68 — −30.38 1.04
December Mean 56.75 1.92 55.34 2.27 45.17 3.24 26.47 0.64 43.45 1.67 19.25 1.36
075096-8
Change 20.39 1.54 19.57 1.71 9.00 6.53 −24.26 1.24 22.92 2.25 −16.07 5.27
January Mean 68.32 0.85 62.12 2.08 38.64 1.11 41.75 3.91 48.07 0.99 44.50 2.34
Change 27.08 0.66 5.84 2.34 9.99 0.92 3.37 4.29 17.38 1.25 16.72 1.90
Downloaded From: https://www.spiedigitallibrary.org/journals/Journal-of-Applied-Remote-Sensing on 11 Dec 2021
February Mean 64.41 2.68 51.02 1.37 — 35.63 0.67 18.07 3.38 40.91 0.94
Change 44.24 3.37 6.02 1.21 — 3.90 0.78 0.93 2.45 −6.94 1.12
March Mean 77.27 1.18 55.98 0.92 73.87 1.53 28.44 0.88 51.58 1.18 33.39 2.50
Change 22.56 1.04 −10.22 0.90 22.2 1.16 −6.49 0.58 10.05 1.84 15.22 2.12
April Mean 87.13 1.75 60.76 1.67 64.91 2.02 68.13 6.17 48.00 2.57 28.02 1.40
Change 35.66 2.97 3.67 1.72 −2.00 1.32 19.36 6.52 −14.57 2.35 −18.91 1.81
Deveson: Satellite normalized difference vegetation index data used in managing Australian plague locusts
Vol. 7, 2013Deveson: Satellite normalized difference vegetation index data used in managing Australian plague locusts
Fig. 4 Seasonal trends in r-NDVI for nymph (band) and adult (swarm) control (1991 to 2009),
showing median, interquartile range, and data range (maximum monthly r-NDVI) at control
and 2 previous months (previous, prev_2). Seasons—(a, b) spring (September to November),
(c, d) summer (December to February) and (e, f) autumn (March to May).
The pattern of significant increases to high r-NDVI levels for nymph control in the arid region
continued during autumn months (Fig. 7). For bands controlled during March and April, r-NDVI
mean values were 77.27% and 87.13%, representing increases of 22% and 35% over the previous
month (Table 1). In the uniform-winter rainfall region during March, band control showed a
significant increase to 73.87% of r-NDVI, an exception to the variation in other months.
Journal of Applied Remote Sensing 075096-9 Vol. 7, 2013
Downloaded From: https://www.spiedigitallibrary.org/journals/Journal-of-Applied-Remote-Sensing on 11 Dec 2021
Terms of Use: https://www.spiedigitallibrary.org/terms-of-useDeveson: Satellite normalized difference vegetation index data used in managing Australian plague locusts
Fig. 5 Comparison of r-NDVI and NDVI values for December control and previous month (1991–
2008). Nymph (band) control (a, b) by region (1-arid, 3-summer rainfall) and adult (swarm) control
(c, d) by region (1, 2-uniform-winter maximum). Plots show median, interquartile range, and data
range for maximum monthly r-NDVI (a, c) and NDVI (b, d).
Nymphs at this time often represent a third generation, the initiation and survival of which are
linked to green conditions produced by unseasonal heavy rainfall.
Results from modeling survey data show that a 1-month change in r-NDVI had a significant
positive relationship both with the presence of nymphs and with nymph density. The order of
mean deviance in significant fitted terms for both nymph models was a 1-month change in
r-NDVI (r-DIFF in Tables 3 and 4), region, habitat and r-NDVI, with all terms significant at the
p < 0.001 level. The negative regression coefficient for r-NDVI (−0.004) in both nymph models
is an order of magnitude smaller than the effect of the change variate (r-DIFF). In contrast, the
full fitted models for adult presence or absence and density showed a reversal in the order of
significant terms, with r-NDVI coefficient remaining significant at the p < 0.001 level, but
r-DIFF not significant (presence–absence p ¼ 0.038, density p ¼ 0.845).
In the full models of presence or absence, habitat stratification was a significant explanatory
term (p < 0.001). The negative coefficients for the factor of non-habitat in all models, relative to
habitat as a reference level, indicate the importance of habitat in C. terminifera distributions.
Mean predictions for factors show that nymphs are detected far more frequently in mapped hab-
itat (0.066 0.002 for habitat and 0.020 0.002 for non-habitat) and this pattern was main-
tained in all regions. For adults, the predictions for the factor habitat were much closer
(0.477 0.004 for habitat and 0.366 0.007 for non-habitat). Accumulated deviances for
ordinal regression of nymph density categories (estimated dispersion 2.17) reduced the signifi-
cance of habitat to 0.051 (Table 3) suggesting that, despite 90.3% of bands occurring within
mapped habitat, the factor did not discriminate between density levels.
An alternative ordinal regression for nymph density, fitting only habitat and r-NDVI pro-
duced a positive coefficient (0.029 0.004, p < 0.001), close to that for r-DIFF in the full fitted
model, suggesting that the two correlated NDVI variables separately yield significant regres-
sions. Comparison of 1-month change values of r-NDVI with NDVI for nymph data showed
Journal of Applied Remote Sensing 075096-10 Vol. 7, 2013
Downloaded From: https://www.spiedigitallibrary.org/journals/Journal-of-Applied-Remote-Sensing on 11 Dec 2021
Terms of Use: https://www.spiedigitallibrary.org/terms-of-useDeveson: Satellite normalized difference vegetation index data used in managing Australian plague locusts
Fig. 6 Comparison of r-NDVI and NDVI values for February control and previous month (1992–
2009). Nymph (band) control (a, b) and adult (swarm) control (c, d) by region (1-arid,3-summer
rainfall). Plots show median, interquartile range, and data range for maximum monthly r-NDVI (a,c)
and NDVI (b, d).
higher mean deviance for r-NDVI, both for single-term models with these variates (presence or
absence—r-NDVI 423.81, NDVI 168.59; density—r-NDVI 201.57, NDVI 128.03) and full-
fitted models (all significant at the p < 0.001 level).
5 Discussion
The consistent association of control during spring with declining NDVI occurred because most
control was in southern, winter-dominant rainfall areas, and nymphs arise from oviposition dur-
ing the previous autumn. Nymphal development therefore usually takes place during the sen-
escence of ephemeral pasture vegetation following winter–spring rainfall. Most control of
swarms during spring occurs after the fledging of nymphs in the same regions and is therefore
associated with further declines in NDVI.
Regional variation in the pattern of r-NDVI associated with control, for nymphs in particular,
results from different seasonal rainfall patterns and the dependence in arid areas on irregular
significant rainfall to initiate breeding sequences. Given the very high rainfall variability char-
acteristic of arid areas, ground vegetation often remains dry for periods of several months before
storms produce brief growth responses and associated population increases. For nymph control
in the arid region during the months December to April, mean r-NDVI values were high (56.75%
to 87.13%), with significant increases over the previous month of 20% to 44% (Table 1). In
contrast, mean r-NDVI in locust habitat during summer from survey data was 36.45 0.02.
Band control occurred at 100% of r-NDVI in numerous locations in each of these months.
The 2-month lag changes in r-NDVI only show a sustained increase during autumn months
(Fig. 4). This increase in all regions 2 months prior to control of both nymphs and adults prob-
ably reflects breeding initiated by significant late summer rainfall and slower locust develop-
ment rates.
Journal of Applied Remote Sensing 075096-11 Vol. 7, 2013
Downloaded From: https://www.spiedigitallibrary.org/journals/Journal-of-Applied-Remote-Sensing on 11 Dec 2021
Terms of Use: https://www.spiedigitallibrary.org/terms-of-useDeveson: Satellite normalized difference vegetation index data used in managing Australian plague locusts
Fig. 7 Comparison of r-NDVI and NDVI values for April control and previous month (1992–2009).
Nymph (band) control (a, b) and adult (swarm) control (c, d) by region (1-arid,3-summer rainfall).
Plots show median, interquartile range, and data range for maximum monthly r-NDVI (a, c) and
NDVI (b, d).
Dry land cereal and irrigation cropping occur largely in the uniform-winter and summer rain-
fall regions. Differences in r-NDVI between areas subject to cropping and pastoral land use were
compared to nymph and adult control. The higher range of NDVI values due to both bare ground
and dense crop at different times results in lower r-NDVI values in cropped areas. There were
significantly higher r-NDVI values in pastoral land use for band control in all seasons in the
summer rainfall region, but this effect was only detectable in the uniform winter rainfall region
during summer (Table 2).
Comparison of r-NDVI and NDVI discrimination of vegetation change is shown for repre-
sentative months in Figs. 5–7. Median NDVI values for arid region nymph control during
December and February were 40%. In December, the median r-NDVI
value for band control in the arid region was higher than that in the summer rainfall region
[Fig. 5(a) and 5(b)], but NDVI value significantly lower. This applies also in April, which
presents an extreme example of a 1-month increase to a median of 90% of r-NDVI.
Models applied to survey data showed generally low regression coefficients for significant
NDVI variates, reflecting the high random variance produced by the sporadic presence of
nymphs and more ubiquitous presence of adults. Nymph models did not take into account
the development stage or the observation day, which may also have affected the NDVI coef-
ficients. Models applied to survey data are a compromise to deal with zero inflation and cat-
egorical density classes, so the results are presented as indicative of the influence of NDVI,
habitat, and regional differences in locust distributions. However, a 1-month change in r-NDVI,
habitat, region, and r-NDVI were consistently significant in regressions for nymph data. For
adult data, change in r-NDVI is less significant than the other variables, supporting the results
from control data. Based on the known ecology and phenology of C. terminifera, the regressions
represent meaningful biological effects.
Journal of Applied Remote Sensing 075096-12 Vol. 7, 2013
Downloaded From: https://www.spiedigitallibrary.org/journals/Journal-of-Applied-Remote-Sensing on 11 Dec 2021
Terms of Use: https://www.spiedigitallibrary.org/terms-of-useDeveson: Satellite normalized difference vegetation index data used in managing Australian plague locusts
Table 2 Relative NDVI (r-NDVI) values by season and rainfall region at APLC nymph and adult
control locations (October 1991 to April 2009) in different land use categories. Land use (0.25 deg
gridded data, classed as pasture (grazing on native or improved pastures) or cropped (subject to
dry land copping or irrigation in 1998, 2000, or 2006). Mean and standard error are shown at month
of control, t statistic and significance values shown for two-sample t -tests with unequal variance
on angular transformed maximum monthly r-NDVI values.
Rainfall regions
Uniform/winter (2) Summer (3)
Season Land use Nymph Adult Nymph Adult
n(mean) n(mean) n(mean) n(mean)
Spring Pasture 775ð51.29 0.59Þ 188ð38.47 1.03Þ 117ð39.87 1.44Þ 126ð28.71 1.04Þ
Cropped 322ð51.16 0.88Þ 205ð32.30 1.02Þ 71ð47.77 2.35Þ 99ð27.59 1.46Þ
t-test ns t ¼ 4.25, p < 0.001 t ¼ −2.97, p ¼ 0.004 ns
Summer Pasture 136ð39.24 1.08Þ 337ð31.96 0.91Þ 173ð49.62 1.36Þ 205ð41.97 1.08Þ
Cropped 14ð37.79 3.85Þ 143ð27.64 0.87Þ 163ð42.27 1.13Þ 78ð38.26 1.87Þ
t-test ns t ¼ 3.96, p < 0.001 t ¼ 3.95, p < 0.001 ns
Autumn Pasture 19ð67.11 2.12Þ 149ð31.73 1.51Þ 100ð53.23 1.87Þ 52ð30.38 1.52Þ
Cropped 4ð56.75 2.36Þ 59ð30.20 1.59Þ 36ð44.00 2.15Þ 16ð28.06 2.33Þ
t-test t ¼ 0.73, p ¼ 0.47 t ¼ 3.37, p < 0.001 t ¼ 0.76, p ¼ 0.46
Table 3 General linear models fitted to Chortoicetes terminifera nymph and adult data from APLC
surveys, summer 1998 to 2009. Factor reference levels—habitat 1, region 1 (arid). Model variates
r-DIFF (r-NDVI change from previous month), r-NDVI and factors (habitat 1, nonhabitat 0; rainfall
regions (arid 1, uniform-winter 2, summer 3). Regression coefficients (estimate) and significance
level (t probability). Significance levels of deviance (chi probability).
Nymph presence/absence Adult presence/absence
Estimate Standard error t pr. Estimate Standard error t pr.
Constant −2.463 0.081Deveson: Satellite normalized difference vegetation index data used in managing Australian plague locusts
Table 4 Ordinal regression models (logit link, dispersion estimated) fitted to Chortoicetes termi-
nifera data from APLC surveys for summer 1998 to 2009. Factor reference levels—Habitat 1,
Region 1 (arid). Model variates r-DIFF (r-NDVI change from previous month), r-NDVI and factors
(habitat 1, non-habitat 0; rainfall regions (arid 1, uniform-winter 2, summer 3). Regression coef-
ficients (estimate) and significance levels (t probability). Significance levels of deviance (F
probability).
Nymph density (4 classes) Adult density (6 classes)
Estimate s.e. t pr. Estimate s.e. t pr.
r-DIFF 0.029 0.005Deveson: Satellite normalized difference vegetation index data used in managing Australian plague locusts
surface features. There are limitations to r-NDVI in areas with very sparse ground vegetation,
where the range of NDVI values is so small that any change can result in high r-NDVI.
Although rainfall data are available within a day of recording, allowing for immediate logistic
planning, the reporting network in the arid zone remains sparse. In addition, heavy storm rainfall
often produces temporary flood-out areas, which can extend areas of vegetation growth many
kilometers beyond rain areas. Flooding of inland rivers produces subsequent flood plain and
drainage-line vegetation, hundreds of kilometers downstream and many weeks after rainfall
events. As a direct measurement of vegetation, NDVI is independent of these factors.
Increases in NDVI, and in particular the discrimination available in r-NDVI, are most relevant
for locating nymphal populations in the arid parts of C. terminifera habitat. These are the areas
where large pastoral holdings mean that landholder reporting is often limited and where ground
surveillance requires logistic and resource planning. Access to fortnightly image data allows the
identification of early vegetation response, providing time for planning and direction of ground
surveillance prior to late instar stages when control is usually conducted.
Interpretation of imagery can be complicated by differences in vegetation type and seasonal
response even within locust habitats. In cropped or irrigated areas, for example, the NDVI
response is primarily driven by crop phenology and fallow regimes, more than by rainfall
response, and the range in data values is high compared to grasslands. Some woody vegetation
formations (e.g., mallee), as well as ephemeral forbs in sparse arid ground cover, produce shoot
growth in late winter, whereas others respond to summer rainfall. Information on vegetation and
habitat type is therefore important for interpretation of NDVI. Models using C. terminifera sur-
vey data also support the applicability of the interim map of locust habitat as a useful stratifi-
cation of vegetation/soil types less likely to support locust breeding.
The timing of C. terminifera control coincides generally with a peak in vegetation response
and NDVI values in various locust habitats. Although the control data used to demonstrate this
association are subject to spatial dependence in the timing and location of events, this reflects the
localized nature of gregarious population development. These effects were not modeled in the
data presented here and produce inflated significance values, but p < 0.001 values would likely
remain significant at p < 0.5 level with fewer degrees of freedom.
Statistical analysis of the survey data provides support for the relevance of NDVI indicated
for control data. In particular, during summer, a 1-month change in r-NDVI has a significant
positive association with C. terminifera nymph distribution, but for adult distributions, r-NDVI is
more significant in regressions. Results show that habitat and regions based on seasonal rainfall
are significant factors in distributions of both nymphs and adults.
At present, the use of r-NDVI and sequential change images provides a simple tool within a
GIS for visual assessment of vegetation condition and response. Given that the human–computer
interface with map displays remains a primary site of interpreting forecasting information,
r-NDVI increases discrimination of vegetation condition and change because of the amplifica-
tion of variations that occur within a small range of NDVI values. The data analyses also provide
useful information for the interpretation of regional and seasonal variations in NDVI relative to
possible C. terminifera occurrence. Other relativized NDVI indices, such as monthly or seasonal
anomaly data, also enhance exceptional conditions, but usually introduce an extra layer of data
processing and interpretation.
Future research on various vegetation indices derived from NDVI or other sensors, such as
those used to decompose the herbaceous and evergreen-woody fractions from IR channel reflec-
tance in rangeland vegetation, could potentially improve both the discrimination of suitable hab-
itat and the herbaceous component in NDVI response to rainfall.60,61 The increased resolution
and overpass frequency of MODIS NDVI imagery allows detection of vegetation response along
minor drainage lines that are often the main sites of green vegetation in arid landscapes and also
short-lived responses to small rainfall amounts that provide crucial bridging food resources dur-
ing prolonged dry periods. The use of vegetation and soil moisture information from various
other sensors, as well as more detailed datasets on soil characteristics, present opportunities for
further research, potentially leading to predictive modeling of vegetation-locust outcomes, or of
suitable oviposition sites.
The relationship between NDVI and habitats of the other Australian locusts, or its potential
applications, has not been analyzed in detail. A. guttulosa does not form nymphal bands and
Journal of Applied Remote Sensing 075096-15 Vol. 7, 2013
Downloaded From: https://www.spiedigitallibrary.org/journals/Journal-of-Applied-Remote-Sensing on 11 Dec 2021
Terms of Use: https://www.spiedigitallibrary.org/terms-of-useDeveson: Satellite normalized difference vegetation index data used in managing Australian plague locusts
overwintering adult swarms generally inhabit forested areas. However, successful recruitment
and survival of nymphs have been associated with repeated rainfall in the Australian tropical
savannas,8 and egg development and abdominal fat content have been correlated with NDVI.62
NDVI could therefore offer a means of monitoring habitat favorability during summer. For
L. migratoria, gregarious population development is sporadic and often associated with summer
crops in Queensland. Ecological conditions that favor its population increase and gregarization
in Australia may operate on local scales not suited to synoptic NDVI imagery. The applicability
of r-NDVI for monitoring C. terminifera habitat is a consequence of the particular ecology of this
species and the nature of vegetation in arid and semiarid Australia, so may not be generally
applicable for species in other countries. For example, no close relationship was found between
AVHRR NDVI and historical data on high-density populations of S. gregaria and this may be a
consequence of the very low vegetation densities over much of the species range.63
Appendix
A1 NDVI Data Processing
An archived 14-day time-series of calibrated (following the method of Rao and Chen)64 AVHRR
NDVI image files for the period October 1991 to December 2001 (ERIN NDVI)52 and APLC
imagery from DOLA for January 2002 to May 2009 were converted to ArcInfo Grids (ArcInfo 8,
ESRI). Initial values in the range 249, representing cloud and non-vegetated pixels,
were recoded to 0 to allow extraction of maximum and minimum values. Previous comparison of
DOLA and ERIN NDVI data showed a maximum of 2.5% variation in corresponding values
between datasets and this effect was ignored.65 Historical maximum and minimum NDVI pixel
values were calculated over the entire 440 image series and used to generate an equivalent set of
14-day images with values as a proportion of the historically recorded range (r-NDVI). Images
were paired to match calendar months as closely as possible, and to minimize data loss due to
cloud and some gaps in imagery. Some 14-day compositing periods extended across months, but
the long time series is taken as reducing the influence of this effect. Monthly NDVI and r-NDVI
images were generated using the maximum NDVI value because the peak of sometimes
short-lived vegetation responses, rather than an averaged value, was the parameter of interest.
Integer NDVI values were recalculated to the original 0–1 terrestrial range using the formula
(ndvi−50)/200.
A2 Locust Data
All APLC C. terminifera control record locations (n ¼ 6319) for the 18-year period were used to
assign maximum NDVI and r-NDVI values for the same month and previous 2 months. Gridded
land use data for the years 1996, 1998, and 2005 (0.25 degree resolution, ABARES)59 were
combined to identify all areas classed as having irrigation or dry land cropping in any of
these years. The IBRA (5.1) bioregional classification was calculated for each control point
to provide a regional grouping based on climatic and ecological similarities. IBRA bioregions
were grouped by seasonal rainfall pattern into arid (2500) is based on count over the entire transect. The data classes approximate an expo-
nential series.
Journal of Applied Remote Sensing 075096-16 Vol. 7, 2013
Downloaded From: https://www.spiedigitallibrary.org/journals/Journal-of-Applied-Remote-Sensing on 11 Dec 2021
Terms of Use: https://www.spiedigitallibrary.org/terms-of-useDeveson: Satellite normalized difference vegetation index data used in managing Australian plague locusts
Summer survey data were analyzed because locusts are more likely to be produced in
response to recent rainfall and because unpredictable gregarization often occurs during summer.
For nymph occurrence, data were zero inflated (n ¼ 2247, 9.2% of extracted records), whereas
adults were present in 62.3%. Records where either of the NDVI variates was missing were
excluded, as were those with identical NDVI values for consecutive months, that was assumed
to result from the same image contributing to both maximum values.
A3 Modeling
Control data were analyzed by month of control on a regional basis to identify variations based
on the NDVI variates and regionalization factors using Genstat 15 (VSN Int.) statistical software.
Change in NDVI variates was calculated for the control event and previous 2 months and sum-
marized by comparison of mean values (Table 1). Significance of differences from 1-month lag
data was obtained from paired t-tests of mean differences after angular transformation of the
proportional values. Comparison of r-NDVI in areas with different land use was tested using
two-sample t-test of means with unequal variance.
Nymph and adult density data from survey records were reclassed as a binary presence/
absence variate and a GLM was fitted using a Bernoulli distribution (logit link function)
and a full model using r-NDVI variates and regionalization factors, with terms added iteratively.
Regression coefficients were derived with a fixed dispersion parameter of 1. Density data, with
nil counts removed, were fitted by an ordinal regression model (logit link) and estimated
dispersion parameters. This method was chosen because of the uneven numerical distances
between density categories. Exploratory models were fitted with each term iteratively, and then
full models using all terms were fitted to the regression with accumulated deviances calculated.
Acknowledgments
I thank Lucy Randall (ABARES) for the ERIN NDVI imagery from 1991 to 2001 and Lindsay
Penrose (ABARES) for statistical advice. Janet Stein (Fenner School, ANU) generated ANUCLIM
modeled mean annual rainfall data for control points. Bob Forrester, ANU Statistical Consulting
Unit, provided guidance on GLM techniques appropriate to locust survey data.
References
1. Australian Plague Locust Commission (APLC) Department of Agriculture, Fisheries and
Forestry—Australia, Annual Report 1999–2000, AGPS, Canberra (2003).
2. D. M. Hunter, “Advances in the control of locusts (Orthoptera:Acrididae) in eastern
Australia: from crop protection to preventative control,” Aust. J. Entomol. 43(3), 293–303
(2004), http://dx.doi.org/10.1111/aen.2004.43.issue-3.
3. R. A. Farrow, “Population dynamics of the Australian plague locust, Chortoicetes termi-
nifera (Walker) in Central Western New South Wales III*. Analysis of population proc-
esses,” Aust. J. Zool. 30(4), 569–579 (1982), http://dx.doi.org/10.1071/ZO9820569.
4. D. E. Wright, “Economic assessment of actual and potential damage to crops caused by
the 1984 locust plague in south-eastern Australia,” J. Environ. Manage. 23, 293–308 (1986).
5. D. A. H. Murray, M. B. Clarke, and D. A. Ronning, “Estimating invertebrate pest losses in
six major Australian grain crops,” Aust. J. Entomol., in press (2013).
6. D.P. Clark, “The influence of rainfall on the densities of adult Chortoicetes terminifera
(Walker), in central western New South Wales, 1969–73,” Aust. J. Zool. 22(3), 365–386
(1974), http://dx.doi.org/10.1071/ZO9740365.
7. R.A. Farrow, “Population dynamics of the Australian Plague Locust, Chortoicetes terminifera
(Walker), in Central Western New South Wales I. Reproduction and migration in relation to
weather,” Aust. J. Zool. 27(5), 717–745 (1979), http://dx.doi.org/10.1071/ZO9790717.
8. D. M. Hunter and R. J. Elder, “Rainfall sequences leading to population increases in
Austracris guttulosa (Walker) (Orthoptera:Acrididae) in arid north-eastern Australia,” Aust.
J. Entomol. 38(3), 204–218 (1999), http://dx.doi.org/10.1046/j.1440-6055.1999.00105.x.
Journal of Applied Remote Sensing 075096-17 Vol. 7, 2013
Downloaded From: https://www.spiedigitallibrary.org/journals/Journal-of-Applied-Remote-Sensing on 11 Dec 2021
Terms of Use: https://www.spiedigitallibrary.org/terms-of-useDeveson: Satellite normalized difference vegetation index data used in managing Australian plague locusts
9. D. M. Hunter and M. Melville, “The rapid and long lasting growth of grasses following
small falls of rain on stony downs in the arid interior of Australia,” Aust. J. Ecol. 19(1),
46–51 (1994), http://dx.doi.org/10.1111/aec.1994.19.issue-1.
10. D. M. Hunter, P. W. Walker, and R. J. Elder, “Adaptations of locusts and grasshoppers to the
low and variable rainfall of Australia,” J. Orthopt. Res. 10(2), 347–51 (2001), http://dx.doi
.org/10.1665/1082-6467(2001)010[0347:AOLAGT]2.0.CO;2.
11. D. P. Clark, “Night flights of the Australian plague locust, Chortoicetes terminifera Walk. in
relation to storms,” Aust. J. Zool. 17(2), 329–352 (1969), http://dx.doi.org/10.1071/
ZO9690329.
12. D.P. Clark, “Flights after sunset by the Australian plague locust, Chortoicetes terminifera
(Walk.), and their significance in dispersal and migration,” Aust. J. Zool. 19(2), 159–176
(1971), http://dx.doi.org/10.1071/ZO9710159.
13. R.A. Farrow, “Origin and decline of the 1973 plague locust outbreak in central western New
South Wales,” Aust. J. Zool. 25(3), 455–489 (1977), http://dx.doi.org/10.1071/ZO9770455.
14. D. P. Clark, “The plague dynamics of the Australian plague locust, Chortoicetes terminifera
(Walk.),” in Proc. Int. Study Conf. on Current and Future Problems of Acridology, 1970,
C. F. Hemming and T. H. C. Hemming, Eds., pp. 275–287, Centre for Overseas Pest
Research, London (1972).
15. V. A. Drake and D. R. Reynolds, Radar Entomology: Observing Insect Flight and
Migration, CABI, Wallingford, UK (2012).
16. V. A. Drake, H. K. Wang, and I. T. Harman, “Insect monitoring radar: stationary beam
operating mode,” Comput. Electron. Agric. 35(2–3), 111–137 (2002), http://dx.doi.org/
10.1016/S0168-1699(02)00014-5.
17. H. K. Wang and V. A. Drake, “Insect monitoring radar: retrieval of wingbeat information
from conical-scan observation data,” Comput. Electron. Agric. 43(3), 209–222 (2004),
http://dx.doi.org/10.1016/j.compag.2004.01.003.
18. Australian Plague Locust Commission (APLC) Department of Agriculture, Fisheries and
Forestry—Australia, Annual Report 1987–1988, AGPS, Canberra (1989).
19. M. Fries, W. Chapco, and D. Contreras, “A molecular phylogenetic analysis of the
Oedipodinae and their intercontinental relationships,” J. Orthopt. Res. 16(2) 115–125
(2007), http://dx.doi.org/10.1665/1082-6467(2007)16[115:AMPAOT]2.0.CO;2.
20. S. J. Simpson and G. A. Sword, “Phase polyphenism in locusts: mechanisms, population
consequences, adaptive significance and evolution,” in Phenotypic Plasticity of Insects:
Mechanisms and Consequences, D. Whitman and T. Ananthakrishnan, Eds., pp. 147–190,
Science Publishers Inc., Plymouth, UK (2009).
21. R. A. Farrow and B. C. Longstaff, “Comparison of the annual rates of increase of locusts in
relation to the incidence of plagues,” Oikos 46, 207–222 (1986), http://dx.doi.org/10.2307/
3565469.
22. P. M. Symmons and D. E. Wright, “The origins and course of the 1979 plague of the
Australian plague locust, Chortoicetes terminifera (Walker) (Orthoptera: Acrididae), includ-
ing the effect of chemical control,” Acrida 10, 159–190 (1981).
23. K. G. Wardhaugh, “The effects of temperature and photoperiod on the induction of diapause
in eggs of the Australian plague locust, Chortoicetes terminifera (Walker) (Orthoptera:
Acrididae),” Bull. Entomol. Res. 70(4), 635–647 (1980), http://dx.doi.org/10.1017/
S0007485300007926.
24. K.G. Wardhaugh, “Diapause strategies in the Australian plague locust, Chortoicetes termi-
nifera (Walker),” in The Evolution of Insect Life Cycles, F. Taylor and R. Karban, Eds.,
pp. 89–104, Springer-Verlag, New York (1986).
25. P. Gregg, “Development of the Australian plague locust, Chortoicetes terminifera, in rela-
tion to temperature and humidity,” J. Aust. Entomol. Soc. 22(3), 247–251 (1983), http://
dx.doi.org/10.1111/aen.1983.22.issue-3.
26. R. Allan, J. Lindesay, and D. Parker, El Nino Southern Oscillation and Climate Variability,
CSIRO Publ., Melbourne (1996).
27. D. E. Wright, “Analysis of the development of the major plagues of the Australian plague
locust, Chortoicetes terminifera (Walker) using a simulation model,” Aust. J. Ecol. 12(4),
423–437 (1987), http://dx.doi.org/10.1111/aec.1987.12.issue-4.
Journal of Applied Remote Sensing 075096-18 Vol. 7, 2013
Downloaded From: https://www.spiedigitallibrary.org/journals/Journal-of-Applied-Remote-Sensing on 11 Dec 2021
Terms of Use: https://www.spiedigitallibrary.org/terms-of-useDeveson: Satellite normalized difference vegetation index data used in managing Australian plague locusts
28. E. D. Deveson and P. W. Walker, “Not a one way trip: historical distribution data for
Australian plague locusts support frequent seasonal exchange migrations,” J. Orthopt. Res.
14(1), 91–105 (2005), http://dx.doi.org/10.1665/1082-6467(2005)14[91:NAOTHD]2.0.CO;2.
29. P. Laut et al., Environments of South Australia, Division of Land Use Research, CSIRO,
Canberra (1977).
30. C. J. Tucker, “Red and photographic infrared linear combinations for monitoring vegeta-
tion,” Remote Sens. Environ. 8(2), 127–150 (1979), http://dx.doi.org/10.1016/0034-4257
(79)90013-0.
31. C. J. Tucker and P.J. Sellers, “Satellite remote sensing of primary production,” Int. J. Rem.
Sens. 7(11), 1395–1416 (1986), http://dx.doi.org/10.1080/01431168608948944.
32. R. D. Graetz, R. Fisher, and M. G. A. Wilson, Looking Back: The Changing Face of the
Australian Continent 1972–1992, CSIRO Office of Space Sciences, Canberra (1992).
33. R. D. Graetz, “Satellite remote sensing of Australian rangelands,” Remote Sens. Environ.
23(2), 313–331 (1987), http://dx.doi.org/10.1016/0034-4257(87)90044-7.
34. R. D. Graetz et al., “The application of Landsat image data to rangeland assessment and
monitoring the development and demonstration of a land image-based resource information
system (LIBRIS),” J. Arid Environ. 10, 53–80 (1986).
35. Z. Kalensky, “Regional and global land cover mapping and environmental monitoring by
remote sensing,” Int. Arch. Photgramm. Eng. Rem. Sens. 31(B4), 413–426 (1996).
36. United States Geological Survey USGS LCI, Landcover Institute, http://landcover.usgs
.gov/landcoverdata.php (20 June 2012).
37. European Commission. Joint Research Centre—Land Resource Centre, Global Environment
Monitoring, http://bioval.jrc.ec.europa.eu/products/glc2000/glc2000.php (20 June 2012).
38. D. E. Pedgley, “Testing feasibility of detecting locust breeding sites by satellite,” Final
report to NASA on ERTS-1 experiment, COPR, London (1973).
39. K. Cressman, “The use of new technologies in Desert Locust early warning,” Outlooks on
Pest Management 19(2), 55–59 (2008), http://dx.doi.org/10.1564/19apr03.
40. R. Sivanpillai et al., “Mapping locust habitats in the Lli Delta, Kazakhstan, using Landsat
imagery,” Agric. Ecosyst. Environ. 117, 128–134 (2006), http://dx.doi.org/10.1016/j.agee
.2006.03.028.
41. J. Ma et al., “Monitoring East Asian migratory locust plagues using remote sensing data and
field investigations,” Int. J. Rem. Sens. 26(3), 629–634 (2005), http://dx.doi.org/10.1080/
01431160310001595019.
42. D. M. Hunter and M. Melville, “The rapid and long lasting growth of grasses following
small falls of rain on stony downs in the arid interior of Australia,” Aust. J. Ecol. 19(1),
+46–51 (1994), http://dx.doi.org/10.1111/aec.1994.19.issue-1.
43. D.M. Hunter, P.W. Walker, and R.J. Elder, “Adaptations of locusts and grasshoppers to the
low and variable rainfall of Australia,” J. Orthopt. Res. 10(2), 347–351 (2001), http://dx.doi
.org/10.1665/1082-6467(2001)010[0347:AOLAGT]2.0.CO;2.
44. L. McCulloch and D. M. Hunter, “Identification and monitoring of Australian plague locust
habitats from Landsat,” Rem. Sens. Environ. 13(2), 95–102 (1983), http://dx.doi.org/
10.1016/0034-4257(83)90015-9.
45. K. P. Bryceson, “The use of Landsat MSS data to determine the distribution of locust egg-
beds in the Riverina region of New South Wales, Australia,” Int. J. Rem. Sens. 10(11),
1749–1762 (1989), http://dx.doi.org/10.1080/01431168908904005.
46. K. P. Bryceson, “Digitally processed data as a tool in detecting potential Australian plague
locust outbreak areas,” J. Environ. Manage. 30(3), 191–207 (1990), http://dx.doi.org/
10.1016/0301-4797(90)90001-D.
47. K. P. Bryceson and R. Cannon, “The acquisition and use of low cost meteorological satellite
data in the Australian Plague Locust Commission,” Comput. Electron. Agric. 5, 47–64
(1990), http://dx.doi.org/10.1016/0168-1699(90)90047-S.
48. K. P. Bryceson, D. M. Hunter, and J. G. Hamilton, “Use of remotely sensed data in the
Australian Plague Locust Commission,” in Pest Control and Sustainable Agriculture,
S. A. Corey, D. J. Dall, and W. M. Milne, Eds., pp. 435–439, CSIRO, Melbourne (1993).
49. K. P. Bryceson and D. E. Wright, “An analysis of the 1984 locust plague in Australia using
multitemporal LANDSAT multispectral data and a simulation model of locust
Journal of Applied Remote Sensing 075096-19 Vol. 7, 2013
Downloaded From: https://www.spiedigitallibrary.org/journals/Journal-of-Applied-Remote-Sensing on 11 Dec 2021
Terms of Use: https://www.spiedigitallibrary.org/terms-of-useDeveson: Satellite normalized difference vegetation index data used in managing Australian plague locusts
development,” Agric. Ecosyst. Environ 16(2), 87–102 (1986), http://dx.doi.org/10.1016/
0167-8809(86)90096-4.
50. K. P. Bryceson, “Likely locust infestation areas in western New South Wales, Australia,
detected by satellite,” Geocarto Int. 6(4), 21–37 (1991), http://dx.doi.org/10.1080/
10106049109354337.
51. K. P. Bryceson, “Digitally processed data as a tool in detecting potential Australian plague
locust outbreak areas,” J. Environ. Manage. 30(3), 191–207 (1990), http://dx.doi.org/
10.1016/0301-4797(90)90001-D.
52. Department of the Environment, Water, Heritage and the Arts, NOAA AVHRR 1 km 14 day
NDVI Archive 1992–2009, Australian Government, Archive generated by the
Environmental Resources Information Network (ERIN) (2009).
53. M. L. Roderick, I. R. Noble, and S. W. Cridland, “Estimating woody and herbaceous veg-
etation cover from time series satellite observations,” Global Ecol. Biogeogr. 8(6), 501–508
(1999), http://dx.doi.org/10.1046/j.1365-2699.1999.00153.x
54. E. Deveson, L. Ognjanovic, and S. Cridland, “NOAA NDVI image sequences detect ground
vegetation response to rainfall in locust habitats,” APLC Technical Report No. 1/1998 (1998).
55. E. Deveson et al., “Field evalution of NDVI relative greenness imager—Broken Hill
2002-03,” APLC Technical Report No. 2/2005 (2005).
56. E. Deveson and D. Hunter, “The derivation of a digital map of locust habitats,” APLC
Technical Report No. 1/1996 (1996).
57. R. Thackway and I. D. Cresswell, An Interim Biogeographic Regionalisation for Australia:
a framework for setting priorities in the National Reserves System Cooperative Program
Version 4s, Australian Nature Conservation Agency, Canberra (1995).
58. Environment Australia, Revision of the Interim Biogeographic Regionalisation for
Australia (IBRA) and development of Version 5.1—Summary Report, Environment
Australia, Canberra (2000).
59. ABARES—Australian Bureau of Resource and Agricultural Economics and Science
(ABARES) DAFF, Australian Natural Resources Data Library, 2010, http://adl.brs.gov
.au/anrdl/metadata_files/pa_luav4g9abl07811a00.xml (25 March 2013).
60. T. K. Gill, “Satellite estimates of tree and grass cover using MODIS vegetation-indices and
ASTER surface-reflectance,” Ph.D. Thesis, University of Queensland (2008).
61. T. Gill and S. Phinn, “Estimates of bare ground and vegetation cover from Advanced
Spaceborne Thermal Emission and Reflection Radiometer (ASTER) short-wave infrared
reflectance imagery,” J. Appl. Rem. Sens. 2(1), 023511 (2008), http://dx.doi.org/
10.1117/1.2907748.
62. M. J. Steinbauer, “Relating rainfall and vegetation greenness to the biology of spur-throated
and Australian plague locusts,” Agric. Forest Entomol. 13(2), 205–2018 (2011), http://
dx.doi.org/10.1111/afe.2011.13.issue-2.
63. J. A. Tratalos and R. A. Cheke, “Can NDVI GAC imagery be used to monitor desert locust
breeding areas?” J. Arid Environ. 64(2), 342–356 (2006), http://dx.doi.org/10.1016/j
.jaridenv.2005.05.004.
64. C. R. N. Rao and J. Chen, “Revised Post Launch Calibration of the Visible and Near
Infrared Channels of the Advanced Very High Resolution Radiometer (AVHRR) on the
NOAA 14 Spacecraft,” Int. J. Rem. Sens. 20(18), 3485–3491 (1999), http://dx.doi.org/
10.1080/014311699211147.
65. E. Deveson, “An evaluation of MODIS imagery,” APLC Technical Report No 1/2005
(2005).
66. T. Xu and M. F. Hutchinson, “New developments and applications in the ANUCLIM spatial
climatic and bioclimatic modelling package,” Environ. Model. Softw. 40, 267–279 (2013),
http://dx.doi.org/10.1016/j.envsoft.2012.10.003.
Biography and photograph of the author is not available.
Journal of Applied Remote Sensing 075096-20 Vol. 7, 2013
Downloaded From: https://www.spiedigitallibrary.org/journals/Journal-of-Applied-Remote-Sensing on 11 Dec 2021
Terms of Use: https://www.spiedigitallibrary.org/terms-of-useYou can also read