Sea surface temperature and chlorophyll-a concentrations from MODIS satellite data and presence of cetaceans in Savu, Indonesia
←
→
Page content transcription
If your browser does not render page correctly, please read the page content below
Sea surface temperature and chlorophyll-a
concentrations from MODIS satellite data and
presence of cetaceans in Savu, Indonesia
1
 Jahved F. Maro, 1Agus Hartoko, 1Sutrisno Anggoro, 1Max R.
Muskananfola, 2Erick Nugraha
      1
     Faculty Fisheries and Marine Science, Coastal Resources Management Doctoral
Programe, Diponegoro University, Semarang, Indonesia; 2 Faculty of Fishing Technology,
   Jakarta Technical University of Fisheries, South Jakarta, Indonesia. Corresponding
                    author: E. Nugraha, nugraha_eriq1@yahoo.co.id

       Abstract. This study demonstrated that the presence of cetacean in the Savu seas was in accordance
       with the patterns of sea surface temperature (SST) and chlorophyll-a concentrations, as indicators of a
       favourable seawater temperature and of the presence of its natural diet. The aim of this study was to
       analize the monthly average sea surface temperature (SST) and chlorophyll-a from January to December
       2018, based on the MODIS Aqua satellite data and on the field validation for May 2018, and on the
       cetacean sighting surveys in Savu seawater. Results of field SST data measurementranged from 26.4 to
       30.5oC. The SST satellite data ranged from 26.7 to 31.4oC and chlorophyll-a concentration ranged from
       0.5-0.83 mg m-3. Field cetacean observations had identified four dolphins and two whales species,
       namely the bottlenose dolphin (Tursiops truncatus), Fraser’s dolphin (Lagenodelphis hosei), pantropical
       spinner dolphin (Stenella longirostris) and pantropical spotted dolphin (Stenella attenuata). The two
       species of whales found were the pygmy feresa whale (Feresa attenuata) and pygmy sperm whale (Kogia
       breviceps) from 12 field survey points.
       Key Words: oceanographic variables, cetaceans, remote sensing.

Introduction. Indonesian seawaters are inhabited by 31 species of cetaceans and the
dugong (Rosas et al 2012). These marine mammals are spread from the coast to the
deep sea of Indonesia, showing both resident and migratory behavior (Salim 2011).
Several species of cetaceans with migratory behavior occupy the eastern part of
Indonesia seawaters and their migratory pathways extend from the Indian to Pacific
Ocean through the straits of Komodo Island, Solor, Lembata, Alor, Wetar, Banda Sea,
southeast Sulawesi, east Sulawesi and Sorong (Papua Island), at the north (Salim 2011).
The eastern part of Indonesia seawaters, especially in some inter islands, have
functioned as the entry point strait for cetaceans as well as for some species of sea
turtles. At present, most of the world’s attention is given to the issue of protection,
presence observation, migratory and distribution patterns of marine mammals, especially
for cetaceans (Dréo et al 2019). The issues mainly in regard the declining population of
cetaceans caused by human activities, such as illegal fishing, pollution, and
environmental degradation (González et al 2019; Sutton et al 2019). In-depth and
holistic research on cetacean ecology and migratory pathways in Indonesia is very
limited, although they constitute the basis for their conservation.
        Savu Sea belongs to the province of East Nusa Tenggara (ENT), with extension
areas up to Indonesia's Exclusive Economic Zone (EEZ), next to the west coast borders of
Timor Leste National Marine Park of East Nusa Tenggara (Putra et al 2016). Savu Sea has
unique seawater conditions with a significant increase in the sea surface temperature
(SST) during the southeast monsoon and low SST during the east monsoon. The
dynamics of seawater mass displacement occur in the surface layer due to a vertical
dynamic pattern of seawater temperature l resulting in an upwelling process, as well as in
a horizontal mixing process due to the monsoonal wind pattern in Savu Sea. The impact

AACL Bioflux, 2021, Volume 14, Issue 3.
http://www.bioflux.com.ro/aacl
                                                    1190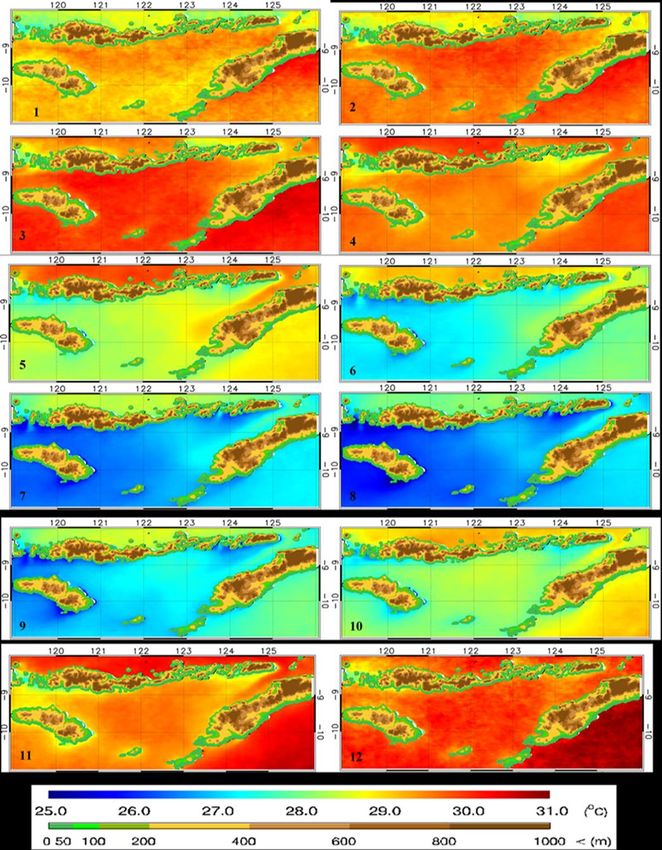
of the vertical seawater upwelling process triggers the seawater nutrient enrichment and
phytoplankton biomass at the upper layer on shallow straits and along the coastal area
(Sediadi 2004; Packard et al 2015).
        The SST has a significant impact on the upwelling and on the natural abundance
of plankton biomass, copepods and small crustaceans (Mujiyanto et al 2017), attracting
groups of cetaceans which migrate into the Savu Sea through the Lembata, Alor and
Wetar straits (Hartoko 2013). The study of Priyadarshana et al (2016) using MODIS Aqua
satellite imagery and field surveys in the Gulf of Sri Lanka had found that the cetacean
distribution and migratory pattern was explained mainly by the foraging habits. In the
Indian Ocean studies have reported the presence of sperm whales in depths up to 20 m
swimming toward the beach for feeding (Reisinger et al 2015; Citta et al 2018; Stepanuk
et al 2018).
        Holistic investigations on cetaceans were necessary to the marine authorities of
East Nusa Tenggara Province for a sustainable management based on evidence data of
oceanographic variables, such as: sea surface temperature, current pattern, upwelling,
plankton abundance and data related to the cetaceans in the Savu Sea, resulting in an
accurate, comprehensive and integrated scientific research report. Documented
observations of cetacean behavior have reported blowing, logging, fluking, flipper-
slapping, slap, spy-hopping, breaching and feeding (Kahn 2016).
        Remote sensing technology is one method which has potential to be effective in
conducting surveys over large areas and in narrow straits (Hartoko et al 2019). The
satellite data used in this study was MODIS AquaTerra, for SST and chlorophyll-a in the
Savu seawater. The aim of the study was to conduct spatial analysis and determine
monthly ranges of SST and chlorophyll-a and their relationship to the presence of
cetaceans in Savu seawater within East Nusa Tenggara Province, producing possible
recommendations for a sustainable management by the local government.

Material and Method. Field cetacean boat track-line surveys were conducted over 10
days in November 2018 with 12 survey points along the Savu sea, East Nusa Tenggara
Province, Indonesia as presented in Figure 1.

                                Figure 1. Station points of the field survey.

In the present study we used several survey tools, including the Marine Conservation
Agency survey boat for surveyor sightings, Global Positioning System (GPS) to mark
survey points coordinates, Nikon D5500 Camera for cetacean sighting documentations,
Drone for aerial survey boat and cetacean sighting documentations, Water Quality
Checker to measure in-situ sea water temperature, Binoculars for cetacean sighting
identification, Hydrophone, Cetacean Identification Book for cetacean species
identification, ArcMap 10.3, SeaDas 7.3, and Er-Mapper software for satellite data

AACL Bioflux, 2021, Volume 14, Issue 3.
http://www.bioflux.com.ro/aacl
                                                    1191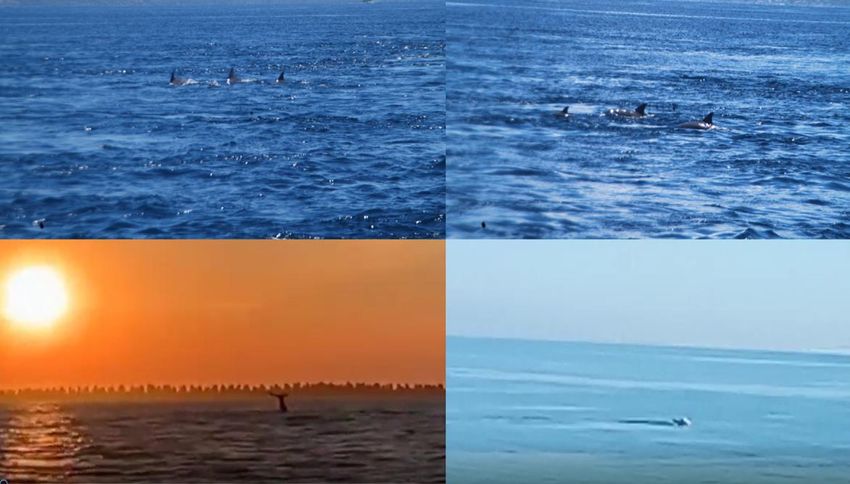
processing. The MODIS AquaTerra level-3 of ASCII data file was downloaded from NASA
link https://oceancolor.gfsc.nasa.gov (2019) for sea surface temperatures and
chlorophyll-a data analysis.

Field survey method. Field observations were based on a methodology used also by
Guinet et al 2009, Kahn 2016, Forney & Barlow 1998, Diogou et al 2019, Perrin et al
2018. The use of the zigzag method aims to obtain an estimate of cetacean density and
avoid glare from the sun. The method of field observation of the observer group
consisted of 4 observers who were placed on the front deck, on the left, center and right
side of the boat. The design of the observation experiment can be seen in Figure 2. The
required field data is recorded and recorded in the logbook and returned to the original
track. Field data and information recorded are date and time of appearance of cetaceans,
GPS position, angle of cetacean position to boat, relative distance of cetaceans from
boats, cetacean swimming direction, species, number, sea surface temperature,
chlorophyll-a and cetacean behavior.

                      Figure 2. On board observer positions during the survey.

Acquisition of satellite data. Acquisition of MODIS Aqua Terra satellite level 3 data
used in the study were downloaded from National Aeronautics and Space Administration
(NASA 2019) for the sea surface temperature (SST) and chlorophyll-a data. The study
used original spectral of ASCI format level 3 data which was then processed using
SeaDas 7.3 software and followed by a cropping at the level of the focused research area
of Savu Sea.

Satellite data processing method and analysis. The first step of satellite raw data
processing was involving data transform from the original satellite raw data in a numeric
ASCI format consisting of coordinates and SST or chlorophyll-a data, then transformed
into a spatial layer using an interpolation process based on a geo-statistic gridding
method using ErMapper and ArcGis 10.3 software (Hartoko & Helmi 2004; Hartoko et al
2019; Dréo et al 2019).

Results

Distribution of sea surface temperature. Sea surface temperature was measured by
using a water quality checker at 12 stations, in the range of 26.4–30.5oC (Figure 3A).
Sea surface temperature based on MODIS AquaTerra satellite data was in the range of
26.7–31.4oC (Figure 3B), while analysis of MODIS AquaTerra satellite in November 2018
resulted in a SST range of 26.7–31.4oC. The position choice of stations 1 to 8 was
intended to represent the Alor strait, stations 7 and 8 the Lembata–Lamalera strait and
stations 9–12 the Sawu strait and Rote Islands, as the entrance gate of the Indian Ocean
into the Savu Sea.
        The east monsoon of November 2018 is regarded as the peak of the cetacean
presence, in comparison with a lower MODIS satellite SST observed during the west monsoon
of January 2018. More precisely, the recorded SST in the Savu Sea during the cetacean

AACL Bioflux, 2021, Volume 14, Issue 3.
http://www.bioflux.com.ro/aacl
                                               1192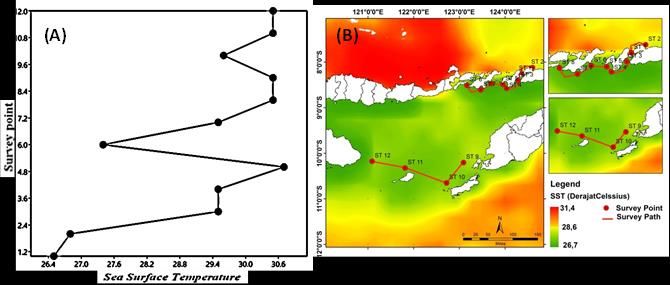
presence event in November 2018 was 26.7–28.6oC, exhibiting a cooled-pool seawater mass,
compared to the SST range of 28.6–31.4oC outside of the Savu Sea (Figure 3B).

  Figure 3. Distribution of SST from November 2018 field measurement (Figure 3A) and
        monthly distribution of SST data from the MODIS AquaTerra satellite (3B).

The results of the monthly SST analysis for 1 year using MODIS AquaTerra data found that the
lowest SST detected was recorded in July, with a temperature range of 26-27oC (Figure 4).

  Figure 4. Monthly average of SST data from the MODIS satellite, in January–December
                                 2018 in the Savu Sea.

AACL Bioflux, 2021, Volume 14, Issue 3.
http://www.bioflux.com.ro/aacl
                                           1193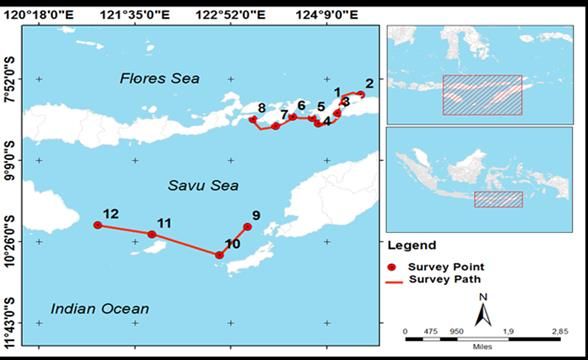
The range of SST recorded before the cetacean presence event in January 2018 was in
the range of 27-32.5oC. The average SST range was higher in December and January
2018. Cetacean sightings in November 2018 were assessed due to the increasing number
of seawater mixing processes in the Savu Sea due to the west monsoon winds. The
impact is upwelling so that the Savu Sea has a warm and nutrient-rich SPL. Therefore,
cetaceans come to the Savu Sea to find food.
Spatial distribution of chlorophyll-a. Monthly spatial analysis of colorophyll-a
concentrations using the Aqua Terra MODIS level 3 satellite data downloaded from the
official NASA link https://oceancolor.gsfc.nasa.gov. Then the chlorophyll-a data were
analyzed by the IDL application using the kriging analysis method, so it was found that
the chlorophyll-a concentration in the Savu Sea was in the range of 0.5-0.83 mg m-3
when cetaceans appeared in November 2018 in the Savu Sea (Figure 5).
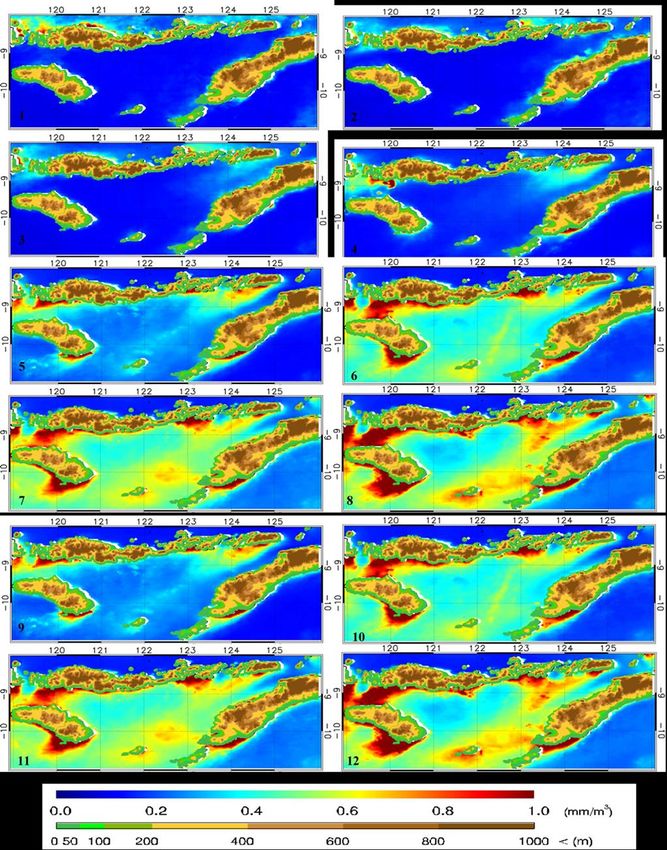
Figure 5. Monthly average of MODIS Satellite data on chlorophyll-a concentration,
between January and December 2018, at Savu Sea.
AACL Bioflux, 2021, Volume 14, Issue 3.
http://www.bioflux.com.ro/aacl
1194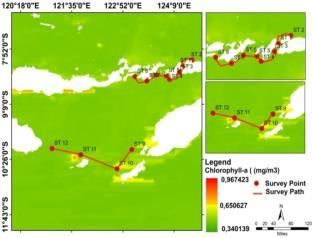
In comparison, the chlorophyll-a concentration during the event was higher than during
the west-monsoon in January 2018 (before the cetacean presence in November 2018),
which was found to be in the range of 0.34–0.65 mg m-3, as well as during the west
monsoon of January 2019, after the peak season, which was in the range of 0.05-1.24
mg m-3, as it can be seen in Figure 6A and Figure 6B.

        A                                          B

    Figure 6. Spatial distribution of chlorophyll-a concentration in January 2018 (A) and
                              January 2019 (B) in the Savu Sea.

Both before and after the peak of the cetacean period, the seawater chlorophyll-a was
spread evenly inside and outside of the Savu Sea. The results of SST and chlorophyll-a
data extraction from the Aqua MODIS satellite in the waters of the Savu Sea in 2018, in
order to compare the SST and chlorophyll-a distribution data for the emergence of
cetaceans, can be seen in Figure 7A and Figure 7B.

  Figure 7. Variation in average SST (A); Variation in average chlorophyll-a (B) January-
                          December 2018 of MODIS satellite data.

Judging from Figures 7A and 7B it can be said that the decrease in SST in April-July is in
the range of 28-26oC with the chlorophyll-a range increasing from February to July in the
range of 0.1-0.8 mg m-3. The presence of cetaceans in Savu waters in November 2018 is
in accordance with monthly SST and chlorophyll-a variations (in data from the MODIS
satellite), showing an average SST of 28.5oC and an average chlorophyll-a of 0.4 mg m-3.

Field cetacean sightings in the Savu seawater. Field observations in the Savu Sea
during November 2018 reported six species of cetaceans, four species of dolphins and

AACL Bioflux, 2021, Volume 14, Issue 3.
http://www.bioflux.com.ro/aacl
                                            1195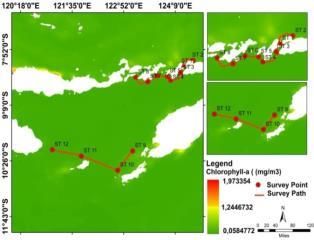
two species of whales. Cetacean species and their percentage of appearance time in
water bodies of each species are presented in Figure 8.

    Figure 8. Types of cetaceans and time of appearance of cetaceans in the Savu Sea.

Looking at the graph in Figure 8, it can be seen that 4 species of cetaceans were found:
the Pantropical spinning dolphin (Stenella longirostris) was recorded at the survey points
(ST) 1, 2, 3, 4, 6, 10 and 11, showing arcs, the bow and the antenna goes around
behaviors. Pantropical dolphins (Stenella attenuata) were recorded at the survey points
(ST) 1, 2, 3, and 5 showing air avoidance and aerial behaviors. The whales recorded
were dwarf killer whales (Feresa attenuate) and dwarf sperm whales (Kogia breviceps) at
the survey points (ST) 1, 2, 3, and 4 which exhibited avoidance and logging behavior,
with an average appearance time in water bodies ranging from 0.6 to 0.34 hours. The
emergence of cetaceans in the Savu Sea waters can be seen in Figure 9.

           A                                       B

           C                                       D

        Figure 10. Dolphin (A and B) and whale (C and D) in the Savu sea during field
                                   observations (original).

Discussion. The current study revealed that the cetacean sightings were in accordance
with the field SST spatial distribution data in the range of 26.5-30.5oC during November
2018. This study assumes the cold pond SST pattern recorded during November 2018
(Figures 3A, 3B) will be much different from the SST pattern in December 2018 (Figure
4), with a higher SST pattern in the Savu Sea and the surrounding seawaters. Research

AACL Bioflux, 2021, Volume 14, Issue 3.
http://www.bioflux.com.ro/aacl
                                            1196
by Sutton et al (2019), National Marine Park East Nusa Tenggara (2018) and Kahn
(2017) reported that the range of in-situ SST for cetaceans was between 25–33oC. This
SST range was regarded also as the optimum temperature for plankton breeding,
increasing the plankton density and biodiversity and ecological functions as migratory
attractor to the area for feeding and reproduction of small fishes, cephalopods and
ultimately for cetaceans, as the top predator in the food chain. Similar research by
Frantzis et al (2011) showed that whales and dolphins were migrating towards plankton
and prey rich seawater.
The high level of primary productivity in Savu Sea has caused unique
oceanographical phenomena based on the combination of the SST (Figure 3A, 3B, 4 and
7A) and chlorophyll-a in the seawater mass (Figure 5, 6A, 6B and 7B). It is assumed that
the vertical current movement from the south Indian Ocean entered through the strait
between Sawu and the Rote Islands and resulted in an upwelling through the main
Lamalera, Alor and Wetar straits. Further northward seawater mass from Indian Ocean
caused a horizontal mixing process with the Pacific Ocean water mass at Banda Sea and
resulted in a nutrient rich seawater mass. The high nutrients and primary productivity in
the Savu Sea by means of phytoplankton biomass was also confirmed by the MODIS
satellite chlorophyll-a data as in Figure 5. Previous research indicates that the Savu Sea
has a high level of primary productivity as a result of the vertical mixing of cool Indian
Ocean waters under currents that move upward into the Savu Sea, bringing high
quantities of nutrients from the deeper water column.
The mixing of the cold Indian Ocean with the warm Pacific Ocean water increases
the nutrient concentration and primary production in the Savu Sea (Suton et al 2019; Li
& Yu 2020). These favorable ecological conditions have attracted some pelagic fish and
other migratory species for feeding, inducing their migratory pattern (Hartoko & Helmi
2004; Chung & Gong 2019; Lyu et al 2016). Chlorophyll-a concentration data from the
MODIS satellite indicated values in the range of 0.06-0.87 mg m-3, during the cetacean
sightings in Savu Sea, in November 2018, which was also confirmed by the research of
Putra et al (2016). Huo et al (2020) stated that the optimal chlorophyll-a concentrations
are in the range of 0.02-0.7 mg m-3, indicating a fertile or rich of nutrient seawater.
The high primary productivity in seawater will increase the biomass of small fish
species and squid (cephalopods), regarded as the main prey and ultimately attracts
species of marine mammals such as whales and dolphins, which migrate for feeding
(Simond et al 2019). The current study revealed that the range of chlorophyll-a
concentration inside the Savu Sea 0.6-0.8 mgm-3 was found to be tenfold higher than in
the surrounding areas, in the Indian Ocean, with only 0.06 mg m-3. The two species of
whales and four species of dolphins observed in the current study were assumed to be
suitable with this favorable current mixing areas (FCMA) in the Savu Sea, with a high
primary productivity and an optimum sea surface temperatures (Hartoko 2009; Hartoko
2010; Sutton et al 2019). The presence of cetaceans with behavior of bow riding
traveling, bow riding, feeding riding and aerials in the FCMA in the Savu Sea was related
to the migratory behavior and instinct for feeding (Diogou et al 2019; Rudolph et al
1997; Kahn 2017).
The two whale species and four dolphin species observed in this study correspond
to a favorable current mixing area with high primary productivity and optimal sea surface
temperature (Sutton et al 2019). Sightings of the bottlenose dolphin (Tursiops truncatus)
were found at stations 2, 4 and 7, with bow-riding behavior. Fraser's dolphin
(Lagenodelphis hosei) was found at stations 1, 2, 4, 5, 12, with the bow and aerial
behavior. The pantropical spinning dolphin (Stenella longirostris) was found at stations 1,
2, 3, 4, 6, 10, 11, with bow, traveling, bow riding and aerial behavior. The pantropical
leopard dolphin (Stenella attenuata) was found at stations 1, 2, 3, 5 with aerial and air
avoidance behavior. Based on field observation data, dolphins were found in the sea
surface temperature range of 26.4-30.5oC and chlorophyll-a ranged from 0.3 to 0.6 mg m-3.
The dwarf killer whale (Feresa attenuate) and the dwarf sperm whale (Kogia breviceps)
were found at stations 1, 2, 3, 4, with avoidance and logging behavior, corresponding to
a sea surface temperature range between 26.4-28.7oC and chlorophyll 0.2–0.8 mg m-3.
The average appearance of cetaceans in the Savu Sea waters ranges from 0.6 to 0.34
AACL Bioflux, 2021, Volume 14, Issue 3.
http://www.bioflux.com.ro/aacl
1197hours. Cetacean observed behavior was of types: traveling by bow, bow, eating, and
space. Cetaceans appearing at the marine waters’ surface with an average time span of
0.5-0.55 hours show migratory feeding and reproducing behavior (Rudolph et al 1997;
Diogou et al 2019).
Conclusions. The cool seawater phenomena in November 2018 in the Savu Sea,
corresponding to field SST spatial distribution ranging from 26.4 to 30.5oC, was regarded
as the oceanographic variable the most influencing on the presence, sightings and
migating paths of the cetacean at the Savu Sea. The satellite chlorophyll-a concentration
in the Savu Sea, in November 2018, ranged from 0.06 to 0.87 mg m-3. Four species of
dolphins were observed: the bottlenose dolphins (T. truncatus), the Fraser’s dolphins (L.
hosei), the pygmy spinning dolphins (S. longirostris) and the pantropical spotted dolphins
(S. attenuata), and two species of whales: the pygmy killer whales (F. attenuate) and the
pygmy sperm whale (K. breviceps).
Acknowledgements. The authors would like to thank the Local Government of East
Nusa Tenggara Province and the Office of World Wildlife Fund for Nature (WWF) at Solor-
Alor. Sincere thanks to the LPDP Indonesian Government for the scholarship concerning
the Doctoral Program of Coastal Management, at the Faculty of Fisheries and Marine
Sciences and to the Institute of Research and Community Services, at the Diponegoro
University, Semarang, Indonesia, for their funding support under the contract no. 233-
39/UN7.6.1/PP/2020. Special thanks to the National Aeronautics and Space
Administration (NASA) for the use of MODIS AquaTerra satellite data and the SeaDas
software application, and to ESRI for the use of ArcGis 10.3 software to process the
satellite data and to all other parties for their help and contributions.
Conflict of interest. The authors declare no conflict of interest.
References
Citta J. J., Okkonen S. R, Quakenbush L. T., Maslowski W., Osinski R., George J. C.,
Small R. J., Brower H., Heide M. P., Harwood L. A., 2018 Oceanographic
characteristics associated with autumn movements of bowhead whales in the
Chukchi Sea. Deep-Sea Research Part II (152):121-131.
Chung C. C., Gong G. C., 2019 Attribution of the growth of a distinct population of
Synechococcus to the coverage of lateral water on an upwelling. Terrestrial,
Atmospheric and Oceanic Sciences 30(4):575-587.
Diogou N., Palacios D. M., Nieukirk S. L., Nystuen J. A., Papathanassiou E., Katsanevakis
S., Klinck H., 2019 Sperm whale (Physeter macrocephalus) acoustic ecology at
ocean station PAPA in the Gulf of Alaska – Part 1 : Detectability and Seasonality.
Deep-Sea Research Part I (150):103-147.
Dréo, Richard, Bouffaut L., Leroy E., Barruol G., Samaran F., 2019 Baleen whale
distribution and seasonal occurrence revealed by an ocean bottom seismometer
network in the Western Indian Ocean. Deep-Sea Research Part II: Topical Studies
in Oceanography 16:132-144.
Frantzis A., Airoldi S., Notarbartolo-di-sciara G., Johnson C., Mazzariol S., 2011 Inter-
basin movements of mediterranean sperm whales provide insight into their
population structure and conservation. Deep-Sea Research Part I 58(4):454-459.
Forney K. A., Barlow J., 1998 Seasonal patterns in the abundance and distribution of
California cetaceans, 1991-1992. Marine Mammal Science 14(3):460-489.
González C., Victoria, Piola A., O’Brien T. D., Tormosov D. D., Acha E. M., 2019
Circumpolar frontal systems as potential feeding grounds of southern right whales.
Progress in Oceanography 176:102-123.
Guinet C., Taupier-Letage I., Mate B., Petiau E., 2009 Scale-dependent habitat use by a
large free-ranging predator, the Mediterranean fin whale. Deep-Sea Research I
56:801-811.
AACL Bioflux, 2021, Volume 14, Issue 3.
http://www.bioflux.com.ro/aacl
1198Hartoko A., 2013 Oceanographic characters and plankton resources of Indonesia. Graha
Ilmu, Jogjakarta, Indonesia, 166 p.
Hartoko A., Helmi M., 2004 Development of digital multilayer ecological model for Padang
coastal water West Sumatra. Journal of Coastal Management 7(3):129-136.
Hartoko A., 2009 Ocean observation on SST variability and sub-surface sea water
temperature off the North Papua the fate of El Nino 1997 & 2007 and La Nina 2002:
Field measurement and TRITON Buoy data. Journal of Coastal Development
13(1):1-10.
Hartoko A., 2010 Spatial distribution of Thunnus sp., vertical and horizontal sub-surface
multilayer temperature profiles of in-situ ARGO float data in Indian Ocean. Journal
of Coastal Development 14(1):1-14.
Hartoko A., Febrianto A., Pamungkas A., Fachruddin I., Helmi M., Hariadi, 2019 The myth
and legend of Sadai and Gaspar Strait Bangka Belitung (Banca-Billiton) and
oceanographic conditions. International Journal of GEOMATE 17(62):212-218.
Huo Y., Liu Q., Zhang F., Li C., Tao Z., Bi H., Fan C., Zhang J., Sun S., 2020 Biomass and
estimated production, and feeding pressure on zooplankton of chaetognaths in the
Yellow Sea, China. Terrestrial, Atmospheric and Oceanic Sciences, pp. 61-75.
Kahn B., 2017 Blue whales of the Savu Sea, Indonesia. 17th Biannual Marine Mammal
Conference - Blue Whale Workshop, Cape Town, South Africa, pp. 1-3.
Kahn B., 2016 Oceanic cetaceans & associated habitats Solomon Islands Marine
Assessment. The Nature Conservancy, Indo-Pacific Resource Centre, pp. 5-15.
Li Y. X., Yu J. Y., 2020 Why rare tropical cyclone formation after maturity of super El Niño
events in the western North Pacific? Terrestrial, Atmospheric and Oceanic Sciences
31(1):21-32.
Lyu C. G., Tian J., Yang W. B., Tian Q. J., Lin Y. H., Liu Z. M., Zhang H. M., 2016 Diurnal
variation of solar-blind ultraviolet upwelling radiance led by observation geometry
factors on geostationary attitude sensor limb viewing. Terrestrial, Atmospheric and
Oceanic Sciences, pp. 943-953.
Mujiyanto, Riswanto, Nastiti A. S., 2017 Effectiveness of sub zone cetacean protection in
marine protected areas Savu. National, Sea, Marine Park, East Nusa Tenggara,
Areas Savu, S.E.A. National, Marine Park, and East Nusa Tenggara. Journal of
Coastal and Ocean 1(2):1-12.
Packard T., Osma N., Fernández-Urruzola I., Codispoti L. A., Christensen J. P., Gómez M.
2015 Peruvian upwelling plankton respiration: calculations of carbon flux, nutrient
retention efficiency, and heterotrophic energy production. Biogeosciences
(12):2641-2654.
Perrin W. F., Mallette S. D., Brownell R. L., 2018 Minke whales. Balaenoptera
acutorostrata and B. bonaerensis. Encyclopedia of Marine Mammals, pp. 608-613.
Priyadarshana T., Randage S. M., Alling A., Calderan S., Gordon J., Leaper R., Porter L.,
2016 Distribution patterns of blue whale (Balaenoptera musculus) and shipping off
southern Sri Lanka. Regional Studies in Marine Science 3:181-188.
Putra M. I. H., Lewis S. A., Kurniasih E. M., Prabuning D., Faiqoh E., 2016 Plankton
biomass models based on GIS and Remote sensing technique for predicting marine
megafauna hotspots in the Solor Waters. IOP Conference Series Earth and
Environmental Science 47(1):12-15.
Reisinger R. R., Keith M., Andrews R. D., de Bruyn P. J. N., 2015 Movement and diving of
killer whales (Orcinus orca) at a Southern Ocean Archipelago. Journal of
Experimental Marine Biology and Ecology 473:190-120.
Rosas C. L., Gil M. N., Uhart M. M., 2012 Trace metal concentrations in southern right
whale (Eubalaena australis) at Península Valdés, Argentina. Marine Pollution Bulletin
64(6):1255-1260.
Rudolph P., Smeenk C., Leatherwood S., 1997 Preliminary checklist of cetacea in the
Indonesian archipelago and adjacent waters. Jurnal of Zoologische Verhandelingen
Leiden 312:1-48.
Salim D., 2011 Conservation of marine mammals (Cetacea) at Savu Sea. East Nusa
Tenggara. Marine Journal 4(1):24-41.
AACL Bioflux, 2021, Volume 14, Issue 3.
http://www.bioflux.com.ro/aacl
1199Sediadi A., 2004 Effect of upwelling to the abundance and phytoplankton distribution at
Banda Sea. Makara Sains 8(2):43-51.
Simond A. E., Houde M., Lesage V., Michaud R., Zbinden D., Verreault J., 2019
Associations between organohalogen exposure and thyroid- and steroid-related
gene responses in St. Lawrence Estuary belugas and minke whales. Marine Pollution
Bulletin 145:174-184.
Stepanuk J. E. F., Read A. J., Baird R. W., Webster D. L., Thorne L. H., 2018
Spatiotemporal patterns of overlap between short-finned pilot whales and the U.S.
pelagic longline fishery in the Mid-Atlantic Bight: An assessment to inform the
management of fisheries bycatch. Fisheries Research 208:309-320.
Sutton A. L., Curt K. S., Jenner K. C. S., Jenner M. M., 2019 Deep-sea research part II
habitat associations of cetaceans and seabirds in the tropical eastern Indian Ocean.
Deep-Sea Research Part II 166:171-186.
*** NASA, 2019 https://oceancolor.gsfc.nasa.gov.
*** National Marine Park East Nusa Tenggara, Areas Savu Sea, 2018 Effectiveness of sub
zone cetacean protection in marine protected areas of Savu Sea. Research report.
Received: 03 March 2021. Accepted: 24 April 2021. Published online: 07 May 2021.
Authors:
Jahved Ferianto Maro, Diponegoro University, Fisheries and Marine Science Faculty, Coastal Resources
Management Doctoral Program, Prof. Sudarto Street, Semarang, 50275 Central Java, Indonesia, e-mail:
yantogiuntrib@gmail.com
Agus Hartoko, Diponegoro University, Fisheries and Marine Science Faculty, Coastal Resources Management
Doctoral Program, Prof. Sudarto Street, Semarang, 50275 Central Java, Indonesia, e-mail:
agushartoko.undip@gmail.com
Sutrisno Anggoro, Diponegoro University, Fisheries and Marine Science Faculty, Coastal Resources Management
Doctoral Program, Prof. Sudarto Street, Semarang, 50275 Central Java, Indonesia, e-mail:
sutrisnoanggoro52@gmail.com
Max Rudolf Muskananfola, Diponegoro University, Fisheries and Marine Science Faculty, Coastal Resources
Management Doctoral Program, Prof. Sudarto Street, Semarang, 50275 Central Java, Indonesia, e-mail:
maxmuskananfola@yahoo.com
Erick Nugraha, Jakarta Technical University of Fisheries, Faculty of FishingTechnology, 12520 South Jakarta,
Indonesia, e-mail: nugraha_eriq1@yahoo.co.id
This is an open-access article distributed under the terms of the Creative Commons Attribution License, which
permits unrestricted use, distribution and reproduction in any medium, provided the original author and source
are credited.
How to cite this article:
Maro J. F., Hartoko A., Anggoro S., Muskananfola M. R., Nugraha E., 2021 Sea surface temperature and
chlorophyll-a concentrations from MODIS satellite data and presence of cetaceans in Savu, Indonesia. AACL
Bioflux 14(3):1190-1200.
AACL Bioflux, 2021, Volume 14, Issue 3.
http://www.bioflux.com.ro/aacl
1200You can also read