Seismotectonics of Malatya Fault, Eastern Turkey - De Gruyter
←
→
Page content transcription
If your browser does not render page correctly, please read the page content below
Open Geosci. 2019; 11:1098–1111
Research Article
Diğdem Acarel*, Musavver Didem Cambaz*, Fatih Turhan, Ahu Kömeç Mutlu, and Remzi Polat
Seismotectonics of Malatya Fault, Eastern Turkey
https://doi.org/10.1515/geo-2019-0085
Received Oct 25, 2019; accepted Dec 11, 2019
1 Introduction
Abstract: Turkey is located in a seismically active region Precise assessment of seismic risk requires not only the
with a complex tectonic history. In order to perform seis- understanding of kinematics and structure of major plate
mic risk assessment precisely, major fault zones (North boundary zones but intraplate deformation zones as well.
Anatolian Fault Zone and East Anatolian Fault Zone) In intraplate settings, rate of strain accumulation is rel-
that are well defined are monitored continuously. It is a atively low and the associated fault rupture occurs over
widely known fact that intraplate settings, such as Ana- longer recurrence intervals (e.g. several hundreds to thou-
tolian Plate, in which devastating earthquakes may oc- sands of years; [1, 2]) than moderate or large earthquakes
cur, need to be observed densely. In this study, we in- occurring on plate boundaries. However, the abrupt re-
vestigate the seismotectonics of Malatya Fault within the lease of accumulated stress over years may lead to destruc-
Malatya Ovacık Fault Zone (MOFZ), which is one of the tive earthquakes (e.g. Mexico, Bulnay [3, 4]). Moreover, ma-
major agents responsible for internal deformation acting jor plate boundary zones are monitored by quite dense sen-
on Anatolian Plate. Recent geological and paleoseismolog- sor networks (seismic, GPS-Global Positioning Systems-
ical studies underline the necessity of comprehending the and strong motion), whereas intraplate settings, like the
seismicity and latency of a major earthquake in this fault region of interest in this study, attract less attention even
zone. We applied traditional techniques to investigate data though they possess a high seismic risk.
of such a region. Earthquakes that occured in the vicinity Eastern Mediterranean is an unprecedented region
of Malatya Fault between the years 2011 and mid-2019 are with intriguing tectonic processes taking place: a conti-
employed in a detailed analysis. The results of this study nental collision between stable Eurasia and northward mi-
are constrained by the distribution of sensor networks in grating Arabian Plate along Bitlis-Zagros-Suture Zone, an-
the region, yet allowing to define an active structure which other collision between stable Eurasia and Nubian Plate
is not included in the active fault map of Turkey, therefore, along Hellenic-Cyprus Arc and the lateral escape of Ana-
making a significant contribution to seismic hazard esti- tolian Plate as a consequence. To compensate these mo-
mation. tions, Anatolian plate is accommodated by two main
plate boundaries; dextral strike-slip North Anatolian Fault
Keywords: seismic network, seismic hazard, seismic risk,
Zone (NAFZ), sinistral strike-slip East Anatolian Fault Zone
Malatya Fault, Eastern Anatolia
(EAFZ) (Figure 1a). Both fault zones are mapped during
the 20th century and studied extensively since then [5–13].
Many devastating earthquakes occurred on these faults re-
sulting in several numbers of causalities and damage. In
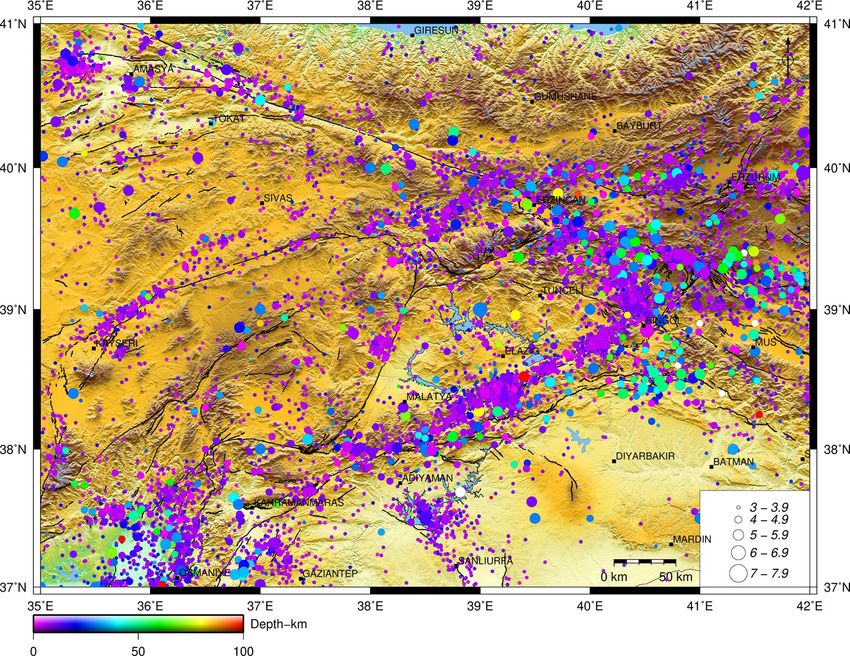
Figure 1b, seismicity between years 1900-2019 in a greater
area, can be seen. Main target region of this study, the
*Corresponding Author: Diğdem Acarel: Beykent University, Fac-
ulty of Engineering and Architecture, Civil Engineering Department, Malatya Fault, is located to the west of EAFZ covering
34396, Sarıyer, Istanbul, Turkey; Boğaziçi University, Kandilli Ob- east of the Anatolian Plate. According to studies based on
servatory and Earthquake Research Institute, 36684, Çengelköy, geodetic sensors, Anatolian Plate moves westward with
Istanbul, Turkey; Email: digdemacarel@gmail.com an insignificant amount of internal deformation -less than
*Corresponding Author: Musavver Didem Cambaz: Boğaziçi
2mm/year- [14–17] whereas geological studies and seismic
University, Kandilli Observatory and Earthquake Research Institute,
36684, Çengelköy, Istanbul, Turkey;
activity suggest the opposite, that Anatolian Plate accom-
Email: didem.samut@boun.edu.tr modates a considerable amount of deformation [18–26].
Fatih Turhan, Remzi Polat: Boğaziçi University, Kandilli Observa- The eastern half of the Anatolian Plate is dominated by
tory and Earthquake Research Institute, 36684, Çengelköy, Istanbul, several active, dextral to sinistral strike-slip faults and re-
Turkey lated pull-apart basins [15]. Several studies exist in order to
Ahu Kömeç Mutlu: Gebze Technical University, Civil Engineering
identify seismic hazard related to the intraplate deforma-
Department, 41800, Gebze/Kocaeli, Turkey
Open Access. © 2019 D. Acarel et al., published by De Gruyter. This work is licensed under the Creative Commons Attribution 4.0
License
Unauthenticated
Download Date | 2/27/20 4:25 PM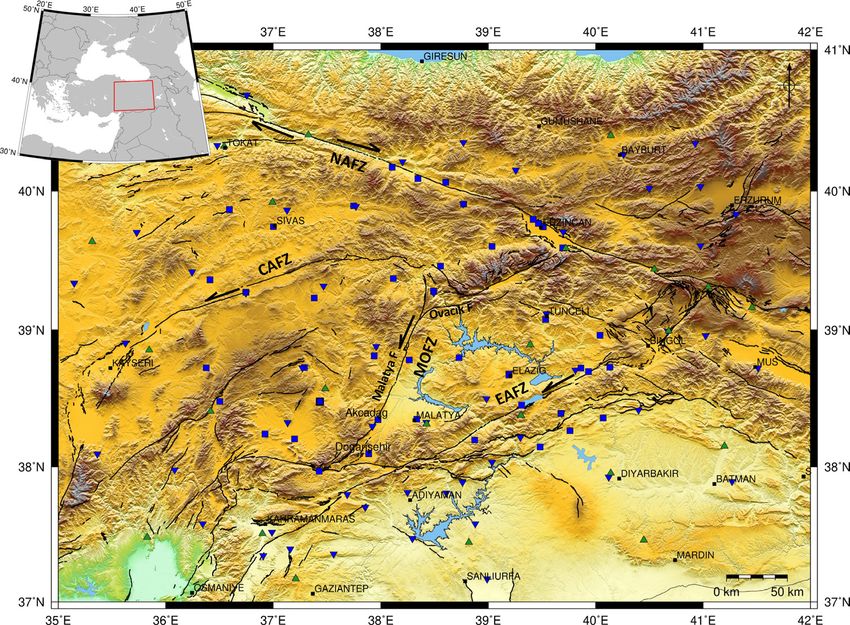
Seismotectonics of Malatya Fault, Eastern Turkey |         1099

                 (a)

                 (b)

Figure 1: a) Tectonic map of the study area. Main fault zones in the region are; NAFZ: North Anatolian Fault Zone, EAFZ: East Anatolian Fault
Zone, CAFZ: Central Anatolian Fault Zone, MOFZ: Malatya Ovacık Fault Zone. Blue inverted triangles represent seismic sensors and blue
squares represent strong motion sensors operated by AFAD. Seismic sensors operated by KOERI are shown as green triangles [35]. Black
lines represent the active faults [30]. b) Seismicity map of the study area. Earthquakes with magnitude above 3.0, between the years 1900
and 2019 are plotted. (Data provided from KOERI).

                                                                                                                      Unauthenticated
                                                                                                      Download Date | 2/27/20 4:25 PM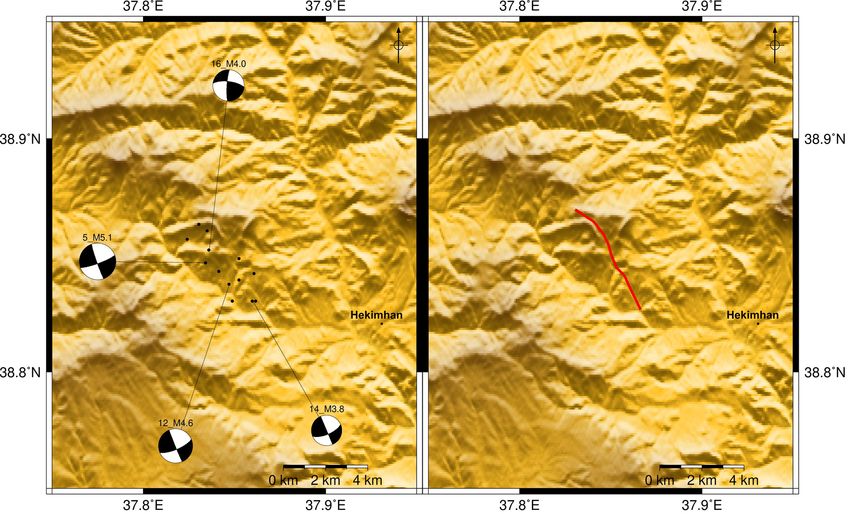
1100 | D. Acarel et al.

tion in eastern Anatolian Plate, however, studies related curred in the region; therefore, a dense sensor network is
to Malatya Ovacık Fault Zone is limited to mainly geolog- necessary to investigate such a complex and seismically
ical, morphochronological and paleoseismological stud- active landscape in order to better understand active tec-
ies [17, 27–29].                                              tonics. Moreover, precisely determined earthquake param-
     The 275 km long NE striking sinistral Malatya Ovacık eters are important not only for understanding the seis-
Fault Zone (MOFZ) is one of the most important structures micity and seismotectonics of a region but also for provid-
in Anatolian Plate since it is responsible for the initia- ing an accurate estimation of seismic hazard and risk pa-
tion and deformation within the intraplate [27–29]. The rameters. Local agencies; Kandilli Observatory and Earth-
northern branch, Ovacık Fault (OF) starts from Erzincan quake Research Institute (KOERI) [35] and Disaster and
Basin and extends to Arapgir (Malatya) of about 110 km. Emergency Management Authority Presidential of Earth-
It branches into several segments. The southern branch, quake Department (AFAD) operate seismic and strong mo-
NE striking, approx. 165 km-long Malatya Fault starts from tion sensor networks (Figure 1a). Both agencies are utiliz-
Adatepe forming a junction with OF and terminates at ing similar type of seismic sensors mostly recording at 100
Doğanşehir (Figure 1a). Malatya Fault is described in three sps. In this study, we employ seismic and strong motion
segments in [30], namely Akçadağ, Arguvan and Doğanşe- sensors mainly located in eastern Turkey. A total number
hir segments, whereas [29] defined Malatya Fault in five of 123 stations are included in earthquake hypocenter de-
segments, naming FS1 to FS5. Several authors [28, 29], sug- termination. Even though the sensor networks seem to be
gest that Malatya Fault is an active fault partly accom- robust, due to low signal to ratio waveforms or GPS clock
modating the intraplate deformation of Anatolia on the errors, some stations are not employed in the analysis.
contrary to the hypotheses of Malatya Fault being inac-
tive since mid-Pliocene [31, 32]. According to recent paleo-
seismological studies, the average earthquake interval on
Malatya Fault is 2275 ± 605 years and it may produce a
                                                              3 Estimation of crustal velocity of
M7.4 earthquake following the empirical equations of [28,         the region and surroundings
33]. Moreover, another study on the seismic potential of
Malatya Fault reports that the fault passes through Quater- In order to determine a minimum 1-D crustal velocity
nary units in some of parts of Akçadağ Segment; and thus, model for the study area, an earthquake catalog is con-
is capable to produce large earthquakes [34].                 structed. By merging the earthquake catalogs of KOERI
     In this study, we analyze datasets obtained from seis- and AFAD between 2008-2018, approximately 1000 earth-
mic and strong motion sensor networks in order to identify quakes have been compiled and revised for this study in
the seismotectonics of Malatya Fault (MF). We estimate a 1- the region (37.10∘ –39.10∘ E, 37.30∘ –39.10∘ N). Merged cat-
D crustal velocity model for the region. We have improved alogs are revised and relocated by using the earthquake
accuracy of earthquake hypocenter locations by merging location code HYPOCENTER [36].
data from two local networks and using all possible sen-          A minimum 1-D velocity model can be defined as the
sors in the region. Hypocenter locations of low-magnitude- velocity model that produces the smallest possible uni-
earthquakes cannot be determined due to limitations in form error for the set of events with well-constrained loca-
station distribution, therefore our results are constrained. tions [37]. For the identification of an optimum 1-D velocity
Nevertheless, obtained focal mechanisms and stress direc- model, a widely acknowledged software package VELEST
tions are in good agreement with the tectonics of region. code [38, 39] is used. The method simultaneously inverts P
Moreover, we identify an active morphological component, and S wave travel times for a 1-D velocity model, station de-
which is not present in the active fault map of Turkey. Thus, lays and hypocenters of earthquakes. Simply, it solves the
this study has a significant contribution to the seismic haz- forward problem by tracing direct reflected and refracted
ard assessment of a region prone to large earthquakes.        rays from source to receiver and then uses the standard
                                                              damped least squares in order to solve the inverse prob-
                                                              lem [37].
                                                                  Generally, events are selected according to the follow-
2 Data                                                        ing criteria;

Turkey, a region exhibiting an intense seismic activity (Fig-     • The number of P and S phases should be more than
ure 1b), is continuously monitored with seismic, geodetic           8 with at least one S phase,
and strong motions sensors. Several M+7 earthquakes oc-           • The azimuthal gap should be less than 180∘ ,

                                                                                                     Unauthenticated
                                                                                     Download Date | 2/27/20 4:25 PM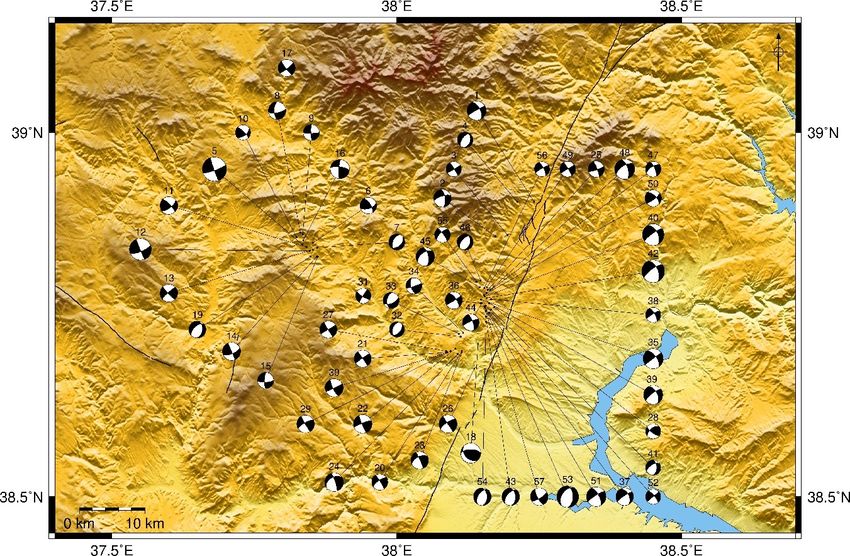
Seismotectonics of Malatya Fault, Eastern Turkey |   1101

    • The RMS residual should be less than 0.5,                         still another important parameter, focal depth, needs to be
    • The distance to nearest station is less than one focal            constrained. Several rules of thumb exist to obtain reliable
      depth.                                                            depth estimates. At least one P-wave phase is required at
                                                                        a station within a close proximity of the source, approx-
     After eliminating the earthquakes according to the
                                                                        imately 1.5 times the focal depth. In this study, the min-
given criteria, 495 earthquakes are selected for inversion.
                                                                        imum distance between the source and station-a P-wave
In the computation of final velocity model, nine iterations
                                                                        phase can be picked- is approximately 20 km, which is one
performed for each test by trying 100 different initial mod-
                                                                        broadband seismic sensor. For the rest of the sensors, min-
els. We also test a number of different starting 1-D velocity
                                                                        imum distance to source is 50 km. To determine hypocen-
models [40, 41]. Out of several iterations, using different
                                                                        ter locations, we applied NonLinLoc (Non Linear Localiza-
initial velocity models, a final velocity model chosen with
                                                                        tion), which is an absolute probabilistic localization algo-
the minimum rms value reduced to 0.35 (Table 1).
                                                                        rithm [42]. This algorithm follows the probabilistic inver-
                                                                        sion approach defined by [43], and the earthquake loca-
Table 1: Final 1-D P-wave velocity model obtained for the study area.
                                                                        tion methods of [44, 45]. Detailed information on NonLin-
                                                                        Loc can be found in [42].
   Depth (km)               VP (km/s)                VS (km/s)
                                                                              As it can be seen in Figure 2, merging data of seis-
      0.0                     4.85                     2.78
                                                                        mic and strong motion sensors from two networks, sig-
      2.0                     5.72                     3.28
                                                                        nificantly improved the hypocenter locations and the
      8.0                     5.77                     3.31
                                                                        depth resolution. Improved seismic activity focuses along
     12.0                     5.84                     3.36
                                                                        Malatya Fault (MF), mainly the southern portion of MF,
     16.0                     6.08                     3.52
                                                                        around Kızık Basin and near Hekimhan.
     20.0                     6.19                     3.57
     24.0                     6.28                     3.61
     28.0                     6.40                     3.68
     32.0                     7.40                     4.18             5 Determination of Focal
     34.0                     7.55                     4.34
     38.0                     7.84                     4.38
                                                                          Mechanisms
     42.0                     7.95                     4.52
                                                             Focal mechanism solutions are determined using a
                                                             merged dataset of waveforms from AFAD and KOERI net-
                                                             works. The number of earthquakes employed at this stage
                                                             reduced significantly due to low signal to noise ratio of
                                                             waveforms and limitations of station distribution. Wave-
4 Earthquake Hypocenter                                      form data for 57 earthquakes (M>3.2) are selected. Fo-
                                                             cal mechanisms are calculated by using an exhaustively
    Determination                                            tested and widely used ISOLA software package [46–48].
                                                             This technique utilizes an iterative deconvolution inver-
Precise hypocenter locations of earthquakes are essential
                                                             sion [49] to solve for the best single- or multiple-point
in understanding the tectonic regime in a region. In this
                                                             source representation of each earthquake. Moment ten-
study, waveforms recorded on both seismic and strong
                                                             sors are estimated by a least-squares minimization of mis-
motion sensors operated by two local networks; KOERI
                                                             fits between observed and synthetic waveforms; subevent
and AFAD are taken into account. P- and S-wave arrival
                                                             positions and relative times are calculated through grid
times of a dataset of 146 events are re-picked manually.
                                                             search [47]. In order to represent a full wavefield at re-
At this stage, re-picking of data is performed by one ex-
                                                             gional and local distances, Green’s functions are cal-
perienced person in order to provide consistency. We in-
                                                             culated using the discrete wavenumber method of [50]
cluded a re-picked data set of events with minimum 40
                                                             and [51]. Employing an accurate velocity model in compu-
P-wave (1/3 ratio S-wave) observations per event. Integrat-
                                                             tation of the Green’s function plays a crucial role in inver-
ing different kinds of sensors from two different local net-
                                                             sion process. Significance of velocity model and the cor-
works significantly reduced the azimuthal gap to 20-40 de-
                                                             responding variations are analyzed in several studies [52–
grees, which is an important parameter to provide accu-
                                                             55]. Hence, our first step was to compute a site-specific
racy. Even though the azimuthal gap is ensured to be as
                                                             model for the target region (Section 2, Table 1). Green’s
low as possible to obtain accurate hypocenter locations,
                                                             functions are estimated utilizing this local velocity model.

                                                                                                                  Unauthenticated
                                                                                                  Download Date | 2/27/20 4:25 PM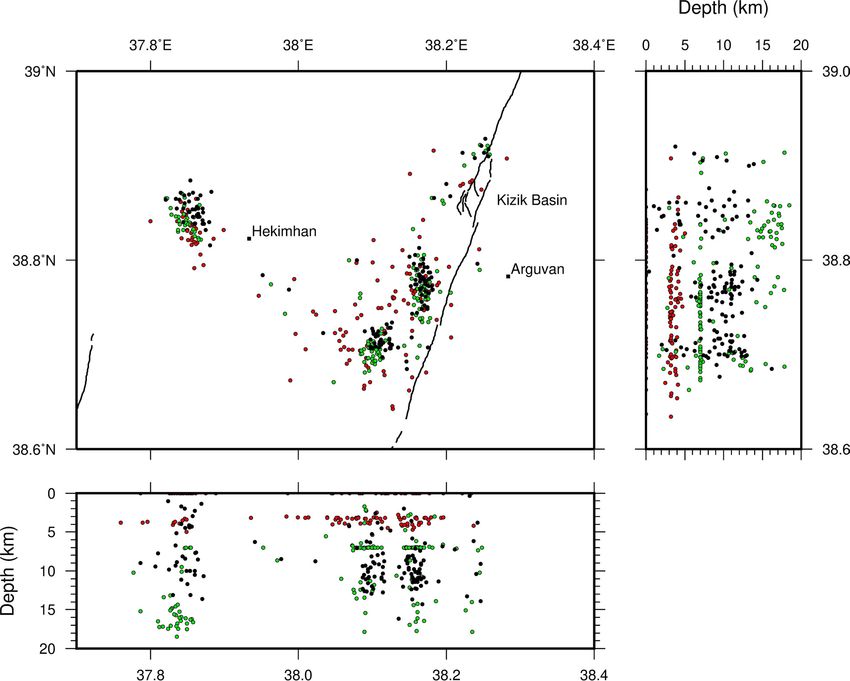
1102 | D. Acarel et al.

Figure 2: Earthquake hypocenter locations and depth cross-sections. Green dots represent hypocenter locations from AFAD catalog, red
dots represent hypocenter locations from KOERI catalog. Black dots represent the hypocenter locations re-located by combining the entire
data from KOERI and AFAD seismic networks.

     In Figure 3a, Moment Tensor (MT) solution of the M4.9
Hekimhan-Malatya earthquake and in Figure 3b observed
                                                                     6 Stress Inversion Analysis
versus synthetic waveforms can be seen. Waveform data of
                                                                     To provide a more reliable determination of the direction
17 stations from AFAD and KOERI network are merged in
                                                                     of released stress during the earthquake, we applied a
order to improve station distribution. Presented results ex-
                                                                     stress inversion method by using focal mechanism solu-
hibit a variance reduction of 0.91 and a consistent shallow
                                                                     tions obtained in the previous section. The most frequently
depth at 6.7 km (hypocentral depth) and 10.0 km (centroid
                                                                     used technique is defined by [57]. This method determines
depth).
                                                                     the orientation of three principle stress axes and aims to
     MT solutions obtained for the target region are pre-
                                                                     find the best fit between the stress tensor and observed
sented in Figure 4 (Appendix A). Moreover, the results are
                                                                     focal mechanisms. In this linear inversion method, nodal
plotted as a ternary diagram [56]. In Figure 5, the distribu-
                                                                     plane knowledge is not required. This approach performs
tion of computed focal mechanisms can be seen in a trian-
                                                                     a bootstrap re-sampling to choose fault plane randomly
gular representation. At the vertices of the triangle, mech-
                                                                     from nodal planes. The method assumes a uniform and in-
anisms with vertical T, P and B axes are plotted for thrust,
                                                                     variant stress field in space and time, and slip occurs in
normal and strike-slip faulting, respectively.
                                                                     the direction of maximum shear stress [58]. In this study,
                                                                     Michael’s method is preferred due to its appropriate esti-

                                                                                                               Unauthenticated
                                                                                               Download Date | 2/27/20 4:25 PM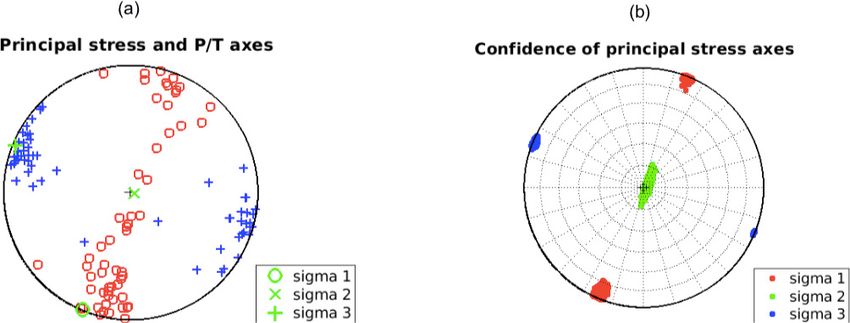
Seismotectonics of Malatya Fault, Eastern Turkey |        1103

                          (a)

                          (b)

Figure 3: a) Moment Tensor Solutions of the M4.9 Hekimhan-Malatya earthquake and b) the observed versus synthetic waveform fits.

                                                                                                                 Unauthenticated
                                                                                                 Download Date | 2/27/20 4:25 PM
1104 | D. Acarel et al.
Figure 4: Focal mechanisms of 57 earthquakes.
mate of the uncertainty and accuracy of results even with
low signal to noise ratio data.
The MT solutions are inverted to obtain the principal
stress directions and shape ratio. A STRESSINVERSE code
by [59] is used to analyze the statistical properties of focal
mechanisms with respect to tectonic stress and failure con-
ditions. The iterative stress inversion based on Michael’s
method [57] can be easily implemented with this code [59].
Stress inversion results are represented by three principal
stress axes; a "o" for σ1, a “x” symbol for σ2, and a “+” sym-
bol for σ3 (Figure 7a). The pressure (P) and tension (T) axes
are well clustered (Figure 7b). The azimuth angle is mea-
sured from north and the plunge angle from the horizon-
tal plane. The shape ratio (or stress magnitude ratio) (R)
is 0.24 and describes the relative magnitudes of the princi-
pal stresses, (R = (σ1 − σ2)/(σ1 − σ3)) [60] (Figure 5). Inver-
sion is performed in an iterative mode, by using grid search
through the principal stress and with friction ranging from
Figure 5: Ternary diagram, a graphical representation of focal mech-
0.4 to 1, in 0.05 increments. Accuracy of the stress inversion
anism orientations. The vertices of the triangle represent mech-
anisms with vertical T, P and B axes. Focal mechanism solutions
depends on the number of focal mechanisms and signal to
obtained in this study cluster around strike-slip and normal fault- noise ratio of data.
ing. The orientations of P/T axes are nearly vertical and
nearly horizontal (Figure 5), respectively, suggesting an ex-
tensional regime. In addition to this, nearly subhorizon-
Unauthenticated
Download Date | 2/27/20 4:25 PMSeismotectonics of Malatya Fault, Eastern Turkey | 1105
Figure 6: Stress inversion solutions. (a) Distribution of P-T axes orientations of individual nodal planes, (b) P and T axes shown in stereo-
graphic projection.
tal σ3 and nearly subvertical σ1 indicate the existence of terval of 2275+-605 years. They stated that another earth-
an ongoing extensional regime within the study area. This quake with a surface rupture is due. These findings are
may imply the existence of an ancient fragmented fault in good agreement with geological and morphological ev-
in the region. There are few earthquakes with pure strike idence [20, 26, 29] highlighting the Malatya Fault as an ac-
slip mechanisms however our results indicate strike-slip tive fault, partly accumulating intraplate deformation of
mechanism with a normal component. Our results coin- Anatolian Plate [17]. According to geodetic studies within
cide with [18], which suggests northeast-southwest short- the region, most of the strain accumulation due to west-
ening and corresponding northwest-southeast extension ward movement of Anatolia is accommodated by EAFZ
for the Central “ova” neotectonic province of Anatolia. Nev- rather than Malatya Fault [17].
ertheless, more comprehensive analysis needs to be per- In the light of these arguments, we analyze seismic
formed with enhanced instrumental and paleoseismolog- activity in the region between the years 2008-2019. Seis-
ical studies in the vicinity of the fault. micity mainly focuses in two zones; one along the north-
ern branch of Malatya Fault, and the second one near
Hekimhan, almost oblique to Malatya Fault. The highest
magnitude events are M5.1 occurred on 29.11.2015 (near
7 Discussion and Conclusion Hekimhan) and another event, magnitude 4.8, occurred
on 25.03.2019 (near Arguvan). We determine hypocenter lo-
In this study, seismotectonics of the Malatya Fault, eastern
cations of 146 events. In earthquake hypocenter determina-
Turkey, is investigated by using a unified dataset of local
tion, we merge datasets of seismic and strong motion sen-
agencies, KOERI and AFAD. A local crustal velocity model
sor networks in order to reduce azimuthal gap, an impor-
is estimated to be further employed in the analysis. Earth-
tant parameter to ensure accuracy. However, instrumen-
quakes in the study area are relocated in order to obtain
tal problems in sensors and low signal to noise ratio data
more precise hypocenter parameters. Moment tensor so-
limit our calculations. Focal mechanisms of only 57 events
lutions are computed utilizing these improved hypocenter
are calculated, reflecting normal and strike slip faulting.
locations. Focal mechanism solutions and stress inversion
Relatively shallow depths obtained in hypocenter determi-
results of this study depict a well recovered image of the
nations, might be an evidence of insignificant amount of
active tectonic structure in the target region.
accumulated strain. In a recent study, it is reported that
Malatya Fault, the southern branch of MOFZ, is ar-
Tohoku-Oki earthquake rupture is terminated by the seis-
gued to be the plate boundary between Anatolian and Ara-
mic activity in the adjacent segments [61]. Reliable geode-
bian Plate until the development of NAFZ and EAFZ in
tic surveys need to be conducted in this region in order to
mid-Pliocene [31] and labeled as inactive since then. In
better understand whether Malatya Fault has accumulated
a recent study, [28] found evidence of four earthquakes
any amount of strain to precisely determine the seismic
from pre-instrumental period according to their paleoseis-
risk.
mological observations in the region with a recurrence in-
Unauthenticated
Download Date | 2/27/20 4:25 PM1106 | D. Acarel et al.
Figure 7: Focal mechanisms of earthquakes with magnitude above 3.8 are plotted within the shear zone identified with respect to the
seismic activity focused near Hekimhan. Solid red line indicates the corresponding source fault of the observed seismicity.
The most striking result of this study is the identi- cal units, as expected. Another reason may be the amount
fication of a NW-SE trending deformation zone, which of data employed in this study. Limited number of earth-
becomes evident following the seismic activity near quakes and related focal mechanisms may not be enough
Hekimhan (Figure 2). In the interior parts of the Anatolian to address the state of stress in such a complex tectonic re-
Block, all tectonic regimes including such a NW-SE trend- gion.
ing one are suggested to be formed as a result of the acti- Even though the target region is monitored with a high
vation of pre-weakness belts due to the westward motion number of stations from two different networks, the results
of the Anatolian Block [18, 62]. Major shear zones such of this study are mainly constrained by the limitations of
as the Malatya Ovacık Fault, are often associated with a sensor networks along the Malatya Fault. Moreover, there
structural pattern of faults arranged as en échelon [63, 64]. is not any consensus on the active tectonic regime of the
The observed seismicity may be related to an anti Riedel region. Therefore, it is necessary to increase the density of
structure within the shear zone of the Malatya Fault (Fig- the station distribution along this fault and analyze the re-
ure 7). The solid red line in Figure 7 may be good candi- gion in more detail. The results of this study underline the
date for the source fault of these seismic events, which importance of deploying dense networks of different types
also makes a lineament on the morphology. As a prop- of sensors to monitor earthquake prone regions as well as
erty of anti Riedel structures, a dextral strike-slip move- providing maintenance of these sensors regularly. Despite
ment is expected [18], since the kinematics of the princi- all limitations, defining an active morphological element,
pal displacement zone is sinistral. According to the results which is not included in recent active fault map of Turkey,
of shear-box experiments of [63], the inclination of anti prove to be noteworthy for seismic risk assessment of the
Riedel shears is approximately 78∘ . We determine an in- target region. More detailed studies on the geological and
clination of 55-60∘ of the observed anti Riedel structure morphological evidence of this deformation zone need to
(Figure 7). There may be several reasons of this low incli- be conducted.
nation angle. Tchalenko [63] performed these experiments
using homogeneous kaolin clay whereas the study region Acknowledgement: Data used in this study can be ob-
consists of highly heterogeneous distribution of geologi- tained from Kandilli Observatory and Earthquake Re-
Unauthenticated
Download Date | 2/27/20 4:25 PMSeismotectonics of Malatya Fault, Eastern Turkey | 1107
search Institute (KOERI; http://eida.koeri.boun.edu.tr, [10] Barka A.A., The North Anatolian fault zone. Annales Tectonicae,
last accessed December 2019) and Disaster and Emer- 1992, VI suppl., 164-195
[11] Barka A.A., Slip distribution along the North Anatolian fault as-
gency Management Authority Presidential of Earth-
sociated with the large earthquakes of the period 1939 to 1967.
quake Department (AFAD; http://tdvm.afad.gov.tr, last
Bulletin of the Seismological Society of America, 1996, 86, 5,
accessed December 2019). Some of the figures are 1238-1254
prepared using the Generic Mapping Tools v.4.2.1, [12] Şengör A.M.C., Tüysüz O., İmren C., Sakınç M., Eyidoğan H.,
(www.soest.hawaii.edu/gmt, last accessed December Görür N., Le Pichon X., Rangin C., The North Anatolian Fault:
2019; Wessel and Smith, 1998). We are grateful to Esen A New Look. Annu. Rev. Earth Planet. Sci., 2005, 33, 37-112,
doi:10.1146/annurev.earth.32.101802.120415
Arpat for valuable discussions on the geology and interpre-
[13] Öztürk S., Earthquake hazard potential in the Eastern Anatolian
tation of results. We would like to thank Cengiz Zabcı for region of Turkey: seismotectonic b and Dc-values and precursory
fruitful comments on the geology of the region. We would quiescence Z-value. Front. Earth Sci., 2018, 12(1), 215-236
like to thank four anonymous reviewers and Krzysztof [14] McClusky S., Balassanian S., Barka A., Demir C., Ergintav S.,
Gaidzik for their constructive comments that helped to im- Georgiev I., Gurkan O., Hamburger M., Hurst K., Kahle H., Kastens
K., Kekelidze G., King R., Kotzev V., Lenk O., Mahmoud S., Mishin
prove the manuscript. Musavver Didem Cambaz acknowl-
A., Nadariya M., Ouzounis A., Paradissis D., Peter Y., Prilepin
edges to Boğaziçi University, Scientific Research Projects
M., Reilinger R., Sanli I., Seeger H., Tealeb A., Toksöz M.N., Veis
(BAP) 9401P for supporting part of this work. Diğdem G., Global positioning system constraints on plate kinematics
Acarel would like to thank the Scientific Council of Turkey and dynamics in the eastern Mediterranean and Caucasus. J.
(TUBITAK) for funding within the project 117C009. Geophys. Res., 2000, 105, 5695–5719
[15] Reilinger R., McClusky S., Vernant P., Lawrence S., Ergintav
S., Cakmak R., Özener H., Kadirov F., Guliev I., Stepanyan R.,
Nadariya M., Hahubia G., Mahmoud S., Sakr K., ArRajehi A.,
References Paradissis D., al-Aydrus A., Prilepin M., Guseva T., Evren E.,
Dmitrotsa A., Filikov S.V., Gomez F., al-Ghazzi R., Karam G.,
GPS constraints on continental deformation in the Africa-Arabia-
[1] Fukushima Y., Toda S., Miura S., Ishimura D., Fukuda J., Demachi
Eurasia continental collision zone and impli- cations for the dy-
T., Tachibana K., Extremely early recurrence of intraplate fault rup-
namics of plate interactions. J. Geophys. Res., 2006 111, B05411,
ture following the Tohoku-Oki earthquake. Nature Geoscience,
https://doi.org/10.1029/2005jb004051
2018, 11, 777-781, doi:10.1038/s41561-018-0201-x
[16] Özener H., Arpat E.,Ergintav S., Doğru A., Çakmak R., Turgut B.,
[2] Kanamori H., Allen CR., Earthquake repeat time and average
Doğan U., Kinematics of the eastern part of the North Anatolian
stress drop. In: Das S., Boatwright J., Scholz C.H. (Eds.), Earth-
Fault Zone. Journal of Geodynamics, 2010, 49, 141-150
quake Source Mechanics, Geophys. Monogr., Washington, DC:
[17] Aktuğ B., Diken U., Doğru A., Özener H., Seismicity and strain
Am. Geophys. Union, 1986, 227-35
accumulation around Karliova Triple Junction (KTJ). Journal of
[3] Ramirez-Herrera M.T., Corona N., Ruiz-Angolo A., Melgar D.,
Geodyn., 2013, 67, 21-29
Zavalo-Hidalgo J., The 8 September 2017 Tsunami Triggered by
[18] Şengör A.M.C., Görür N., Şaroğlu F., Strike slip faulting and re-
the M8.2 Intraplate Earthquake, Chiapas, Mexico. Pure and Ap-
lated basin formations in zones of tectonic escape: Turkey as a
plied Geophysics, 2018, 175, 25-34
case study. In: Biddle K.T., Christie-Blick N. (Eds.), Strike- slip
[4] Rizza M., Ritz J.F., Prentice C., Vassallo R., Braucher R., Lar-
faulting and basin formation. Society of Economic Paleontolo-
roque C., Arzhannikova A., Arzhannikov S., Mahan S., Mas-
gists and Mineralogists, Tulsa, Oklahoma, special publication
sault M., Michelot J.L., Todbileg M., ASTER Team., Earth-
1985, 37, 227–264
quake Geology of the Bulnay Fault (Mongolia). Bulletin of
[19] Koçyiğit A., Beyhan A., A new intra-continental transcurrent struc-
the Seismological Society of America, 2015, 105 (1), 72-93,
ture: the central Anatolian fault zone, Turkey. Tectonophysics,
https://doi.org/10.1785/0120140119
1998, 284, 317–336
[5] Ketin İ., Ub̈er die tektonisch-mechanischen Folgerungen aus den
[20] Kaymakçı N., İnceöz M., Ertepınar P., 3D-architecture and neo-
grossen anatolischen Erdbeben des letzten Dezenniums. Geol.
gene evolution of the Malatya Basin: inferences for the kinemat-
Rund., 1948, 36, 77–83
ics of the Malatya and Ovacık Fault zones. Turkish Journal of Earth
[6] Arpat E., Şaroğlu F., The East Anatolian Fault System: thoughts
Sciences, 2006, 15, 123-154
on its development. Bulletin of the Mineral Research and Explo-
[21] Akyuz H.S., Ucarkus G., Altunel E., Dogan B., Dikbas A., Paleo-
ration (MTA), 1972, 78, 33-39
seismological investigations on a slow-moving active fault in
[7] Ambraseys N.N., Some characteristic features of the Anatolian
Central Anatolia, Tecer Fault, Sivas. Ann. Geophys., 2013, 55(5),
Fault Zone. Tectonophysics, 1970, 9, 143–165
doi:10.4401/ag-5444
[8] Arpat E., Şaroğlu F., Recent tectonic activities in Turkey. Bulletin
[22] Yıldırım C., Relative tectonic activity assessment of the Tuz Gölü
of the Geological Society of Turkey, 1975, 18, 91-101 (in Turkish
fault zone; Central Anatolia, Turkey. Tectonophysics, 2014, 630,
with English abstract)
183–192, https://doi.org/10.1016/j.tecto.2014.05.023
[9] Şengör A.M.C., The North Anatolian transform fault its age, offset
[23] Yıldırım C., Sarıkaya M.A., Çiner A., Late Pleistocene intraplate
and tectonic significance. J. Geol. Soc. London, 1979, 136, 269–
extension of the central Anatolian plateau, Turkey: inferences
282
from cosmogenic exposure dating of alluvial fan, landslide, and
moraine surfaces along the Ecemiş fault zone. Tectonics, 2016,
Unauthenticated
Download Date | 2/27/20 4:25 PM1108 | D. Acarel et al.
35, 1446–1464, https://doi.org/10.1002/2015TC004038 [41] Gökalp H., Local earthquake tomography of the Erzincan Basin
[24] Sarıkaya M.A., Yıldırım C., Çiner A., No surface breaking on the and the surrounding area in Turkey. Annals of Geophysics, 2007,
Ecemiş fault, Central Turkey, since Late Pleistocene (~64.5 ka); 50, 707-724
new geomorphic and geochronologic data from cosmogenic dat- [42] Lomax A., Curtis A., Fast, probabilistic earthquake location in
ing of offset alluvial fans. Tectonophysics, 2015, 649, 33–46, 3D models using oct-tree importance sampling. Geophys. Res.
https://doi.org/10.1016/j.tecto.2015.02.022 Abstr., 2001, 3, 955
[25] Higgins M., Schoenbohm L.M., Brocard G., Kaymakci N., Gosse [43] Tarantola A., Vallette B., Inverse problems = quest for informa-
J.C., Cosca M.A., New kinematic and geochronologic evidence tion. J. Geophys., 1982, 5, 159-170
for the quaternary evolution of the central Anatolian fault zone [44] Moser T.J., van Ech T., Nolet G., Hypocenter determination in
(CAFZ). Tectonics, 2015, 34, 2118–2141, https://doi.org/10.1002/ strongly heterogeneous earth models using the shortest path
2015TC003864 method, J. Geophys. Res., 1992, 97, 6536-6572
[26] Yazıcı M., Zabcı C., Sançar T., Natalin B.A., The role of intraplate [45] Wittlinger G., Herquel G., Nakache T., Earthquake location in
strike-slip faults in shaping the surrounding morphology: the strongly heterogeneous media, Geophys. J. Int., 1993, 115, 759-
Ovacık fault (eastern Turkey) as a case study. Geomorphology, 777
2018, 321, 129–145 [46] Sokos E., Zahradnik J., A MATLAB GUI for Use with ISOLA Fortran
[27] Taşgın C.K., Seismically generated hydroplastic deformation Codes User’s Guide, 2006, http://seismo.geology.upatras.gr/
structures in the Late Miocene lacustrine deposits of the Malatya isola/.
Basin, Eastern Turkey. Sedimentary Geology, 2011, 235, 264-276 [47] Sokos E., Zahradník J., ISOLA a Fortran code and a Matlab GUI to
[28] Sançar T., Zabci C., Karabacak V., Yazici M., Akyüz H.S., Geometry perform multiple-point source inversion of seismic data. Comput.
and Paleoseismology of the Malatya Fault (Malatya-Ovacik Fault Geosci. 2008, 34, 967-977, http://dx.doi.org/10.1016/j.cageo.
Zone), Eastern Turkey: Implications of intraplate deformation of 2007.07.005
the Anatolian Scholle. J. Seismol, 2019, 23, 319-349 [48] Sokos E., Zahradník J., Evaluating centroid-moment tensor un-
[29] Sançar T., Zabci C., Akçar N., Karabacak V., Yeşilyurt S., Yazıcı M., certainty in the new version of ISOLA software. Seis. Res. Lett.,
Akyüz H. S., Öztüfekçi Ö.A., Ivy-Ochs S., Christl M., Vockenhu- 2013, 84, 656-665, http://dx.doi.org/10.1785/0220130002
ber, C., Geodynamic Importance of the Strike-Slip Faults at the [49] Kikuchi M., Kanamori H., Inversion of complex body waves-III.
Eastern Part of the Anatolian Scholle: Inferences from the Uplift Bull. Seismol. Soc. Am., 1992, 81, 2335–2350
and Slip Rate of the Malatya Fault (Malatya-Ovacık Fault Zone). [50] Bouchon M., A simple method to calculate Green’s functions for
Journal of Asian Earth Sciences, 2020, (in press) elastic layered media. Bull. Seismol. Soc. Am., 1981, 71, 959–971
[30] Emre Ö., Duman T.Y., Özalp S., Elmacı H., Olgun Ş., Şaroğlu F., Ac- [51] Coutant O., Program of numerical simulation AXITRA. Tech. rep.,
tive Fault Map of Turkey, General Directorate of Mineral Research LGIT, Grenoble, France, 1989
and Exploration, Ankara, Türkiye, 2013 [52] Fojtikova L., Zahradnik J., A new strategy for weak events in
[31] Westaway R., Arger J., Kinematics of the Malatya-Ovacık fault sparse networks: the first-motion polarity solutions constrained
zone. Geodin. Acta, 2001, 14, 103–131 by single-station waveform inversion. Seism. Res. Lett., 2014,
[32] Westaway R., Demir T., Seyrek A., Geometry of the Turkey- Arabia 85, 1265-1274
and Africa-Arabia plate boundaries in the latest Miocene to mid- [53] Dias F., Zahradník J., Assumpcao M., Path-specific, dispersion-
Pliocene: the role of the Malatya-Ovacık fault zone in eastern based velocity models and moment tensors of moderate events
Turkey. eEarth, 2008, 3, 27–35 https://doi.org/10.5194/ee-3-27- recorded at few distant stations: Examples from Brazil and
2008 Greece. Journal of South American Earth Sciences, 2016, 71, 344-
[33] Wells D.L., Coppersmith K.J., New empirical relationships among 358
magnitude, rupture length, rupture width, rupture area, and sur- [54] Turhan F., Cambaz M.D., Zahradník J., The significance of the
face displacement. Bull. Seismol. Soc. Am., 1994, 84, 974–1002 crustal velocity model in moment tensor solutions: A case study
[34] Okuyucu S., Erdag D.S., Geology and Neotectonics of Akcadag- of Yedisu earthquakes. In: D’Amico S. (Ed.), Moment Tensor So-
Ören (Malatya) Section. Abstracts of the 70th Geological lutions - A Useful Tool for Seismotectonics, Springer Natural
Congress of Turkey, 2017, 594-595 Hazards. Springer, Cham, 2018, 557-572
[35] Boğaziçi University, Kandilli Observatory and Earthquake Re- [55] Carvalho J., Barros L.V., Zahradnik J., Inversion for focal mecha-
search Institute: International Federation of Digital Seismograph nisms using waveform envelopes and inaccurate velocity models:
Networks, Dataset/Seismic Network, https://doi.org/10.7914/ Examples from Brazil. Bull. Seism. Soc. Am., 2018, 109, 1, 138–
SN/KO, 2001 151
[36] Havskov J., Ottemöller L., SeisAn Earthquake analysis software. [56] Frohlich C., Triangle diagrams: ternary graphs to display similar-
Seis. Res. Lett., 1999, 70 ity and diversity of earthquake focal mechanisms. Physics of the
[37] Kissling E., Geotomography with local earthquake data. Reviews Earth and Planetary Interiors, 1992, 75, 193–198
of Geophysics, 1988, 26, 659-698 [57] Michael A., Use of focal mechanisms to determine stress: a
[38] Kissling E., Ellsworth W.L., Eberhart-Philips D., Kradolfer U., Ini- control study. J. Geophys. Res., 1987, 92(B1), 357-369, http:
tial reference models in seismic tomography. J. Geophys. Res., //dx.doi.org/10.1029/JB092iB01p00357
1994, 99, 19635-19646 [58] Delvaux D., Barth A., African stress pattern from formal inversion
[39] Kissling E., Kradolfer U., Maurer H., VELEST User’s Guide, 1995 of focal mechanism data. Tectonophysics, 2010, 482, 1, 105-128,
[40] Cambaz M.D., Karabulut H., Love-wave group velocity maps of doi: 10.1016/j.tecto.2009.05.009
Turkey and surrounding regions. Geophys. J. Int., 2010, 181, 502– [59] Vavryčuk V., Iterative joint inversion for stress and fault orienta-
520 tions from focal mechanisms. Geophys. J. Int., 2014, 199, 69–77,
doi: 10.1093/gji/ggu224
Unauthenticated
Download Date | 2/27/20 4:25 PMSeismotectonics of Malatya Fault, Eastern Turkey | 1109
[60] Gephart J.W., Forsyth D.W., An improved method for determining [62] Şengör A.M.C., Zabcı C., The North Anatolian Fault and the North
the regional stress tensor using earthquake focal mechanism Anatolian Shear Zone. In: Kuzucuoğlu C., Çiner A., Kazancı N.
data: Application to the San Fernando Earthquake Sequence. (Eds.), Landscapes and Landforms of Turkey. World Geomorpho-
Journal of Geophysical Research Atmospheres, 1984, 89, 2177- logical Landscapes. Springer, Cham, 2019, 481-494
2180, doi: 10.1029/JB089iB11p09305 [63] Tchalenko J.S., Similarities between shear zones of different
[61] Nishikawa T., Matsuzawa T., Ohta K., Uchida N., Nishimura T., Ide magnitudes, GSA Bulletin, 1970, 81(6), 1625-1640
S., The slow earthquake spectrum in the Japan Trench illuminated [64] Dresen G., Stress distribution and the orientation of Riedel
by the S-net seafloor observatories. Science, 2019, 365, 808-813 shears. Tectonophysics, 1991, 188, 3-4, 239-247
Unauthenticated
Download Date | 2/27/20 4:25 PM1110 | D. Acarel et al.
Appendix A
Table A1: Final MT solutions
No. Date Time Lat (∘ N) Lon (∘ E) M Depth (km) Mw Nodal Plane 1
Hypocenter Centroid Strike (∘ ) Dip (∘ ) Rake (∘ )
1 10.26.2015 04:43:28 38.9053 38.2407 4.0 10.39 7.0 3.8 240 86 −32
2 10.26.2015 09:00:32 38.8577 38.1729 3.7 11.47 7.0 3.6 352 65 −157
3 10.26.2015 09:11:53 38.8596 38.1949 3.2 6.87 6.0 3.2 329 85 177
4 11.27.2015 03:12:18 38.9053 38.2114 3.3 7.26 7.0 3.4 15 34 −108
5 11.29.2015 00:28:07 38.8467 37.8342 5.1 6.73 10.0 4.9 160 86 −171
6 11.29.2015 01:46:19 38.8486 37.8525 3.5 4.13 6.0 3.4 327 67 147
7 11.29.2015 08:28:57 38.8422 37.8607 3.4 7.68 8.0 3.3 50 43 −71
8 11.29.2015 17:34:34 38.8632 37.8305 3.7 13.13 10.0 3.4 180 62 −158
9 11.29.2015 22:06:29 38.8605 37.8351 3.4 5.14 8.0 3.2 178 86 −171
10 12.1.2015 11:08:43 38.8568 37.8241 3.2 1.03 7.0 3.1 54 53 16
11 12.1.2015 15:38:57 38.8431 37.8415 3.7 11.13 6.0 3.6 318 78 158
12 12.9.2015 09:03:33 38.8376 37.847 4.6 4.48 8.0 4.2 158 88 −163
13 12.9.2015 10:13:05 38.8394 37.8525 3.7 4.33 8.0 3.4 137 83 172
14 12.21.2015 05:49:33 38.8303 37.8598 3.8 10 7.0 3.6 157 90 −158
15 1.20.2016 10:34:17 38.8303 37.8616 3.4 7.65 10.0 3.3 182 77 −161
16 2.2.2016 14:21:15 38.8522 37.836 4.0 8.88 8.0 3.7 184 81 159
17 2.4.2016 16:34:44 39.0884 37.8067 3.6 9.46 9.0 3.3 143 81 −172
18 8.17.2016 01:07:01 38.7103 38.1427 4.2 2.01 3.0 4.0 135 38 127
19 10.31.2016 13:23:30 38.8303 37.8488 3.6 10 6.0 3.4 8 40 −122
20 1.31.2017 07:17:09 38.7003 38.1143 3.4 9.51 4.0 3.4 327 83 −161
21 2.2.2017 15:11:46 38.6984 38.0869 3.6 12.3 4.0 3.7 325 89 −175
22 2.3.2017 06:33:33 38.7039 38.1033 3.9 10.74 4.0 3.8 157 85 172
23 2.4.2017 04:42:43 38.6984 38.1143 3.7 7.75 4.0 3.7 243 55 −6
24 2.8.2017 04:30:41 38.6966 38.107 3.9 8 4.0 3.8 342 79 −135
25 5.13.2017 01:04:09 38.7845 38.1601 3.4 11.32 8.0 3.3 338 80 172
26 5.25.2017 02:58:50 38.6765 38.1363 3.8 9.51 3.0 3.7 146 89 163
27 7.9.2017 05:08:15 38.7003 38.0869 3.6 9.37 4.0 3.6 149 86 179
28 10.11.2017 06:06:49 38.7607 38.1711 3.2 6.43 5.0 3.2 229 55 21
29 6.18.2018 05:12:25 38.7003 38.0942 3.7 10.1 5.0 3.5 150 87 167
30 6.21.2018 00:33:52 38.6984 38.0887 3.8 10.49 4.0 3.7 154 78 −177
31 7.21.2018 22:40:40 38.7762 37.9413 3.2 6.31 4.0 3.3 122 80 176
32 10.9.2018 15:32:02 38.7204 38.1125 3.2 11.03 4.0 3.2 43 48 −73
33 10.20.2018 01:23:30 38.7241 38.1088 3.4 9.17 5.0 3.3 66 59 −51
34 12.19.2018 22:33:30 38.7259 38.1161 3.4 8.78 8.0 3.4 71 84 −32
35 2.5.2019 05:17:58 38.7708 38.1482 4.2 8.12 5.0 3.9 233 90 −27
36 2.5.2019 13:55:40 38.7662 38.1473 3.6 8.39 5.0 3.5 58 87 26
37 2.10.2019 06:54:56 38.7534 38.1619 3.7 10.93 4.0 3.6 236 82 −42
38 3.21.2019 03:48:44 38.7717 38.1656 3.2 11.91 6.0 3.3 331 70 −169
39 3.21.2019 05:25:32 38.7662 38.1619 4.0 10.3 5.0 3.8 232 75 −38
40 3.21.2019 05:51:07 38.7753 38.1546 4.5 11.03 5.0 4.2 234 80 −36
41 3.22.2019 01:36:08 38.757 38.1656 3.2 9.07 5.0 3.2 359 51 −135
42 3.25.2019 11:29:22 38.7735 38.1583 4.8 7.12 6.0 4.7 234 72 −36
43 3.25.2019 13:53:00 38.7479 38.1564 3.7 8.44 4.0 3.7 356 44 −125
44 3.26.2019 01:05:57 38.7662 38.1491 3.5 9.86 4.0 3.5 340 71 −172
45 3.27.2019 00:29:16 38.7881 38.1454 3.9 8.68 4.0 3.8 350 63 −135
46 3.27.2019 00:31:27 38.7973 38.1473 3.4 9.07 5.0 3.4 14 39 −111
47 3.28.2019 03:32:53 38.7799 38.1573 3.3 8.85 6.0 3.3 337 72 −150
48 3.28.2019 04:19:21 38.7845 38.1638 4.2 10.88 5.0 4.0 342 64 −149
49 3.28.2019 11:28:23 38.7881 38.1583 3.3 11.42 7.0 3.3 328 84 −179
50 4.7.2019 17:47:08 38.7772 38.1528 3.5 12.4 5.0 3.4 53 77 30
51 4.8.2019 17:38:18 38.7616 38.1537 4.1 5.82 6.0 4.1 332 67 −168
52 4.12.2019 04:55:35 38.7625 38.1564 3.2 11.08 6.0 3.2 320 75 180
Unauthenticated
Download Date | 2/27/20 4:25 PMSeismotectonics of Malatya Fault, Eastern Turkey | 1111
Table A1: ...continued
No. Date Time Lat (∘ N) Lon (∘ E) M Depth (km) Mw Nodal Plane 1
Hypocenter Centroid Strike (∘ ) Dip (∘ ) Rake (∘ )
53 4.15.2019 04:41:28 38.7607 38.1546 4.6 8.05 4.0 4.4 360 50 −113
54 4.17.2019 01:45:52 38.7405 38.1564 3.7 11.18 4.0 3.6 357 44 −119
55 4.17.2019 20:37:10 38.7955 38.14 3.3 10.98 5.0 3.3 227 63 −13
56 4.19.2019 08:54:21 38.7872 38.1537 3.2 10.81 7.0 3.1 333 71 −171
57 4.19.2019 23:10:35 38.7552 38.1564 3.7 9.81 4.0 3.6 153 73 −163
Unauthenticated
Download Date | 2/27/20 4:25 PMYou can also read