Selection and Characteristics of the Dragonfly Landing Site near Selk Crater, Titan - IOPscience
←
→
Page content transcription
If your browser does not render page correctly, please read the page content below
The Planetary Science Journal, 2:24 (13pp), 2021 February                                                                  https://doi.org/10.3847/PSJ/abd08f
© 2021. The Author(s). Published by the American Astronomical Society.

    Selection and Characteristics of the Dragonfly Landing Site near Selk Crater, Titan
         Ralph D. Lorenz1 , Shannon M. MacKenzie1 , Catherine D. Neish2,3 , Alice Le Gall4 , Elizabeth P. Turtle1                                    ,
            Jason W. Barnes5 , Melissa G. Trainer6 , Alyssa Werynski2, Joshua Hedgepeth2, and Erich Karkoschka7
                                 1
                                 Johns Hopkins University Applied Physics Laboratory 1001 Johns Hopkins Road, Laurel, MD 20723, USA
                                           2
                                             Department of Earth Sciences, The University of Western Ontario, London, Canada
                                                           3
                                                             The Planetary Science Institute, Tucson, AZ, USA
                                       4
                                         LATMOS/IPSL, UVSQ Université Paris-Saclay, Sorbonne Université, CNRS, Paris, France
                                               5
                                                 Department of Physics, University of Idaho, Moscow, ID 83844-0903, USA
                                                       6
                                                         NASA Goddard Space Flight Center, Greenbelt, MD, USA
                                             7
                                               Lunar and Planetary Laboratory, The University of Arizona, Tucson, AZ, USA
                             Received 2020 September 21; revised 2020 November 30; accepted 2020 December 2; published 2021 February 8

                                                                               Abstract
             The factors contributing to the initial selection of a dune site near the Selk impact structure on Titan as the first
             landing site for the Dragonfly mission are described. These include arrival geometry and aerodynamic/
             aerothermodynamic considerations, illumination, and Earth visibility, as well as the likely presence of exposed
             deposits of water-rich material, potentially including materials where molten ice has interacted with organics.
             Cassini observations of Selk are summarized and interpreted: near-infrared reflectance and microwave emission
             data indicate water-rich materials in and around the crater. Radar topography data shows the rim of Selk to have
             slopes on multi-km scales reaching only ∼2° degrees, an order of magnitude shallower than early photoclinometric
             estimates.
             Unified Astronomy Thesaurus concepts: Saturnian satellites (1427)

                                     1. Introduction                                     intended to offer a comprehensive or final interpretation of
                                                                                         Cassini data of the Selk region, but rather to motivate more
   Dragonfly is a relocatable lander destined for Titan (Lorenz
                                                                                         detailed studies.
et al. 2018; Turtle et al. 2018) selected in 2019 as the fourth
mission in NASA’s New Frontiers Program. Exploiting Titan’s
dense atmosphere and low gravity, Dragonfly uses a multi-rotor                                                   1.1. Requirements
mobility system to explore diverse sites over tens to hundreds
of kilometers.                                                                              The scientific goals above for Dragonfly indicate desired
   The scientific motivation for Dragonfly is to determine the                             aspects of the destination region. As discussed in Lorenz
composition of surface materials where prebiotic chemistry is                            (2019), the provision of mobility permits partial decoupling of
expected to be most advanced. Of particular interest are                                 the scientific desirability of a target site from the topographic
cryolava flows or in impact melt deposits. Laboratory studies                             features of a site for safe landing. An obvious implicit
have shown that Titan haze analogs quickly hydrolyze to yield                            requirement for a successful mission is that safe landing terrain
known building blocks of life, such as amino acids and                                   exists. Precedent from lunar and Mars exploration (e.g.,
nucleobases (e.g., Neish et al. 2008, 2009, 2010). Neish et al.                          Golombek et al. 2003) argues that characteristics defining
(2018) note that impact melts will likely have encountered                               safety are slopes less than 10°–15°, and a low probability of
higher temperatures (273 K and above) than cryolava deposits                             encountering obstacles (“rocks”) on a lander scale (∼1 m).
(perhaps little higher than 176 K). Chemical kinetics would                              Geological analogy suggests that dune fields are highly
lead to orders of magnitude higher reaction rates, and thus                              probable to satisfy these criteria. While steeper slopes can
much richer prebiotic synthesis, in the impact melt case.                                obviously exist on dune slip faces, these are readily detected
   The present paper lays out the geometrical aspects of                                 and avoided, and interdune flats are ideal for landing as sand
Dragonfly’s arrival which defined the accessible area on Titan                             may partly mantle any gullies or rocks. It may be recalled that
and why the Selk impact structure and nearby dune fields were                             mantling was considered a reassuring consideration in Viking
selected as the most promising scientific targets. The Cassini                            landing site definition, as being likely to diminish crater or
data available on Selk and its environs are summarized, and                              other slopes, e.g., Masursky & Crabill (1976). Another implicit,
how this information was used during Dragonfly’s initial                                  but notable, constraint is that adequate data exist at a candidate
formulation and Phase A study (2016–2019) to define the                                   landing site to assert it as being suitable—it should be
initial landing site. It should be recognized that the Dragonfly                          remembered that Titan radar coverage at 1 km resolution or
mission is still undergoing detailed definition (Phase B) and                             better only amounts to about 40% of the surface, and other
some minor details, such as the exact dimensions and position                            Titan data sets are even more limited.
of the landing ellipse, are subject to ongoing and future                                   The limited available resolution of remote sensing data at
refinement. It should be understood also that this paper is not                           Titan puts landing site identification at Titan today on a
                                                                                         somewhat analogous footing as the identification of the Viking
                 Original content from this work may be used under the terms
                                                                                         lander sites in 1976, e.g., Stooke (2012): large scale landforms
                 of the Creative Commons Attribution 4.0 licence. Any further            can be identified and the relevant geological processes
distribution of this work must maintain attribution to the author(s) and the title       deduced, but the lander-scale terrain characteristics must be
of the work, journal citation and DOI.                                                   estimated by geological analogy and with some limited

                                                                                     1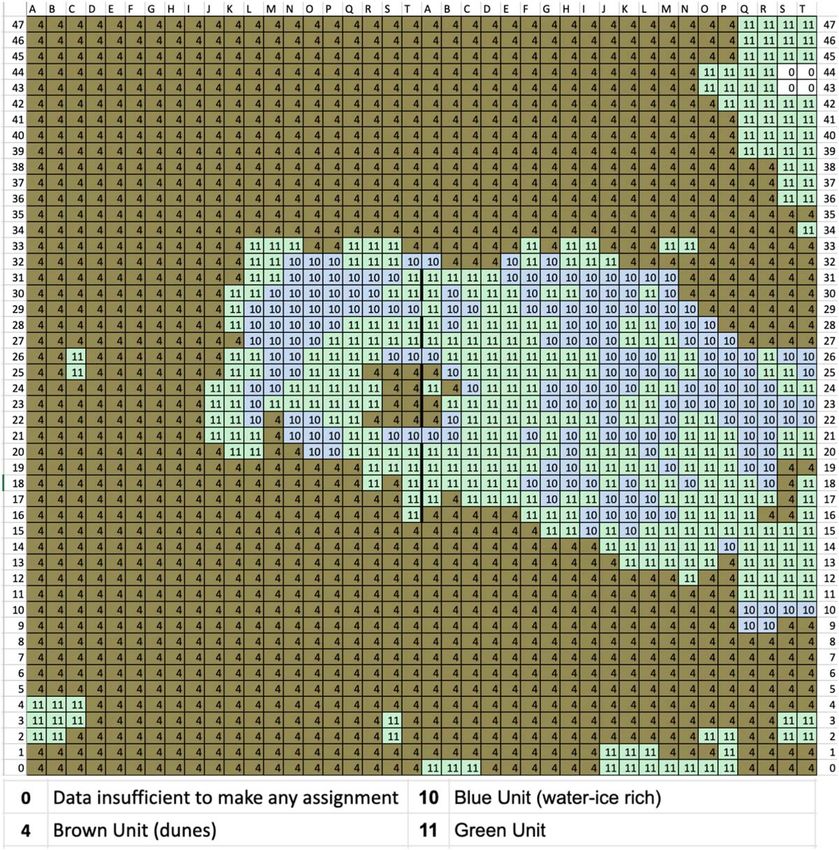
The Planetary Science Journal, 2:24 (13pp), 2021 February                                                                                                     Lorenz et al.

Figure 1. (a) Phase A interplanetary trajectory with launch in 2025 and Titan arrival in 2034. The launch date has since been prescribed to be 2027, although the
arrival date and conditions remain the same. (b) Titan arrival in a Saturn-fixed frame (the arrival direction thus is now rotated relative to (a) as the vector difference of
the interplanetary heliocentric arrival velocity and Saturn’s orbital velocity). The vehicle is aimed at the trailing hemisphere of Titan, to minimize the entry velocity.
The resultant arrival direction defines the hemisphere accessible to Dragonfly.

Figure 2. Schematic illustration of the combined delivery constraints. Given the incoming direction on a given epoch, the aerodynamic/aerothermodynamic
constraints define a toroidal region where the flight path angle is in an allowable range. To perform descent while in Earth communication and with illumination
requires being on the dayside at entry. Requiring a period of some days on the ground before sunset eliminates the late afternoon sliver of the daylight region. The
logical AND combination of the entry and illumination constraints defines the accessible region for that entry epoch. The accessible regions for a range of arrival
epochs (defined by the allowable Titan-relative entry velocity) can be combined in a logical OR sense to yield the ultimate set of possible target locations.

quantitative constraints from radar data and scattering models.                             There are geometric constraints associated with any specific
Although some large rocks proved to exist at both sites, e.g.,                           mission opportunity, specifically landing date. Landing during
“Big Joe” near Viking 1, and Viking 2 had one landing foot                               polar winter places severe restriction on science operations that
somewhat perched, both Vikings landed successfully. The                                  might require illumination (notably, mobility) (Barnes et al.
contemporary Mars site selection process (e.g., Golombek et al.                          2020), and prevents direct-to-Earth communication and so
2003) exploits global high-resolution high-precision data sets                           would require a much more expensive architecture with a relay
on slope, topographic roughness, rock abundance etc. which                               spacecraft. In the context of the New Frontiers 4 competition,
are simply not available for Titan until a future orbiter mission                        which specified launch in 2025 (and thus, in practical terms,
performs comparable mapping.                                                             arrival in the mid-2030s during northern winter) this precluded

                                                                                     2
The Planetary Science Journal, 2:24 (13pp), 2021 February                                                                                                 Lorenz et al.

Figure 3. SAR imaging of Selk. The T95 SAR swath is the highest resolution data available (300 × 390 m). The incidence-corrected backscatter product ID on the
PDS is BIFQI09N199_D253_T095S01_V02. Heavy dissection of the rim is evident, and a few dunes appear to be present on the crater floor. To the south, linear
dunes taper out and re-emerge. The general E-W alignment of linear dunes seen all over Titan is prominent at right, although a second orthogonal set is present at left:
this may be a result of “flow-straightening” by the crater causing a transverse dune pattern. The dune pattern to the north is predominantly E-W linears but with some
irregularities. The T36 image is of considerably lower quality. The T98 image (lower right) is of superficially low quality but highlights roughness around the rim.

exploration of Titan’s northern seas as in the proposed Titan                          load that the vehicle must tolerate. Programmatic choice of
Mare Explorer (TiME) mission (Stofan et al. 2013).                                     aeroshell diameter, in turn limited by launch vehicle fairing
   Additional geometric constraints emerge from implementa-                            size, and of thermal protection system (TPS) material on the
tion choices in a mission concept. First, a single-element in situ                     heat shield, will in turn map to constraints on entry speed.
mission at Titan should logically take advantage of Titan’s                            Because the arrival velocity of the spacecraft in the Saturnian
atmosphere for entry directly from the interplanetary arrival                          system adds vectorially with Titan’s orbital motion, it is
trajectory, avoiding the need for propulsive orbit insertion.                          therefore preferred to aim at Titan’s trailing hemisphere i.e.,
Atmospheric entry speed and angle, together with the ballistic                         180–360 west Longitude, since Titan’s orbital motion subtracts
coefficient (mass/area ratio) of the aeroshell, determine the                           from the arrival speed (Figure 1). How far from centered on the
peak deceleration (g-load), peak heating rate, and total heat                          trailing hemisphere the incoming asymptote can be depends on

                                                                                   3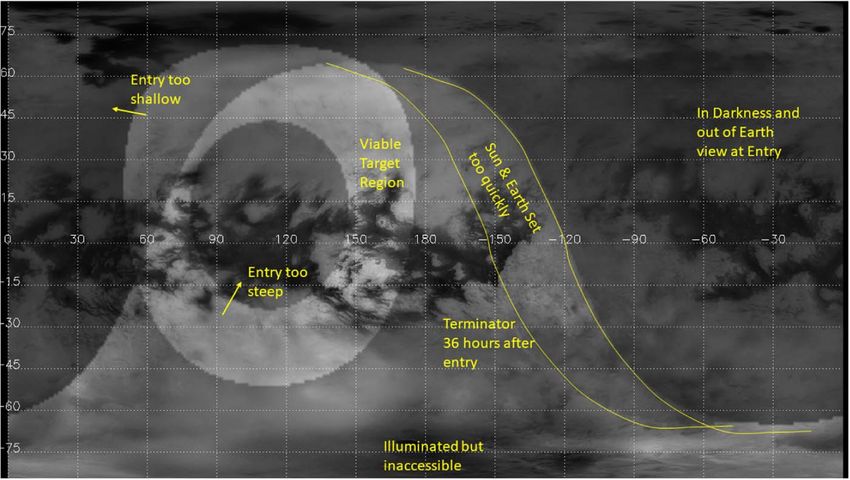
The Planetary Science Journal, 2:24 (13pp), 2021 February                                                                                      Lorenz et al.

Figure 4. T120 SAR imaging of Selk, overlain on the ISS mosaic. This image (generated with the convenient web tool TitanTrek (https://trek.nasa.gov/titan/))
shows the “fingers” of SAR data at the end of the swath. These may merit closer examination in further work.

the available TPS and other factors. In practice, the entry flight                information on surface albedo patterns was available from
path angle from horizontal is unlikely to be at 90° (centered on                 Hubble maps and other observations. It was known that the
the asymptote) but at some shallower angle to spread the                         targeted region was the border between bright and dark regions,
energy dissipation over a longer path. The Huygens probe had                     but its nature was unknown.
an entry angle of 65°, and for heritage reasons it was chosen to
limit the angle to a similar range. These entry dynamics and                                                1.2. Site Selection
aerothermal constraints define a broadly toroidal region on
Titan that can be accessed.                                                         Informed by the gross constraints and intent described in
   A final factor is the visibility of entry. NASA guidelines                     the previous section, the core science team examined a suite
require that critical events such as entry, descent, and landing                 of possible landing locations. It was quickly determined
(EDL) be monitored in real time and thus (absent any relay                       (Figure 2) that the Selk impact crater was the most obvious
assets at Saturn) be in direct line-of-sight to Earth. Although                  site of possible water-organic interaction within the feasible
formally one could be compliant by landing at the terminator                     landing locus. A more careful examination confirmed that
(Earth and Sun are within a few degrees of each other as seen                    water-rich material was exposed in and around the crater, as
from Titan) a prudent mission would require a 2–3 of days of                     indicated by Cassini Visual and Infrared Mapping Spectro-
                                                                                 meter (VIMS) data (e.g., Soderblom et al. 2010) and that good
Earth visibility after landing to ensure safe landing and early
                                                                                 radar coverage existed. Selk has been observed in synthetic
operations before entering Titan night and communications
                                                                                 aperture radar (SAR) mode several times, including one swath
blackout of 8 days. Given Titan’s rotation period of 16 days
                                                                                 with high resolution that yielded several topographic tracks
(22°. 5 day−1) the landing site should be ∼70° west of the sunset
                                                                                 (Stiles et al. 2009) across the crater and its ejecta blanket (these
terminator (Figure 2). The formulation of the original (2016)                    data are discussed in a later section. Importantly, extensive
Dragonfly trajectory and arrival geometry subject to these                        dunes can be identified around the crater, making an initial safe
geometric factors with a launch anticipated in 2025 is discussed                 landing possible with subsequent transit to Selk.
in Scott et al. (2018). It should be noted that trajectory redesign
is presently underway for a planned 2027 launch date, so many
details of the mission are subject to modest revision. The broad                          2. Available Data on Selk and Interpretation
geometric considerations, and target geological location, are                       The Selk impact structure was visible as a bright spot in
unlikely to change, however.                                                     Cassini Imaging Science Subsystem (ISS) near-infrared
   In the absence of knowledge of the surface, delivery                          observations (0.938 μm) acquired in the first Titan flyby TA
geometry considerations were the principal factors determining                   in 2004 October (see upper left of Figure 4 of Porco et al.
the original entry and descent location of the Huygens probe                     2005). As for many other bright spots, Selk was targeted during
(Ott 1992). The probe had to be retargeted after the discovery                   long-range “HiSAR” radar observations for follow-up investi-
of a design flaw in the radio link, and again illumination,                       gations. A HiSAR observation was executed on flyby T36 in
aerothermodynamics, and relay link geometry were the main                        2007, revealing Selk as an 80 km crater (Wood et al. 2010;
factors (e.g., Lebreton et al. 2005), although by this time some                 Neish & Lorenz 2012). This interpretation is corroborated by

                                                                             4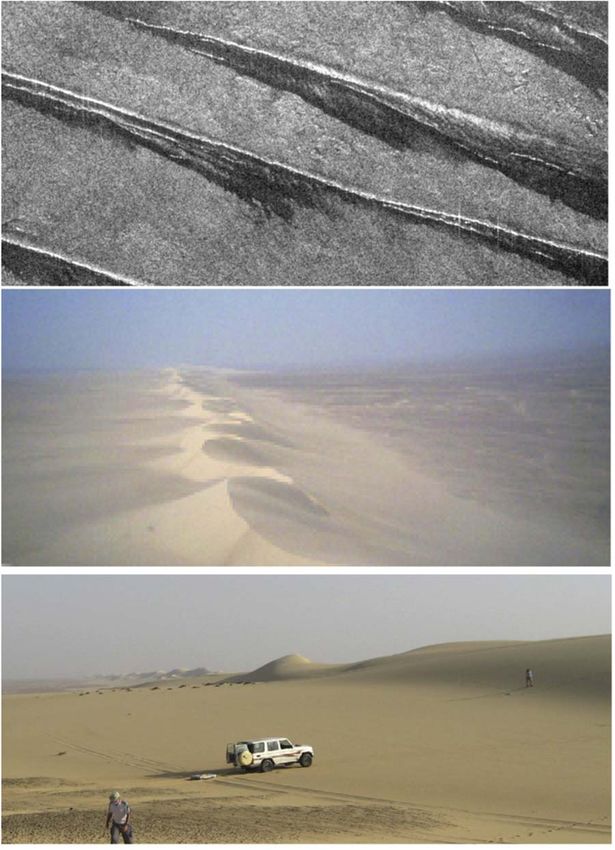
The Planetary Science Journal, 2:24 (13pp), 2021 February                                                                                             Lorenz et al.

Figure 5. Orthographic projection of ISS data (Karkoschka et al. 2017) for Selk-centered hemisphere. (dashed inset) SAR regional mosaic colored with elevation data
from Corlies et al. (2017). The solid black outline indicates the extent of area around Selk analyzed in Section 2 and shown in Figures 4, 7–11.

VIMS data on Selk acquired in T35, T37, T38, and T40
in 2007–2008 (Soderblom et al. 2010). (Succeeding VIMS
observations (e.g., T70, T79, T85, T88) are not of as high
spatial resolution as the prime mission data.) Furthermore, Selk
was noted by Janssen et al. (2016) as a site with locally low
microwave emissivity forming a low-brightness temperature
ring around the crater, a characteristic associated with some
other impact structures. The favored interpretation was that
the impact has excavated ice-rich material from depth, thus
resulting in locally enhanced volume scattering.
   Soderblom et al. (2010) attempted a photoclinometric
(“shape from shading”) interpretation of the VIMS data. Such
methods rely on assumed uniform photometric properties of the
surface material (unlikely in complex terrain) and are also
challenged by atmospheric effects. They derived radial profiles
of the rim/blanket topography, suggesting it rose and fell by                        Figure 6. ISS and VIMS mosaics used to classify the terrain in Figures 9 and
3–5 km over 30–40 km transects, indicating slopes of around                          10. The ISS mosaic was created from hundreds of individual images by
                                                                                     Karkoschka et al. (2017). The VIMS image is a mosaic from T35, T37, T38,
20° over 10 km length scales.                                                        and T40 flybys and colored such that R, G, B = 5, 2, 1.3 μm.
   These results appear to be refuted by high-resolution SAR
data acquired in the T95 flyby on DOY 287 of 2013 (Figure 3).
The image segment at Selk has a representative azimuth
resolution of 300 m and a range resolution of ∼400 m (West &                         information on surface properties. On flyby T120 (Figure 4),
Veeramachaneni 2014), the exact values varying across the                            Selk was targeted during a ridealong observation (where
scene. The correlation between the subswaths acquired by the                         the RADAR instrument did not control pointing): ambiguity
5 radar beams allows recovery of a topographic profile                                errors due to the off-optimal incidence angle mean that the
(“SARtopo,” Stiles et al. 2009; Neish et al. 2018), with an                          recoverable beam subswaths do not overlap, so only a couple
effective resolution of 5–10 km. The T95 swath in the nominal                        of narrow strips of data cross the Selk region. Finally, a HiSAR
incidence angle profile would have passed near the crater, but                        imaging segment was acquired on flyby T121. This segment
the pointing was adjusted specifically to image the crater better.                    (T121S06) of the observation, not shown in the present paper,
The T95 SAR observation is considered the definitive                                  is only modest in quality (between the T98 and T36 images)
morphological data set on Selk, having good geometric control                        but may have value in that it covers the region around Selk
and the best resolution. Note that the georeferencing of Cassini                     without large gaps. Unfortunately, no Cassini radar altimeter
remote sensing data, and any targeting based thereon, may                            data exist directly over this area, although examination of
require adjustment in 2034 depending on the Titan rotation                           altimeter echoes (e.g., Le Gall et al. 2011) over terrains
model adopted at that time (e.g., Hofgartner et al. 2020), but the                   elsewhere that have other characteristics (such as SAR
correction is likely to be only of the order of a few km at most.                    morphology) to the Selk region may prove instructive.
   Selk was also imaged at the edge of a HiSAR observation on                           For Dragonfly mission planning, a surface classification map
T98: although the resolution of this observation is poorer, it is                    was developed from each of the SAR, ISS, and VIMS data sets
at a rather more shallow incidence angle, giving independent                         (Figures 5 and 6) in quarter-degree (∼10 km) grid cells. This

                                                                                5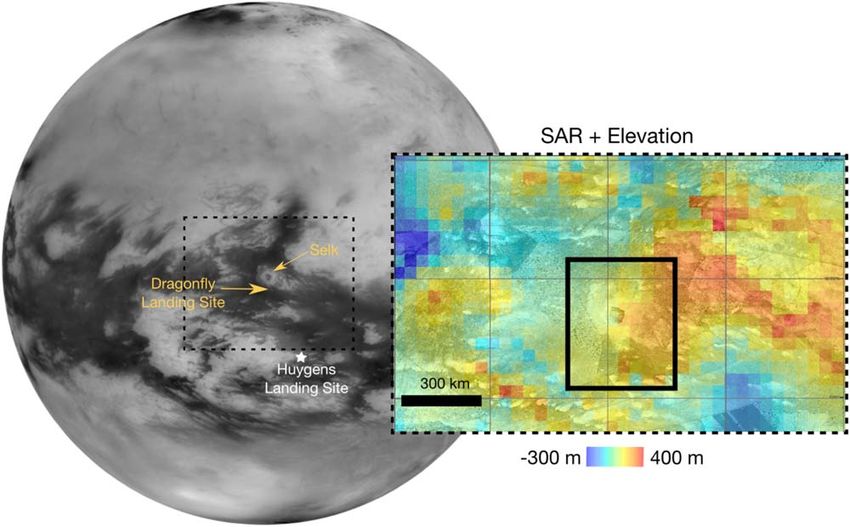
The Planetary Science Journal, 2:24 (13pp), 2021 February Lorenz et al.
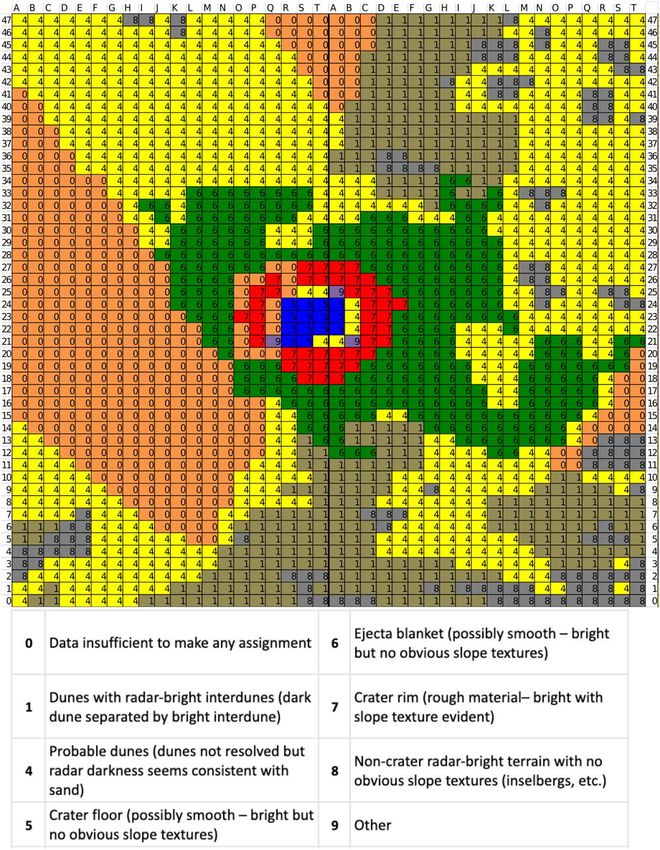
Figure 7. Radar mosaic of the Selk Region for terrain classification in Section 2.1. Latitude and Longitude scales are indicated on the central axes: grid cells can be
referred to by a unique three-character code Lnn where L is the letter indicating east–west, and nn the north–south where nn < 50 refers to the west half of the grid and
nn > 50 to the east. Note that individual dunes are well-resolved in the lower right part of the mosaic.
resolution was chosen as a reasonable compromise between 2.1. SAR Morphology
giving adequate fineness for targeting, providing enough pixels
Analysis of the SAR map of Figure 7 resulted in eight
per cell to permit geomorphological interpretation (e.g., the
classification units, shown in Figure 8, which are consistent
400 m radar resolution indicated above should not be taken to
with the general morphological classification schema for Titan
imply the ability to recognize features of this size, speckle noise
(e.g., Lopes et al. 2019). The SAR data are best for
being an important additional consideration), and requiring a
morphological distinctions given the spatial resolution of up
manageably small number of cells to evaluate over the target
domain. The targeting has been performed based on morph- to 300 m, but gaps in the data set prohibit classification of the
ology and analogs alone. Quantitative interpretation of full map (“0” in Figure 7). Areas with clear dune-interdune
reflectivity properties in terms of surface models must be done boundaries (“1”) are identifiable by a dark-bright pattern where
with caution (as the photoclinometry experience indicates) and dark lines are the organic sands and bright lines are interpreted
is left for future work. To facilitate further analyses, we have as sand-free interdunes. A radar-dark surface may represent
made available a number of products from the present paper sandy interdunes (and thus minimal dune-interdune contrast) or
online at the JHU-APL Data Archive.8 be a function of insufficient resolution (“4”).
The crater floor is identifiable in SAR data as bright with no
obvious ridge or slope textures—bright/dark pairings—like
those of Titan’s mountains Radebaugh et al. (2007) located
8
http://lib.jhuapl.edu/ within the crater rim (“5”). Selk’s ejecta blanket shares similar
6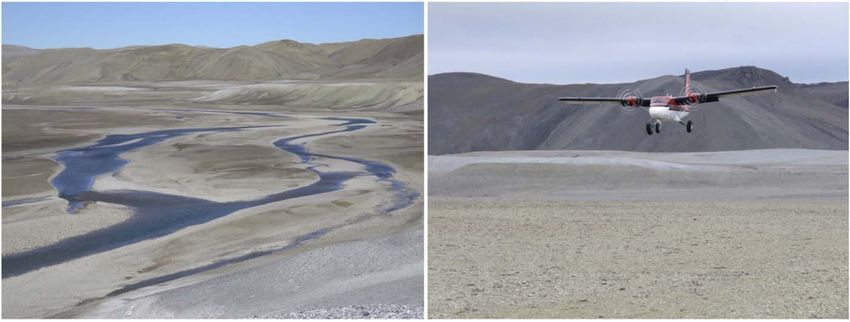
The Planetary Science Journal, 2:24 (13pp), 2021 February                                                                           Lorenz et al.

                           Figure 8. SAR classification map and units. (Nonsequential numbering is a result of unused units).

characteristics—bright without slope texture—but is located                    located away from the crater (e.g., inselbergs) are also in the
outside of the crater rim (“6”), extending southeastward. There                scene (“8”). Only a few grid cells fell outside of any of these
are areas smooth at the 2 cm scale within the crater floor and                  categories (“9”).
ejecta, indicated by the lack of texture in SAR observations.
These areas, some of which may be sand-covered, make                                           2.2. VIMS Spectral Characteristics
promising targets for landing and sampling. Highly textured,                     Data from Titan flyby T40 represent the best VIMS
bright SAR returns indicate rough material at the 2 cm scale.                  observations of Selk and are publicly available from the
Forming a roughly circular pattern, these mark the crater rim                  PDS (cubes CM_1578264152_1, CM_1578263500_1, and
(“7”). Other radar-bright terrain without slope textures and                   CM_1578263152_1). These data have a resolution of

                                                                          7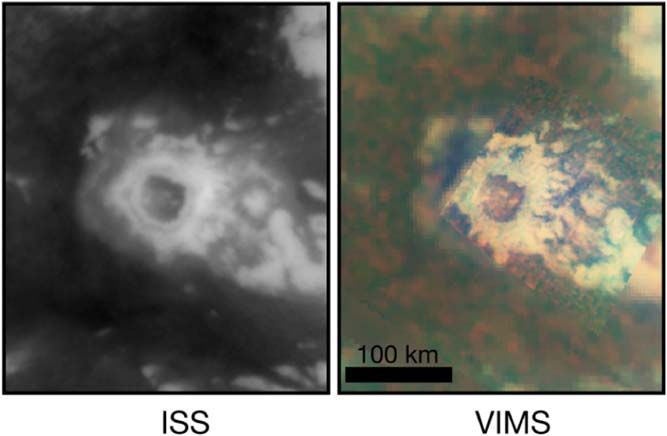
The Planetary Science Journal, 2:24 (13pp), 2021 February                                                                                                Lorenz et al.

Figure 9. VIMS classification. Sand (VIMS spectral brown unit, “4”) forms a horseshoe draped around the crater, much as at other equatorial impact features. Part of
the crater floor is also sand-covered. The crater rim, near-field ejecta, and east-southeast-trending “bench” (Soderblom et al. 2010) are a mix of green (“11”) and blue
(water rich, “10”), materials.

approximately 4 km pixel−1 at best. The VIMS data were                                different grain properties from the dunes (Brossier et al. 2018).
calibrated according to the PDS documentation, mosaiced with                          A small number of cells were assigned a “0” identity where
software written for Barnes et al. (2007), and georeferenced to                       data are insufficient to make a confident classification. Recent
the grid described above (see inset of Figure 5).                                     investigations of the surface spectra using principal component
   Each grid cell was assigned a VIMS spectral unit: brown,                           analysis (Griffith et al. 2019) and radiative transfer models
blue, and green (Figure 9). The brown unit (“4”) is spectrally                        (Solomonidou et al. 2020) corroborate these interpretations.
dark and neutral, consistent with organics and spatially
correlates with dune fields (Soderblom et al. 2007; Rodriguez                                                      2.3. ISS Reflectivity
et al. 2014; Brossier et al. 2018), though the dunes themselves                          Karkoschka et al. (2017) compiled a global 0.938 μm
are rarely resolved (Barnes et al. 2008; Bonnefoy et al. 2016).                       albedo map, available via the JPL Photojournal (PIA22770),
The blue unit (“12”) is thought to indicate material with a                           from Cassini ISS data (Figure 5). By coadding over 1000
substantial water–ice component due to the relative reflectance                        images and accounting for scattering by atmospheric haze
at wavelengths where water ice should strongly absorb (e.g.,                          particles, the resulting map has spatial resolution up to about a
1.6, 2, 2.8 μm; Soderblom et al. 2010; Griffith et al. 2019). The                      factor of 5 better than previous efforts: some 65 individual
green unit (“11”) is not well understood but correlates with                          images used in the Selk region have a pixel scale of 1 km or
sand-free areas like inselbergs, interdunes, and some crater                          better. Coverage at high spatial sampling is not continuous
ejecta (Barnes et al. 2007; Neish et al. 2015; Solomonidou et al.                     as it relies, in part, on the number of summed images. This
2020). Compositionally, the unit is likely organic rich, with                         reflectance map was cropped and georeferenced to the same

                                                                                  8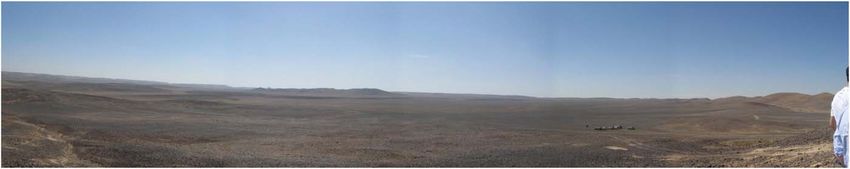
The Planetary Science Journal, 2:24 (13pp), 2021 February                                                                                                  Lorenz et al.

Figure 10. ISS classification. As in VIMS data, the organic sand have low reflectance. Linear, dark morphologies separated by bright areas likely represent dunes and
sand-free interdunes (“12” and “13” where the later are at the limits of confidence), but not all cases are as clear. Some dunes are at the limit of distinguishability,
perhaps indicating sandy interdunes (“2”) or just insufficient resolution (“4”). Bright terrains are classified at two levels (“14” and “15”), which may reflect differences
in composition or surface roughness properties.

grid as RADAR and VIMS data for this work. The result was                               working at the limits of resolution and contrast. Given the
interpreted based on morphology and reflectance (Figure 10).                             relative darkness of some interdunes compared to nearby bright
   As in VIMS data, organic sand appears dark to ISS and the                            terrains, we also identified grid cells where dunes were resolved
crater blanket and rim material are bright. We discern two                              with particularly dark interdunes (“2”) or, more often, grid cells
bright units (very bright, “14,” and bright, category “15”).                            where the overall albedo is similar to the dunes but no dunes
Unlike VIMS data for Selk, the ISS reflectance map features                              are resolved (“4”).
several areas where the contrast between dunes and interdunes                              The result largely agrees with the VIMS map, as one might
is sufficient or nearly sufficient (“12” and “13,” respectively) to                       expect, with finer detail captured with higher spatial sampling.
exhibit linear bright-dark contrasts that trend in the direction of                     Together, the VIMS, and ISS data sets complement the
the dunes resolved by SAR. “Nearly sufficient” in this case                              RADAR data by providing broader coverage and information
signifies that the classification is of less confidence as we are                          about surface composition.

                                                                                   9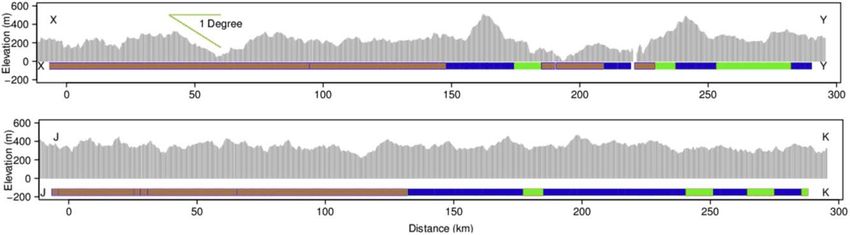
The Planetary Science Journal, 2:24 (13pp), 2021 February                                                                                    Lorenz et al.

                                                                                       planetary surfaces means that reducing the length scale by a
                                                                                       factor of ∼10 reduces the root-mean-square surface height
                                                                                       variation by a factor of ∼3. Thus, despite the limited horizontal
                                                                                       resolution of the SARtopo profile, there are unlikely to be
                                                                                       “unseen mountains” with heights larger than shown. However,
                                                                                       the slope distribution at the lander scale will be rather larger
                                                                                       than the profile suggests. The existence of flat areas, however,
                                                                                       is expected on the basis of geological analogy—see next
                                                                                       section. A 30 km wide, 200 m deep valley appears to be present
                                                                                       about 50 km into the track. Track JK, across the outer margin
                                                                                       of the morphologically identified ejecta, shows only a minimal
                                                                                       topographic signature (∼100 m) of a “bench.”
                                                                                          The emissivity shown in Figure 11 is derived from the
                                                                                       microwave brightness temperature. The radar receiver can
                                                                                       estimate the power radiated in the real aperture of each of the
                                                                                       five beams. Since the T95 Selk observation was near closest
                                                                                       approach, the beam footprint was usefully small (∼10 km
                                                                                       wide) allowing the ejecta blanket and crater to be resolved. As
                                                                                       observed at other craters, low brightness temperatures yield low
                                                                                       emissivitities in the ejecta blanket, suggesting a water ice-rich
                                                                                       composition (Janssen et al. 2016; Werynski et al. 2019).

                                                                                                            3. Lander Targeting
                                                                                          A full discussion of the operations concept and traverse plan
                                                                                       for Dragonfly is beyond the scope of the present paper and will
                                                                                       almost certainly evolve over time. It suffices to note here that
                                                                                       the initial landing would take place among the dunes where a
                                                                                       safe interdune landing site can be determined autonomously
                                                                                       after the atmospheric entry and parachute descent. After initial
                                                                                       science observations over several Tsols (Titan days: 1 Tsol
                                                                                       ∼16 Earth days), Dragonfly would make initial short “hops” of
Figure 11. Radar mosaic of Figure 7 shaded with a color relating to the
                                                                                       hundreds of meters to a few kilometers to explore different
microwave emissivity (Janssen et al. 2016). The blue color indicates a low             surface types, such as the shallow dune plinths that typically
emissivity also seen at other fresh Titan impact craters, suggestive of a water        flank linear dunes. Then, over the following 2 yr or more,
ice-rich ejecta. The two SARtopo track locations (YX and KJ) and a candidate           longer flights would be made to reconnoiter, and then if judged
delivery ellipse are outlined in white. The ellipse placement yields 100%              suitable, land at additional sites progressively toward Selk—see
chance of landing on VIMS “Brown” unit suggesting sand cover; the
corresponding ISS “dark” material covers 95% of the ellipse, and 93% is in the         e.g., (Lorenz 2020).
SAR-classified “dunes” unit.                                                               As with the Huygens probe, and the proposed Titan Mare
                                                                                       Explorer (and indeed Venus probes, Lorenz 2015), the size of
                                                                                       the “landing ellipse” (the area within which the lander is
             2.4. Microwave Radiometry and SARtopo                                     expected to be delivered with some high probability, typically
                                                                                       99%) is driven largely by uncertainty in the zonal winds to be
   The T95 SAR swath provides additional information beyond                            encountered during the long parachute descent. This makes the
the high-resolution radar image. The swath is formed from the                          ellipse wider in the east–west direction than north–south. The
union of five subswaths generated by switching in rapid                                 north–south dimension is determined in part by the much
succession between the five feeds to the high-gain antenna.                             smaller (but nondeterministic) meridional winds, as well as by
Where these swaths overlap, the same terrain is viewed at                              the projection of the interplanetary delivery uncertainty onto
different angular positions in the respective beams, and                               Titan’s globe and by small uncertainties in entry system drag
matching their intensity allows an estimate of the terrain height                      performance, atmospheric density etc.
to be made. The effective horizontal resolution, determined by                            Following previous work on specifying a Titan wind model
the size of the correlation window, is of the order of 10 km,                          for high latitudes (Lorenz et al. 2012), an engineering wind
although the profile data product is sampled more frequently.                           model was formulated by examining predictions from several
   Figure 11 shows the location of the two SARtopo tracks                              Global Circulation Models (e.g., Lora et al. 2019), as well as
plotted in Figure 12 (Neish et al. 2018; Hedgepeth et al. 2020).                       the wind profile developed from Doppler tracking of the
Track XY crosses the crater almost diametrically. The crater                           Huygens probe, and Cassini observations of temperature
floor is only 100–200 m below the surrounding terrain, and the                          contrasts from which zonal winds can be estimated. Monte
rim rises on both sides to about 200 m above the surrounds.                            Carlo simulations of the entry and descent were performed at
The rim slope appears to be only about 3° in the profile,                               NASA’s Langley Research Center using the POST II (Program
although locally steeper and shallower slopes doubtless exist at                       to Optimize Simulate Trajectories) simulation tool, widely used
smaller scale. As discussed in Shepard et al. (2001), fractal                          in EDL analyses on Mars and other missions. These
topography with a Hurst exponent of 0.5 typical of natural                             simulations yielded an ellipse of 148.9 × 72.0 km, centered at

                                                                                  10
The Planetary Science Journal, 2:24 (13pp), 2021 February Lorenz et al.
Figure 12. T95 SARtopo profiles outlined in Figure 11. XY shows the rim and floor of the crater (150–250 km) and the nearby ejecta blanket while JK passes over the
“bench” identified by Soderblom et al. (2010). The color strips beneath the profile show the VIMS terrain classification along the profile.
Figure 13. (Top) Tapering linear dunes in Egypt, morphologically identical in radar images (XSAR) with the dunes seen to the Southeast of Selk. (Middle) Kiteborne
camera view of Ghard el Quattaniya linear dunes west of Cairo, Egypt showing dune and plinth. (Bottom) Field photo at same dune showing Ground Penetrating
Radar operations. While dune slopes themselves would be avoided, it is clear that shallow-sloped dune plinths can allow safe access to sand material. (Photos:
Lorenz).
11The Planetary Science Journal, 2:24 (13pp), 2021 February Lorenz et al.
Figure 14. Field photographs from the Haughton impact structure. Although steep slopes exist, flat areas of sand and gravel permit even fixed-wing aircraft to find
landing sites. (Photos: Neish).
3°. 72N, 161°. 8E for lander separation from its parachute. (This in the center of some of the major sand seas (e.g., the 160 m
occurs at ∼1 km height: the landing itself involves a short high dunes seen in Belet determined by radarclinometry in
horizontal flight that is not modeled in this calculation.) Lorenz et al. 2006 or the 60–120 m dunes in Fensal measured
Although retargeting may demand an eventual end-to-end by altimetry in Mastrogiuseppe et al. 2014).
reanalysis, in practice the coupling between the nominal A good analog of these terminal linear dunes are those seen
aimpoint (the center of the ellipse) and the various error terms at Quatanniya in the eastern margins of the desert in northern
is very weak over the distances considered here (just a few Egypt. These, described by desert forces in World War II
degrees of latitude or longitude). The ellipse can thus be (Lorenz 2011) as “saw-toothed sand peaks like a string of
translated more or less unchanged over small distances as the battleships in line ahead at sea... appearing and disappearing
mission parameters, or interpretations of remote sensing data, over the rolling gravel” are a few tens of meters in height, with
are refined. wide, shallow dune plinths. Figure 13 shows the field
The ellipse (coincidentally almost exactly the same size as appearance of these features, and radar characteristics of
the Viking lander ellipses, e.g., Stooke (2012), albeit for rather similar dunes farther south (which were the subject of a
different reasons) was positioned to the southeast of the crater, backscatter modeling study by Paillou et al. 2014). The wide
since this area had direct topographic information and dunes dune plinths are shallow in slope, permitting landings to access
that were well-resolved in SAR and close to the crater. For the sand material without confronting the steep slopes of the crest.
purpose of Phase A mission definition, the ellipse was Perhaps the best terrestrial analog to a large relatively fresh
positioned as close to the crater as possible, while retaining a Titan crater like Selk is the Haughton Impact Structure in
better than 95% chance of being on the VIMS “brown unit” Northern Canada, shown in Figure 14 (Neish et al. 2018).
and 95% on ISS-dark (thus likely sand-covered) terrain. Although rather smaller (20 km diameter versus 80 km for Selk),
Clearly, relaxation or tightening of such constraints could Haughton has only moderate modification, mostly by fluvial and
allow the ellipse to be shifted by perhaps a few tens of periglacial processes. Morphological evidence suggests a similar
kilometers. In the limit, one could center the landing footprint modification state at Selk: the crater rim and ejecta blanket are
on Selk itself, but the ellipse is large enough that it would still intact but interrupted by fluvial networks. Furthermore,
include a substantial fraction of rim and ejecta terrains, in recent analysis of compositional data from VIMS and micro-
contiguous regions that might be too large to fly across. wave radiometry led Werynski et al. (2019) to classify Selk as an
intermediate-aged crater. By analogy with Haughton, then, steep
slopes, especially at the crater rim, are anticipated but so are flat
4. Terrestrial Analogs
areas. Landing and sampling of the sand and/or gravel clasts
Terrestrial analogs to Titan’s dune fields are well-estab- present should be possible.
lished. Key in the recognition of this landscape on Titan were Another analog is the 5.5 km Waqf As Suwwan impact
the morphological similarities to the linear dunes in terrestrial structure (Salameh et al. 2008) in Jordan (Figure 15). Although
sand seas, notably the Namib and Arabian deserts (Lorenz et al. an even smaller analog, its desert setting and subdued
2006; Radebaugh et al. 2008). topography (the crater has an age of 35 Myr, so has been
Of particular relevance in the target area chosen is that dunes modified by erosion and deposition) gives a sense of how Titan
“peter out,” forming slender dark triangles—see the upper craters might appear. The rim height is around 100 m above the
panel of 13. This is symptomatic of weaker sand supply and floor, compared with 400 m for Selk, but since Selk is about 12
indicates an increased likelihood that at least some sand-free times larger and the width of the wall correspondingly broader,
patches may be encountered (recognizing that the VIMS and the slopes on Selk will be generally shallower than those at
ISS data sets here suggest that overall the surface here is Waqf As Suwwan. The crater floor there is generally desert
generally sand-covered, or at least sand-colored). It further pavement, thus providing further evidence for ample safe
argues that the dunes will likely not be as tall as those observed landing sites at Selk.
12The Planetary Science Journal, 2:24 (13pp), 2021 February Lorenz et al.
Figure 15. Field panorama of the Waqf As Suwwan impact structure from the rim, which can be seen extending to the right. The central uplift is visible at center, but
overall the topography is very subdued. (Photo: Lorenz).
5. Conclusion Brossier, J. F., Rodriguez, S., Cornet, T., et al. 2018, JGRE, 123, 1089
Corlies, P., Hayes, A., Birch, S., et al. 2017, GeoRL, 23, 11,754
While no single area represents the full diversity of Titan’s Golombek, M. P., Grant, J. A., Parker, T. J., et al. 2003, JGRE, 108, 8072
surface features, the Selk impact structure offers a variety of Griffith, C. A., Penteado, P. F., Turner, J. D., et al. 2019, NatAs, 3, 642
surface compositions and geological settings over modest Hedgepeth, J. E., Neish, C. D., Turtle, E. P., et al. 2020, Icar, 344, 113664
Hofgartner, J. D., Hayes, A. G., Campbell, D. B., et al. 2020, NatCo, 11, 2829
distances. Organic materials are available via the dune sands Janssen, M. A., Le Gall, A., Lopes, R. M., et al. 2016, Icar, 270, 443
(and, potentially, the VIMS green unit) while water ice-rich Karkoschka, E., McEwen, A., & Perry, J. 2017, LPSC, 48, 2518
material should be available at the ejecta blanket (and perhaps Lebreton, J.-P., Witasse, O., Sollazzo, C., et al. 2005, Natur, 438, 758
also at bedrock exposed in the interdunes). Crater materials are Le Gall, A., Janssen, M., Wye, L., et al. 2011, Icar, 213, 608
especially desirous targets due to the strong promise of sampling Lopes, R. M. C., Malaska, M. J., Schoenfeld, A. M., et al. 2019, NatAs, 4, 228
Lora, J. M., Tokano, T., Vatant d’Ollone, J., Lebonnois, S., & Lorenz, R. D.
where liquid water and organics have interacted. In addition to 2019, Icar, 333, 113
impact-associated processes, this region has been worked by the Lorenz, R. D. 2011, AeoRe, 3, 229
aeolian and fluvial processes known to operate across Titan. Lorenz, R. D. 2015, P&SS, 108, 66
Terrestrial analog craters in fact suggest that even aiming Lorenz, R. D. 2019, AdSpR, 64, 944
Lorenz, R. D. 2020, AdSpR, 65, 1383
Dragonfly directly at the crater on arrival would probably result Lorenz, R. D., Newman, C. E., Tokano, T., et al. 2012, P&SS, 70, 73
in finding a safe landing. However, landing first in the dunes and Lorenz, R. D., Turtle, E. P., Barnes, J. W., et al. 2018, JHATD, 34, 374,
then exploiting Titan’s environment for easy aerial mobility https://dragonfly.jhuapl.edu/News-and-Resources/docs/34_03-
offered a logical and easily communicated strategy to minimize Lorenz.pdf
risk while maximizing the potential for scientific exploration. Lorenz, R. D., Wall, S., Radebaugh, J., et al. 2006, Sci, 312, 724
Mastrogiuseppe, M., Poggiali, V., Seu, R., Martufi, R., & Notarnicola, C. 2014,
Icar, 230, 191
The work at APL was supported by the Dragonfly Phase A Masursky, H., & Crabill, N. 1976, Sci, 193, 809
study award from the NASA New Frontiers Program. We thank Neish, C., Somogyi, A., Imanaka, H., Lunine, J., & Smith, M. 2008, AsBio,
Chris Scott and Marty Ozimek of APL for devising the delivery 8, 273
Neish, C. D., Barnes, J. W., Sotin, C., et al. 2015, GeoRL, 42, 3746
trajectory, Douglas Adams of APL for definition of the Neish, C. D., & Lorenz, R. D. 2012, P&SS, 60, 26
aerothermodynamic constraints, and Joseph White of NASA’s Neish, C. D., Lorenz, R. D., Turtle, E. P., et al. 2018, AsBio, 18, 571
Langley Research Center for computing the delivery ellipse. Neish, C. D., Somogyi, Á, Lunine, J. I., & Smith, M. A. 2009, Icar, 201, 412
Philippe Paillou provided the XSAR image. The first author’s Neish, C. D., Somogyi, Á, & Smith, M. A. 2010, AsBio, 10, 337
field work in Egypt was supported by the Cassini RADAR team. Ott, S. 1992, in IAF Int. Astronautical Congress 43 (Washington, DC: IAF), 10
Paillou, P., Bernard, D., Radebaugh, J., et al. 2014, Icar, 230, 208
We thank Léa Bonnefoy and Alex Hayes for pointers on Cassini Porco, C. C., Baker, E., Barbara, J., et al. 2005, Natur, 434, 159
RADAR data. C. N. acknowledges support from the Canadian Radebaugh, J., Lorenz, R. D., Kirk, R. L., et al. 2007, Icar, 192, 77
Space Agency for field work at the Haughton Impact Structure. Radebaugh, J., Lorenz, R. D., Lunine, J. I., et al. 2008, Icar, 194, 690
Rodriguez, S., Garcia, A., Lucas, A., et al. 2014, Icar, 230, 168
Salameh, E., Khoury, H., Reimold, W. U., & Schneider, W. 2008, M&PS,
ORCID iDs 43, 1681
Scott, C. J., Ozimek, M. T., Adams, D. S., et al. 2018, in AAS/AIAA
Ralph D. Lorenz https://orcid.org/0000-0001-8528-4644 Astrodynamics Specialist Conf. (Pasadena, CA: JPL, NASA), http://hdl.
Shannon M. MacKenzie https://orcid.org/0000-0002- handle.net/2014/48626
1658-9687 Shepard, M. K., Campbell, B. A., Bulmer, M. H., et al. 2001, JGR, 106, 32777
Catherine D. Neish https://orcid.org/0000-0003-3254-8348 Soderblom, J. M., Brown, R. H., Soderblom, L. A., et al. 2010, Icar, 208, 905
Alice Le Gall https://orcid.org/0000-0002-9023-4868 Soderblom, L. A., Kirk, R. L., Lunine, J. I., et al. 2007, P&SS, 55, 2025
Solomonidou, A., Neish, C., Coustenis, A., et al. 2020, A&A, 641, A16
Elizabeth P. Turtle https://orcid.org/0000-0003-1423-5751 Stiles, B. W., Hensley, S., Gim, Y., et al. 2009, Icar, 202, 584
Jason W. Barnes https://orcid.org/0000-0002-7755-3530 Stofan, E., Lorenz, R., Lunine, J., et al. 2013, in IEEE Aerospace Conf.
Melissa G. Trainer https://orcid.org/0000-0003-1106-8580 (Piscataway, NJ: IEEE), 211
Erich Karkoschka https://orcid.org/0000-0002-4165-0064 Stooke, P. J. 2012, The International Atlas of Mars Exploration: Vol. 1, 1953 to
2003: The First Five Decades (Cambridge: Cambridge Univ. Press)
Turtle, E. P., Barnes, J., Trainer, M., et al. 2018, LPSC, 49, 1641
References Werynski, A., Neish, C. D., Gall, A. L., & Janssen, M. A. 2019, Icar, 321, 508
West, R., & Veeramachaneni, C. 2014, RADAR Titan Flyby during S80/T95,
Barnes, J. W., Brown, R. H., Soderblom, L., et al. 2007, Icar, 186, 242 Cassini RADAR Team, https://pdsimage2.wr.usgs.gov/archive/co-v_e_j_
Barnes, J. W., Brown, R. H., Soderblom, L., et al. 2008, Icar, 195, 400 s-radar-3-sbdr-v1.0/CORADR_0253_V03/EXTRAS/T95_SEQUENCE_
Barnes, J. W., MacKenzie, S. M., Young, E. F., et al. 2020, PSJ, 1, 24 DESIGN_MEMO.PDF
Bonnefoy, L. E., Hayes, A. G., Hayne, P. O., et al. 2016, Icar, 270, 222 Wood, C. A., Lorenz, R., Kirk, R., et al. 2010, Icar, 206, 334
13You can also read