Shallow returns? ESG risks and opportunities in aquaculture - www.fairr.org @FAIRRinitiative
←
→
Page content transcription
If your browser does not render page correctly, please read the page content below

Shallow returns?
ESG risks and
opportunities
in aquaculture

www.fairr.org      @FAIRRinitiative
Contents
Foreword 4 Chapter 3: Certification and beyond 86 Acknowledgements
Executive summary 6 Aquaculture certification schemes 88 We would like to thank the following colleagues who shared their insights
Introduction 8 Other assurances through certification 93 and expertise during the research process for this report:
Glossary 10 Going beyond certification 94 • Trygve Berg Lea, Sustainability Manager, Skretting
Abbreviations 11 Chapter 4: The way forward 98 • Annie Bersagel, Senior Analyst – Responsible Investments, Folketrygdfondet
Chapter 1: Overview of the aquaculture sector 12 New approaches to fish farming 100 • Lewis Bollard, Farm Animal Welfare Project Officer, The Open Philanthropy Project
Main species and production figures and trends 16 Fish health innovation 106
• Ellinor Haggebrink, Manager, Sustainalytics
• Patrik Henriksson, Stockholm Resilience Centre, Stockholm University, Stockholm,
Major production systems 18 Improving transparency 112
Sweden; and WorldFish, Jalan Batu Maung, Penang, Malaysia
Shift to high-intensity farming systems in Asia 19 Feed Innovation 114
• Krister Hoaas, Manager of Public Affairs, Lerøy Seafood Group ASA
Consumption trends and main markets 20 New product developments 116
• Lars Erik Mangset, Senior Advisor – Responsible Investments,
Risks in international trade 22 Appendix: and Marte Siri Storakers, Advisor – Responsible Investments, KLP
Industry structure 23 The regulatory environment in key producing countries 122
• Victoria McArdle, Sustainable Investment Analyst, Royal London Asset
United States 123
Chapter 2: ESG Issues in aquaculture 26 Management
European Union 125
Financial levers and timeline of risks to aquaculture 28 • Laura McTavish, Responsible Investment Analyst and Henry Repard, Responsible
Scotland 126
Investment Analyst, DNB Asset Management
Greenhouse gas emissions 30 Norway 127 • Frederik W. Mowinckel
Engagement questions 35 China 128 • Dag Sletmo, Senior Vice President, DNB Seafood
Effluents 36 Chile 129 • Liz Specht, Associate Director of Science and Technology, Good Food Institute
Declining fish feed supply 44 Bibliography 130 • Max Troell, Beijer Institute, The Royal Swedish Academy of Sciences; Stockholm
Habitat destruction and biodiversity loss 50 Resilience Centre, Stockholm University
Disease management 56 • Mike Velings, Co-Founder, Aqua-Spark
Antibiotic use 62 • Peter van der Werf, Director, Active Ownership, Robeco
Transparency and food fraud 68 • Technical and Marketing team representatives, Quorn Foods
Labour conditions 72 Important notice
Community resistance 76 Commercial use of any of the material contained in this report, including any graphics
Fish welfare: an emerging risk 78 or images, is prohibited without prior authorisation from the Jeremy Coller Foundation
(“JCF”). This report may be copied (for internal distribution only) on the condition that
copyright and source indications remain intact and no modifications are made.
About this report
The information contained in this report is meant for the purposes of information only
Produced by FAIRR in collaboration with KKS Advisors and VB Consultancy and is not intended to be investment, legal, tax or other advice, nor is it intended to be
Jennifer Jacquet, Becca Franks and Leigh Gaffney authored the ‘Animal welfare’ section. relied upon in making an investment or other decision. All content is provided with the
understanding that JCF is not providing advice on legal, economic, investment or other
professional issues and services.
No representation or warranty (express or implied) is given by JCF as to the accuracy
or completeness of the information and opinions contained in this report. You should
not act upon the information contained in this publication without obtaining specific
professional advice. To the extent permitted by law, JCF does not accept or assume
any liability, responsibility or duty of care for any consequences of you or anyone
else acting, or refraining to act, in reliance on the information contained in this report
or for any decision based on it. All information and views expressed herein by JCF are
based on its judgment at the time of this report and are subject to change without
notice due to economic, political, industry and firm-specific factors.
‘JCF’ refers to Jeremy Coller Foundation, a registered charity number 1163970
and a company limited by guarantee, registered in England number 9696841.
2 FAIRR is a registered trade mark of the Jeremy Coller Foundation.
© 2019 Jeremy Coller Foundation. All rights reserved.
Foreword

“Since 2014 aquaculture,                           Fish farming has now surpassed wild fishing as the main
                                                   provider of seafood on our plates. The $230 billion industry

or fish farming, has                               has a vital role to play in meeting protein demand worldwide
                                                   and has averaged annual growth of almost 6% since 2000,

overtaken wild fishing                             providing significant shareholder returns.
                                                  But does anything smell fishy about this enticing investment
 as the main provider                             thesis? This report looks at the sector through a sustainability
                            lens and finds a wide range of environmental, social and governance (ESG)
of seafood on our plates.   challenges which must be met if aquaculture is to prosper over the long-term.

It is a promising thesis    The report identifies ten ESG risks facing the sector. These include deep-seated
                            material environmental issues such as its dependence on wild fish stocks, destruction

for any investor.           of natural habitats, and an intensifying battle against disease and infections.
                            To take just one other example, this report highlights how algal blooms caused in part
But it doesn’t tell         by polluted wastewater from aquaculture operations, caused an estimated $800
                            million in damage to the Chilean salmon industry in 2016, killing nearly 27 million fish.
the whole story.”           As of May 2019, the same issue is now impacting the Norwegian industry.
                            There are significant governance issues too, many of which are unsurprising given
                            the fast-growing, high-demand nature of the industry. In April 2019, for example,
                            a class-action lawsuit was filed in the US accusing major players in Norway’s
                            farmed salmon industry of price fixing.

                            Scanning the horizon for investors
                            Aquaculture sits within a complex map of regulatory contexts and voluntary
                            certification schemes, and this report explores this terrain for investors. It shows
                            how these drive geographic-specific ESG risks across the Americas, Europe and Asia.
                            It also gives examples of fish farming practices that can reduce critical public
                            health threats such as antibiotic resistance, and better protect marine and
                            coastal ecosystems.
                            Innovations are also highlighted such as cultured seafood or plant-based replications
                            of fish products that could reshape the industry.
                            Ultimately, this report seeks to help investors understand these risks and opportunities,
                            and integrate them into their investment decision-making. The FAIRR investor
                            network is having a massive impact on the food industry thanks to the investors with
                            over $12 trillion of assets who have joined since 2016. FAIRR’s mission is simply to
                            bridge the ESG knowledge gap and be an enabler for investor engagement with
                            food-related businesses. Please join our free, fast growing FAIRR investor network.
                            Jeremy Coller
                            Founder, FAIRR
                            Chief Investment Officer, Coller Capital

  4
Executive summary
The steady growth of GHG emissions Fish feed supply Working conditions
global aquaculture has
The sector is exposed to the effects Salmon and shrimp diets include The wider seafood sector, especially
of a warming climate with fishmeal and fish oil, making the in Asia, has been associated with
seen fish farms overtake production in the key producing
region of Southeast Asia expected
industry highly dependent on
rapidly-depleting wild fish stocks.
several instances of labour and
human rights infringements,
fisheries as the world’s to drop between 10%-30% by
2050 due to climate impacts such
If the aquaculture sector is to
continue long-term expansion,
exposing it to a regulatory
and public backlash.
main provider of seafood. as rising sea temperatures and
ocean acidification.
the sector must find a sustainable
and scalable supply of alternative
Its continued growth feed ingredients.
is seen as key to Animal welfare
meeting future global Effluents
Concerns about the physical
and mental wellbeing of fish in
protein demand. Sewage and waste water discharged
from fish farms is associated with
Disease
Outbreaks cost the sector around
aquaculture puts the industry at
odds with shifting consumer support
the risk of toxic algal blooms and $6 billion per annum according towards high-welfare products.
drinking water pollution. In 2016, to the World Bank. All salmon-
algal blooms caused around $800 producing regions are battling sea
As analysed in detail in Chapter 2 of this report, however, the sector faces ten
million of damage to the Chilean lice, but the solutions available bring
environmental, social and governance (ESG) risks that could have a significant
salmon industry. additional sustainability impacts.
impact on its financial future.
Chapter 3 of this report looks at the role of voluntary certification schemes to
Community resistance
improve sustainability performance, primarily examining standards issued by Global
Local communities increasingly
Good Agricultural Practice (GLOBALG.A.P.), the Aquaculture Stewardship Council
object to new aquaculture projects.
(ASC) and Global Aquaculture Alliance (GAA-BAP) standards.
In 2018, the Washington state
Chapter 4 explores emerging solutions to better manage ESG issues. These include Habitat destruction Antibiotic use senate voted to phase out
innovations to improve fish health, such as the use of natural probiotics, and new Millions of fish escape from fish Hotspots of antibiotic use in non-native fish culture across the
production systems that allow by-products to be recaptured and converted into farms every year and mix with aquaculture accelerate development entire state by 2025 after protests
feed and energy. It also analyses alternatives to fishmeal feed, such as bacteria, native marine populations. It is a of antimicrobial resistance (AMR) from local communities.
algae and insect-based feeds, and alternative protein solutions, such as plant-based major issue that risks regulatory and increase export risks. In January
replications of fish products or cell-based seafood. costs and reputational damage to 2019, the US Food and Drug
An overview of legislation impacting the aquaculture sector in the US, European the companies involved. In July Administration (FDA) denied entry
Union (EU), Scotland, Norway, China and Chile is provided in the Appendix. 2018, Mowi (formerly Marine to 26 shipments of Indian shrimp due
Harvest) lost $3.4 million and over to detection of banned antibiotics.
690,000 salmon when a storm Food fraud
severely damaged ten net pens. The sector is vulnerable to food
mislabelling that can lead to costly
product recalls and legal battles.
One conservation group estimated
that a third of seafood in the sold in
the US is mislabelled. An academic
study focused on Canadian seafood
6 observed similar findings.
Introduction

Aquaculture has quickly become
the fastest-growing food production
sector and will most likely
remain so in the coming decades.
What risks do investors face?

53%
                               In 2016, aquaculture was valued at $232      rapid growth (FAO, 2018:C ). High levels of GHG emissions, the destruction of
                               billion and was responsible for 53% of the   habitats and adverse effects on biodiversity, as well as diseases that require intense
                               total reported global seafood supply, up     antibiotic usage present risks for companies and investors. The industry is also
                               from only 6% in 1960 (FAO, 2018). The        faced with community conflicts, serious labour rights violations in supply chains and
                               sector’s rapid growth creates significant    problems with illegal seafood smuggling. Overall, the risks are deeply interconnected
of the total global seafood    opportunities for investors but comes        and have the potential to impact company costs, revenues and reputation.
supply came from aquaculture   hand-in-hand with serious environmental,     Further, the aquaculture industry is characterised by a variety of species, production
in 2016, up from 6% in 1960.   social and governance (ESG) related risks    systems, regulatory environments, certifications, unique geographic features and
                               that must be acknowledged and addressed.     industry competition that differ significantly around the world. As a result of these
                               The risks associated with aquaculture are    factors, ESG risk and opportunity in aquaculture markets are nuanced, and certain
                               varied and complex. While aquaculture is     issues might be more prominent in certain regions than others.
                               providing an increasing quantity of global   The goal of this report is to help the investor community better understand
                               protein supply – now making up more          the key ESG risks linked to the sector, highlighting case studies where poor
                               than 50% of seafood around the world –       management of key ESG risks have had significant impact on the financial
                               there are also social and environmental      performance of companies. This report also discusses potential solutions to
                               consequences that accompany such             the identified risks, through innovations in farm, feed and product development,
                                                                            which represent opportunities for the investor community. Ultimately, this report
                                                                            seeks to help investors integrate these considerations into their portfolios
                                                                            and engagement strategies.

  8
Glossary
Aquaculture                                                                            Herbivore
The farming of fish, crustacean, plants, algae and others under controlled             An organism that eats plant material.
conditions in both freshwater and marine habitats.
                                                                                       Intensive farming systems
Biofloc                                                                                A faming approach that uses more inputs and higher stocking densities.
An environmentally friendly aquaculture technique where fish and shrimp
                                                                                       Kelp
are grown intensively with zero or minimum water exchange.
                                                                                       Large brown seaweeds.
Bivalves
                                                                                       Marine finfish
Molluscs with a shell composed of two parts.
                                                                                       A term used to refer to fish with fins that reside in marine waters.
Carnivore
                                                                                       PCU
An organism that eats meat.
                                                                                       The Population Correction Unit (PCU) is a theoretical unit of measurement
Crustaceans                                                                            developed by the European Medicines Agency (EMA) in 2009 and adopted across
A large group of arthoropods, most of which are aquatic. This group includes           Europe. It takes into account a country’s animal population over a year, along with
popular seafood items like crabs, lobsters and shrimps.                                the estimated weight of each particular species at the time of treatment with
                                                                                       antibiotics. Although it is an estimation, it does enable year-on-year comparisons
Effluents
                                                                                       to be made and trends to be seen.
The outflow of polluted water from an aquaculture facility, or agricultural activity
to a main waterbody, often resulting in eutrophication and other negative effects.     Salmonids
                                                                                       A related group of ray-finned fish that, among others, includes different salmon
Eutrophication
                                                                                       species, trout and chars.
A situation where a waterbody becomes oversaturated with nutrients, often
caused by effluents from agricultural and aquaculture activities, and which            Seafood
often results in the excessive growth of algae and/or oxygen depletion.                A collective term used to describe fish, crustaceans, molluscs and other aquatic
                                                                                       animals destined for human consumption.
Extensive farming systems
A faming approach that uses fewer inputs and lower stocking densities.                 Shellfish
                                                                                       Aquatic invertebrates with an exoskeleton. This is a collective term that includes
Fishmeal
                                                                                       groups like crustaceans and molluscs.
A ground meal made mostly from small fish caught by specialised fisheries
and used as a main ingredient in feeds for carnivorous fish.

Flush rate                                                                             ASC Aquaculture Stewardship Council
                                                                                       ASEAN Association of Southeast Asian Nations
The amount of time it takes for a specific volume of water to pass through
                                                                                       CO2   Carbon dioxide
a specific area unit.
                                                                                       EU    European Union
Food web                                                                               FAO Food and Agriculture Organization of the United Nations
A graphical display of the inter-connection of different organisms in a food           FCR Feed Conversion Ratio
chain. Normally such a food web is displayed in different levels, where                FIFO Fish In Fish Out ratio
organisms with the same behaviour in terms of consumption are lumped                   GAA Global Aquaculture Alliance
together, these levels are referred to as trophic levels.                              GAP Good Aquaculture Practices
                                                                                       GHG Greenhouse Gases
                                                                                       RAS Recirculating Aquaculture System
                                                                                       RTRS Round Table on Responsible Soy Association
                                                                                       UN    United Nations

 10
Chapter 1:
                                   Civilisations began cultivating in this way around 2,000 years ago in the Middle
                                   East and Southeast Asia, as communities started raising wild-caught carp in
                                   natural ponds. Fish farming later expanded to include other species but remained

Overview of the                    a family-owned endeavour with limited organisation and commercialisation.
                                   Commercial fishing of wild-caught species continued to be the main provider

aquaculture sector                 of aquatic animal protein up until the 1960s. Until recently, the industry saw
                                   little value in farming and culturing organisms, as global supply from oceans
                                   seemed limitless.

Aquaculture is the
                                                       Figure 1: Status of global fish stocks from 1975-2015
                             100

cultivation of aquatic
                                                                                   Overfished
                             80

animals and plants,
                             60
                                                                       Maximally sustainably fished
                             40

such as fish, crustaceans,   20

shellfish, seaweeds and
                                                                                   Underfished
                              0

other organisms in both
                                   1975     1980      1985           1990            1995          2000            2005   2010   2015

                                                        Biologically sustainable            Biologically unsustainable

natural and controlled                                 Source: Status of global fish stocks from 1975-2015 (FAO, 2018)

marine and freshwater              By the mid-1960s, however, as the world’s commercial fishing fleets expanded
                                   their fishing effort and global presence, fish stocks began to reach peak global

environments.                      production. The global catch has been stable or declining since the 1980s and,
                                   in some places scientists, governments and businesses turned to aquaculture
                                   to reduce the world’s dependence on fisheries and to find alternative ways of
                                   meeting global demand for aquatic animal protein.

12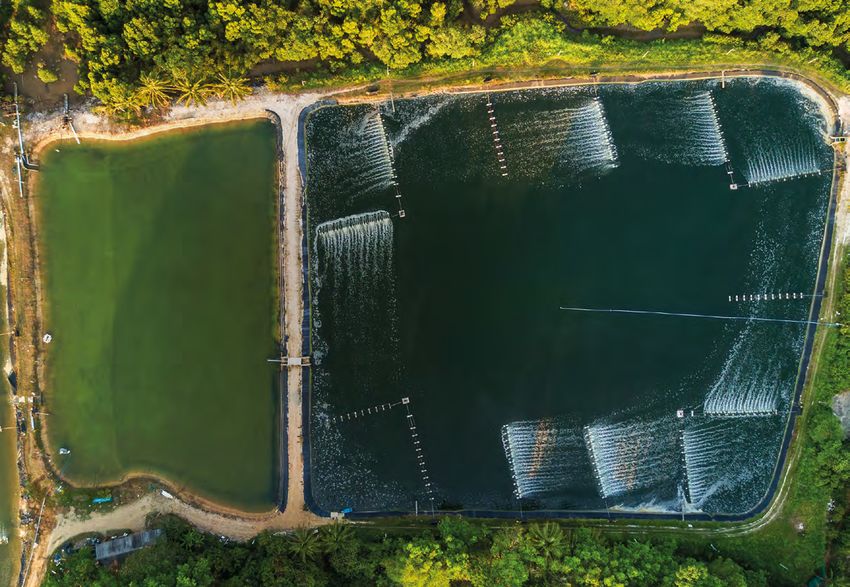
01 Overview of the aquaculture sector
Following this shift, in the 1980s, aquaculture expanded on an industrial scale, Despite the fact that global fishing efforts continue to increase, catch levels have
with annual overall growth rates of 8% over the next two decades. In certain regions remained steady over the past two decades. This indicates that capture fishery
(such as China and African nations), as well as in specific species groups (such as production has likely peaked, with limited potential for production increases
marine finfish and crustaceans), the same period saw double-digit growth rates. (FAO, 2018:C). More conservative estimates that also incorporate data on illegal
China’s reported production alone tripled in two decades, growing from 15 million fishing and bycatch indicate that global harvests are actually in decline, suggesting
tonnes in 1995 to 49 million tonnes in 2015 (Figure 2). severe exhaustion of global fishery resources (Good Food Institute, 2018; Pauly and
Zeller, 2016). Although there has been widespread hope that the aquaculture sector
Figure 2: Increase in total aquaculture production in China, 1980-2017. will fill the supply gap left by capture fisheries, this does not appear to be the case.
FAO data shows that growth in aquaculture production is slowing and will not meet
60,000,000
projected demand, especially as demand for fish outpaces the already high human
population growth rates.
40,000,000
How does the world feed an additional 2.2 billion mouths between now
20,000,000
and 2050?
At current growth rates, the global human population will increase by 2.2 billion
from now until 2050 (United Nations, 2013). The biggest increase in seafood
1980 1985 1990 1995 2000 2005 2010 2015
consumption is expected to come from emerging economies like China, whose
The People’s Republic of China
citizens are already shifting from vegetable-based to protein-rich diets with meat
Source: Fish Stat. and seafood (He et al., 2018). Already, global per capita seafood consumption has
Aquaculture surpassed fisheries as the main reported source of seafood meant
risen to about 20kg per annum, which is effectively double the consumption
for human consumption in 2014 (Figure 3). Aquaculture shows high projected
average in the 1960s, according to the latest FAO data (FAO, 2018:C).
growth compared to other food industries. Although growth rates have diminished
compared to the 1980s and 1990s, average annual production growth rates Aquaculture is perceived as a sustainable solution for meeting the growing
hovered around 5.8% during 2000–2016. A Planet Tracker analysis found that the demand for animal protein, especially considering the reduced natural capacity
top ten largest aquaculture companies with data available recorded an average of the world’s oceans, rivers and lakes (Béné et al., 2015). It is estimated that
five-year shareholder return of 422% (Planet Tracker, 2017). aquaculture production needs to at least double by 2050 to 160 million tonnes
annually. Assuming an average feed conversation ratio of 2:1, this currently means
Figure 3: Global capture fisheries and aquaculture production from 1990-2030 that around 320 million tonnes of feed is required to produce this volume of
seafood. Approximately 70% of these feeds require fishmeal and fish oil from
120
wild fisheries (NOAA, 2018). This volume accounts for a quarter of total fishery
Million tonnes (live weight equivalent)
100
volume, or over 20 million tonnes of wild seafood per year (Cashion et al., 2017).
80
Experts also estimate that the large majority of this fish diverted for fishmeal—up
60 90% — could instead be used to feed humans (Cashion et al., 2017). With
40 carnivorous fish that require fish as feed dominating the top ten fastest-growing
aquaculture species, investors must consider how the industry will meet growing
20
demand without compromising sustainability aspects and staying within the
0
planet’s production boundaries.
1990 1994 1998 2002 2006 2010 2014 2018 2022 2026 2030
Aquaculture for human consumption Total capture fisheries Capture fisheries for human consumption
14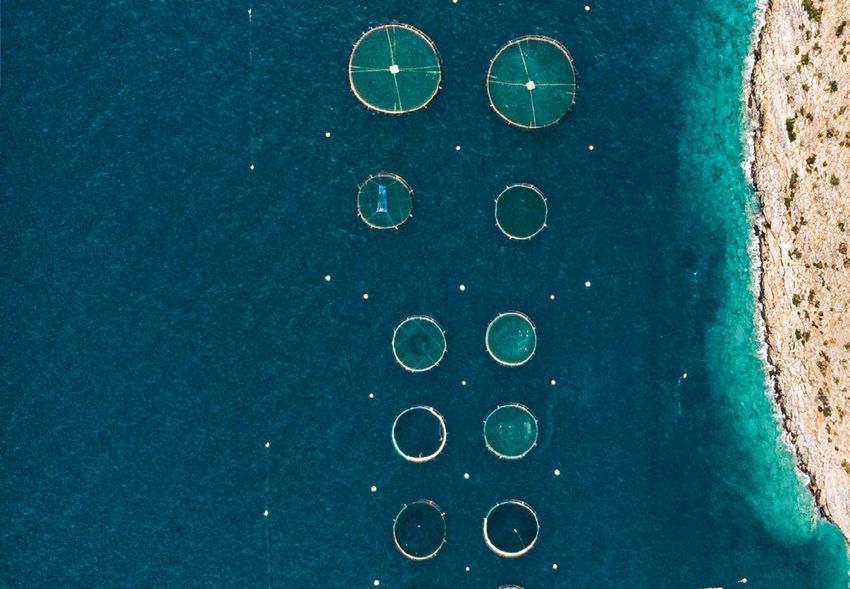
01 Overview of the aquaculture sector
Main species and production figures and trends Figure 4: Top aquaculture species in terms of quantity in 2016 (tonnes)
1 30,544,737
Aquaculture is a diverse industry that includes the farming of hundreds of species
of fish, crustaceans, molluscs and other aquatic animals (collectively referred to as
seafood). Many of these species are specific to certain geographies.
Carp and other cyprinids
In terms of global volume, the most important cultured seafood species in 2016
included carp, miscellaneous freshwater fish, and tilapia (Figure 4). The species
listed here are mostly produced in Asia, apart from salmonids (FAO 2018: C).
Carp is very popular in Asia, often serving as the main source of animal protein
in rural communities. Their production is an important part of the livelihood of
2 9,944,402
Miscellaneous freshwater fish
millions of households.
The most important species by value differ somewhat from those that are the
most harvested. In addition to carp (which ranks highly because of its high
volume), shrimp, freshwater crustaceans and salmonids derive the highest
3 5,898,793
Tilapia and other cichlids
economic value. (Figure 5).
In ranking production by country, China is by far the biggest producer, accounting
for just over 50% of global aquaculture production and producing nearly ten times
the amount of India, the second-ranking country. Seven of the top ten producers
4 5,594,822
Oysters
of farmed fish are in Asia, apart from Chile, Norway and Ecuador (FAO 2018:C).
Rank Species
Figure 5: Top aquaculture species in terms of value in 2016
Global value, 2016
(USD 000)
5 5,570,141
Clams, cockles, arkshell
1 Carp and other cyprinids 66,138,549
6 5,180,563
2 Shrimps, prawns 32,012,410
3 Miscellaneous freshwater fish 24,869,103
4 Freshwater crustaceans 22,531,882
Shrimp, prawns
5 Salmon, trout, smelts 19,220,049
7 3,319,715
6 Tilapia and other cichlids 11,285,571
7 Clams, cockles 9,610,646
8 Oysters 6,628,893
9 Scallops, pectens 5,607,886 Salmon, trout, smelts
10 Miscellaneous coastal fish 5,018,175
Country
Figure 6: Top farmed seafood producing countries by financial value, 2016
Rank by Value, 2016 (USD 000) Rank by Quantity, 2016 (tonnes)
8 2,280,687
Freshwater crustaceans
value quantity
China 1 144,715,879 1 49,245,828
India
Vietnam
Indonesia
2
3
4
10,644,800
9,345,987
8,992,524
2
4
3
5,700,000
3,624,538
4,985,002
9 2,126,930
Scallops, pectens
Chile 5 7,867,541 8 1,035,254
10 2,007,507
Norway 6 7,623,688 7 1,326,157
Bangladesh 7 5,621,080 5 2,203,554
Japan 8 3,962,281 12 676,786
Thailand 9 2,488,403 10 962,571 Mussels
Ecuador 10 2,338,810 15 451,085
16 Total 231,798,686 80,068,829
Source: FAO (2016) Global Aquaculture Production
01           Overview of the aquaculture sector

Ponds                                                                                                           Cages
Constructed by clearing coastal or inland                                                                       Floating structures made of a strong
areas of all vegetation and erecting a                                                                          frame of lightweight pipes that hold one
system of dikes and sluices to hold water.                                                                      or several nets to contain the cultured
To maintain water quality and oxygen                                                                            species. These floating systems are
levels, regular water exchanges are made                                                                        anchored to the seabed or lake bottom
using tidal currents or pumping systems.                                                                        using concrete sinkers.
Species farmed:                                                                                                 Species farmed:
Freshwater: carp                                                                                                Marine: salmon, sea bream, sea bass
Brackish water: shrimp, crabs                                                                                   Fresh or brackish water: tilapia

                                Major production systems                                                                                      Shift to high-intensity farming systems in Asia
                                Traditionally, most seafood is cultured in ponds or cages, which are located                                  Asian farmers focused on producing lower-value supply (such as carp and tilapia)
                                in marine, brackish or freshwater environments.                                                               for domestic markets often employ extensive farming methods, with seafood
                                                                                                                                              grown using more space but with less input. This requires fewer resources,
                                Both of these classic culture systems are characterised by their open nature.
                                                                                                                                              as carp are situated lower on the food chain and mainly consume plants and algae.
                                There is no boundary between the farm and wider aquatic environment.
                                This comes with significant environmental and social risks that have the                                      However, over the past 20 years, Asian countries have increasingly started to farm
                                potential to hurt financial performance (Parker, 2018).                                                       certain low-value species (like pangasius and tilapia) and high-value species (such as
                                                                                                                                              shrimp) for Western markets. In order to compete with Western producers, farmers
                                The associated risks with both methods are:
                                                                                                                                              now use highly intensive farming systems. These methods have high stocking
                                • waste from farms such as excess feeds, veterinary drugs and faeces;                                         densities and require excessive use of antibiotics and other veterinary drugs and
                                • effluents from agricultural farms, resulting in algal blooms; and                                           pesticides. While this greatly increases the production output of Asian operators,
                                                                                                                                              responsible in part for high growth rates, it also increases environmental impact.
                                • chemical wastes and micro plastics from factories and sewage systems.
                                                                                                                                              China is also beginning to produce many high-value species, such as salmon and
                                The effects of these risks across both methods are:                                                           sea bass, which have historically been produced primarily in Western countries.
                                • reduced growth rates and survival;
                                • mass mortality events; and
                                • plastic and chemical residues passed onto consumers.

 18
01 Overview of the aquaculture sector
10% 19%
19% 12%
48% 50%
1% 4%
21% 11%
2% 4%
Intra regional trade and imports Figure 7: North American trade flows of fish and fish products by continent Intra regional trade and imports Figure 8: Asian trade flows of fish and fish products by continent
(share of total imports, in value), 2016 (share of total imports, in value), 2016
Consumption trends and main markets Figure 9 – China’s dependence
on aquaculture in 2015
Per capita seafood consumption in Asia, by contrast, is very diverse. Landlocked
nations and India consume on average less than 10kg annually. Other countries
Global consumption for seafood is increasing. Per capita consumption of in Southeast Asia, such as Myanmar, have an annual per capita consumption rate
Wild catch
wild-caught and farmed seafood has grown from 9kg in 1961 to 20.2kg in 2015. 27% exceeding 7kg. Seafood consumption in China falls in between the extremes,
Average annual increases over this period (3.2%) accelerated faster than world and averages 30 to 50kg per capita annually – closer to consumption levels in
population growth (1.6%) and consumption of terrestrial animal
63%
North America and Europe. Seafood trade in Asia is balanced between 50%
protein (2.8%). originating from intra regional trade and the other half originating from imports
Historically, seafood consumption in Western countries has (by traded value), primarily from Europe (19%), North America (12%) and South
been relatively low, with annual per capita consumption in Europe America (11%)(Figure 8). China is heavily exposed to aquaculture in terms of seafood
ranging from ten to 25kg. In Europe, 63% of traded and Aquaculture consumption. While farmed seafood makes up approximately half of global seafood
73%
of traded and consumed seafood consumed seafood originates from intra regional or internal trade, consumption (with the other half coming from fisheries), in the case of China,
originates from intraregional with the continent being a strong producer of sea bass, sea bream farmed seafood makes up approximately 75% of seafood consumption (Figure 9).
and salmon. Asia provides 14% of the total trade value to Europe, This difference is partially due to demographic change; the fast-growing purchasing
or internal trade
followed by South America (9%) and Africa (8%) (FAO 2018:C). power of the middle-class in Asia has led to the farming of many high-value species,
North America has an equivalent per capita consumption of 25 which were once exclusively farmed for Western consumers. In 2017, China
to 30kg annually, but with very different trade figures (Figure 7). In North America, became the biggest buyer of salmon products ($300 million in 2016) (ITE Food
intra regional trade accounts for just 19% of total value, and the remaining 81% of its & Drink, 2017). Now, in addition to being the world’s largest producer and exporter
seafood trade and consumption is imported. The majority of these imports (48% of of seafood, China is also turning into the biggest importer and consumer of seafood
total seafood trade value, 59% of imports) come from China and ASEAN member (Harkell, 2018:C). China relies heavily on aquaculture to meet this new demand
states (FAO 2018:C), exposing North American-based investors to ESG-related (Figure 9).
risks that are associated with aquaculture in Asia.
2001 Overview of the aquaculture sector
Risks in international trade Industry structure
Seafood is the world’s most highly-traded With industrial-scale intensive aquaculture being a relatively young sector, the
food commodity, exposing seafood to actors are fairly fragmented. There are many small- and medium-sized businesses
considerable trade risk. In 2016, about 35% operating in this arena, particularly in Asia. The exceptions to this trend are salmon
of global seafood entered international trade producers in the UK and US, where the top five producers make up 95-96% of
with export value of $143 billion (FAO 2018: total salmon production (Mowi, 2018). In Asia, however, there are over 18 million
C). This is nearly triple that of soybeans, registered aquaculture sector workers, most of whom are engaged in small,
at $52 billion. family-owned businesses (FAO 2018:C). In China, the world’s top producer,
The US in particular is tightening import we see a trend towards further consolidation in the sector, driven by regulation
requirements for seafood, increasing risk aiming to make the sector more sustainable and internationally competitive.
for exporting countries that do not meet See page 128 for further information.
specified standards. In 2018, the US Typically, there is limited transparency throughout the sector (FAO, 2016: C).
government stated its aim to make the US This is particularly pertinent in Asia, where most production takes place.
more self-sufficient in seafood supply by There are relatively few publicly listed corporations in this region because the
expanding domestic production (Intrafish, industry is dominated by family-operated and government-funded businesses.
2018) and criticised perceived lower To capitalise on the relationship between the two sectors, many global businesses
standards in importing nations (Intrafish, active in the capture fisheries industry have diversified their investments by adding
2018: A) aquaculture to their portfolios, or vice versa. Cooke Seafood, which initially focused
New US regulation is increasing traceability on aquaculture, subsequently expanded its seafood activities into the capture
requirements for imported seafood. Nations fisheries through various acquisitions (Cooke, 2019). This results in significant
heavily reliant on exporting seafood to the overlap between capture and aquaculture fishery actors. For example, fish meal
US will have to meet these standards in order from fisheries is often used as feed for aquaculture operations, while the catch
to remain competitive. See pages 64 and 124 and production from both activities can be processed in the same factories.
for more details. Consequently, most publicly listed seafood companies are involved in both
industries, with limited transparency often making it hard to distinguish
between revenue streams from each activity (Planet Tracker, 2017).
Research shows that although the seafood industry consists primarily of many
smaller players and family-oriented enterprises, 13 of the largest seafood
businesses control a combined 11 to 16% of the global marine catch and
aquaculture production, and also control 19 to 40% of the largest and most
valuable stocks (Österblom et al., 2015). These businesses are active in all segments
of seafood production and dominate global decision-making processes, including
the development and direction of aquaculture certification schemes. Due to their
large impacts, these companies are referred to as keystone corporations.
35%
Figure 11 shows the top 30 listed seafood companies by estimated revenues
from aquaculture, as found by Planet Tracker. The list is dominated by companies
from Norway, Japan and North America. It is worth noting that these are regions
with limited aquaculture production compared with China and Southeast Asia,
signalling a gap in value production.
of global seafood entered
international trade with export
value of $143 billion
2201 Overview of the aquaculture sector
Figure 10: Top 30 listed seafood companies in terms of estimated revenues from aquaculture
Case study: Benchmarking producers on sustainability performance
Ticker Company name Headquarters Estimated revenues from
aquaculture (USD), as found
The Coller FAIRR Protein Producer Index assesses 60 global animal protein
by Fish Tracker producers on critical ESG issues. Of these companies, nine are pure seafood
AQUACHIL CI Empresas AquaChile SA Chile $618,628,000
companies engaged in aquaculture and five companies producing multiple
animal proteins including farmed seafood. We assess company performance
CAMANCHA CI Pesquera Camanchaca SA Chile $380,815,000
on nine risk factors: greenhouse gas emissions, deforestation & biodiversity loss,
AUSTRALI CI Australis Seafoods SA Chile $347,560,000 water scarcity, antibiotics, waste and pollution, working conditions, food safety,
300094 CH Zhanjiang Guolian Aquatic Products Co Ltd China $393,752,357 animal welfare, sustainable proteins.
BAKKA NO Bakkafrost P/F Faroe Islands $381,963,315 In 2018, the top three performing companies in the Index were all Nordic
CPRO IJ Central Proteina Prima Tbk PT Indonesia $644,888,946 aquaculture businesses, reflecting the relatively strong performance of these
companies relative to other protein producers, particularly those outside Europe.
1333 JP Maruha Nichiro Corp Japan $3,561,604,651
However, this sector still faces a number of sustainability challenges that we hope
1332 JP Nippon Suisan Kaisha Ltd Japan $2,403,284,966 to uncover through this report.
8041 JP OUG Holdings Inc Japan $1,626,063,346
FAIRR is currently assessing the companies for the 2019 Index. (Figure 12)
8058 JP Mitsubishi Corp Japan $1,118,590,117 Pure play aquaculture companies are now being assessed on 19 KPIs,
8030 JP Chuo Gyorui Co Ltd Japan $917,861,179 including five KPIs that are specific to the sector.
7538 JP Daisui Co Ltd Japan $568,043,125
8002 JP Marubeni Corp Japan $561,891,417
8228 JP Maruichi Co Ltd Japan $525,650,418
8038 JP Tohto Suisan Co Ltd Japan $490,947,009 Figure 11: Aquaculture companies assessed included in
the 2019 Coller FAIRR Protein Producer Index
2060 JP Feed One Co Ltd Japan $432,710,319
Ticker Company Proteins produced Headquarters
2874 JP Yokohama Reito Co Ltd Japan $400,186,769
QLG:MK QL Resources Berhad Multiple Malaysia
8091 JP Nichimo Co Ltd Japan $355,971,361 2282:JP NH Foods Ltd Multiple Japan
MHG NO Mowi ASA Norway $3,871,401,787 JAP:SP Japfa Ltd Multiple Singapore
LSG NO Leroy Seafood Group ASA Norway $1,637,258,849 CPF:TB Charoen Pokphand Foods PCL Multiple Thailand
1210:TT Great Wall Enterprise Co Ltd Multiple Taiwan
AUSS NO Austevoll Seafood ASA Norway $1,270,210,619
BAKKA:NO Bakkafrost P/F Seafood only Faroe Islands
SALM NO Salmar ASA Norway $1,076,926,581
AQUACHIL:CI Empresas AquaChile SA Seafood only Chile
GSF NO Grieg Seafood ASA Norway $780,601,445 GSF:NO Grieg Seafood ASA Seafood only Norway
NRS NO Norway Royal Salmon ASA Norway $503,809,274 LSG:NO Lerøy Seafood Group ASA Seafood only Norway
MOWI:NO Mowi ASA Seafood only Norway
CPF TB Charoen Pokphand Foods PCL Thailand $1,947,694,132
1332:JP Nippon Suisan Kaisha Ltd Seafood only Japan
43 HK CP Pokphand Co Ltd Thailand $407,385,000
SALM:NO SalMar ASA Seafood only Norway
TU TB Thai Union Group PCL Thaliand $1,906,424,763 TGR:AU Tassal Group Ltd Seafood only Australia
NOMD US Nomad Foods Ltd United Kingdom $457,103,231 TU:TB Thai Union Group PCL Seafood only Thailand
HVG VN Hung Vuong Corp Vietnam $807,046,017
Source: Planet Tracker (2017)
24Chapter 2:
Reviewing ESG risks in aquaculture is challenging due to the sector’s nascency
and the limited availability of information on certain topics and regions. In addition,
the severity and magnitude of impact of each of these ESG risks depends on the
ESG issues species, production system, geography and consumer preferences. However, this
section seeks to provide investors with an understanding of the significant and
in aquaculture material issues that are impacting the sector.
The global intensification
of aquaculture is rapidly
increasing its environmental
and social footprint.
This section of the report
presents ten ESG risks
that aquaculture faces
throughout the value chain.
2602 ESG issues in aquaculture
Financial levers
Legal and Regulatory
Reputation
Financial levers and timeline Production and Pricing
of risks to aquaculture Market Access
Short term Medium term Long term
Disease Transparency and food fraud Community resistance Habitat destruction and Fish feed Fish welfare
In Chile, the salmon farming In 2015, Chilean authorities In December 2018, the biodiversity loss Prices tend to fluctuate heavily In 2018, a report linked welfare
industry experienced an outbreak intercepted 37,200 cans of ‘horse government of British Columbia Companies are making significant with changing weather, especially standards with the financial
of infectious anaemia (ISAV) that mackerel’, which turned out to be reached an agreement with First investments to prevent farmed when impacted by severe El Niño performance of aquaculture
cost the sector $2 billion and Pacific menhaden, a lower-value Nations peoples to close several fish from escaping. As of February effects. In 2014, warming waters companies, demonstrating how
20,000 jobs. Due to the impact species. If sold, the mislabelled Mowi and Cermaq farms and 2019, Scottish Sea Farms said it caused a reduction in anchovy companies that prioritised welfare
of the epidemic, banks chose to cans would have retailed for over restrict salmon farming in coastal had installed new nets at 21 out yields in Peru, the world’s top fish issues experienced financial
renegotiate loans. However they $19 million. The costs of global areas that play an important role of 45 salmon farms in Scotland feed exporter. As a result, fish feed outperformance. The analyst
also considered forcing companies seafood fraud for unknowing in their livelihood. at a cost of £4.2 million and prices surged to $2,400 per ton, attributes this strong performance
into bankruptcy, highlighting the retailers and consumers have aimed to install them at nine compared to the average of to the mitigation of reputation
severe risk that disease presents not yet been monetised but more farms in 2019. $1,600 per ton. risk and the fish health benefits
to aquaculture. are significant. associated with higher
welfare standards.
Effluents Antibiotics GHGs Labour conditions
Algal blooms, caused by nutrient- The US imports about 70% of its Catches and fish feed prices In 2015, the European Commission
rich effluents, have disrupted seafood from Asia, half of which is depend heavily on El Niño and issued a ‘yellow card’ warning to
production in the salmon industry. cultured. In 2016 the US Food and other weather phenomena that Thailand following numerous
As of May 2019, the Norwegian Drug Administration (FDA) saw a are caused by global warming. In human rights abuses
salmon industry is suffering from record year for refusals to import Ecuador, shrimp production is likely in the country’s seafood supply
the worst algal bloom in 30 years. Asian shrimp due to contamination to outweigh demand in 2019 chains. The Commission
At time of writing, government with banned antibiotics. In January due to El Niño weather conditions. threatened to ban seafood imports
reports indicate the loss of 10,000 2019 the FDA prevented It is expected that the increased from the country altogether if
tonnes of salmon. An early estimate 26 shipments of Indian shrimp harvest will reduce the price of they did not see improvements.
from Sparebank1 Markets suggests from entering (15% of the total shrimp. The effects are starting The warning was lifted in 2019 but
it could impact up to 1% of for that month), due to detection to be noticed – in February 2019 highlights the legal and compliance
Norway’s salmon supply. A Nordea of banned antibiotics. India is the the average price for shrimp was concerns that could severely affect
Bank analyst estimates the loss country’s top shrimp supplier, $2.67/lb, compared with $2.96/lb the operations of some companies.
reduces forecasted global supply making up 35.2% of all imports. in the same month last year.
growth from 6.6% to 5.0%. The US is therefore highly exposed In South-East Asia, production of
to risks associated with antibiotic marine finfish is expected to drop
use in the Asian market. by up to 30% by 2050 due to
rising ocean temperatures.
2802 ESG Issues in Aquaculture
Greenhouse Aquaculture’s contribution to climate change
While estimates are scarce, emerging research suggests the rapid development of
gas emissions industrial scale aquaculture, as a result of plateauing fisheries stocks, is contributing
to increasing global GHG emissions (Yuan et al., 2019). GHG emissions are the
leading cause of climate change, which poses risks to the aquaculture sector and is
expected to bring severe ecological and biological changes in terms of productivity,
Climate change is having profound effects on aquaculture ecosystems around the species abundance, ecosystem stability and pathogen levels worldwide (FAO,
world. While contributing to increased GHG emissions, aquaculture is also affected 2016: B), all of which will have an impact on the operating costs of aquaculture
by the environmental impacts of climate change. Different geographies and companies. Overall, industrial aquaculture is contributing to climate change,
production systems are affected in different ways and certain production systems, while also being exposed to significant risks because of it.
such as cage and pond operations, are especially vulnerable to the effects, as many
Few estimates of the global aquaculture sector’s GHG emissions exist. FAO
of their environmental parameters are beyond farmers’ controls.
documents indicate that the “paucity of data” on GHG emissions in seafood supply
chains is inhibiting the development of measures to reduce energy use in the sector
(FAO, 2017). Further, the sector’s emissions are difficult to calculate as they are
usually accounted for across several national GHG inventories, including agriculture,
waste, fuel combustion and refrigeration. Carbon emissions released by land
conversions for aquaculture are rarely considered when calculating aquaculture
emissions. For example, the impact of converting wetland and mangrove areas into
fishponds is underestimated. From 2000 to 2015, 122 million tonnes of carbon
was released due to mangrove deforestation, which is equivalent to Brazil’s annual
emissions (Erickson-Davies, 2018). Wetlands also play an important role in the
global carbon cycle; they cover just 6% of the world’s land surface but contain 12%
of its global carbon pool (Erwin, 2009). In China, paddy fields are increasingly being
converted to aquaculture ponds (currently these conversions make up over 50%
of Chinese inland fish ponds) which is contributing to global warming from methane
emissions (Yuan et al., 2019). Finally, GHG emissions from aquaculture operations
vary widely, depending on the species cultured and the type of production system
used. However, a 2019 study found that freshwater aquaculture in the top 21
producing nations is responsible for 1.82% of global methane and 0.34% of
global nitrous oxide emissions (Yuan et al., 2019).
3002 ESG issues in aquaculture
Figure 12: Average GHG emissions per 40g / protein
How warmer water affects algae and fish
Farmed catfish
Beef
Climate change is associated with warmer water, which can be
Farmed shrimp problematic for several reasons:
Farmed tilapia
• Toxic algae prefer warmer water
Farmed carp
Pork • Warmer water mixes less, which allows algae that can be harmful to fish
Chicken to grow thicker and faster
Farmed salmon
• Small organisms move through warm water faster meaning algae can rise
Farmed molluscs
to water surface quickly, where they absorb sunlight and in turn heat up
0 1 2 3 4 5 6 7 8 9
GHG emissions (kg CO2 -eq)
the water further, contributing to more algal blooms (US EPA, 2019).
Source: Adapted from Hilborn et al. (2018)
For most species, the most emission-intensive stages of fish farming are in feed Asia
production. In Atlantic salmon and rainbow trout production, feed accounts for In Asia, sea surface temperatures are rising at higher rates than offshore areas,
around 87% of total GHG emissions (Rasenberg et al., 2013). Shrimp is an exception, with potentially severe implications for coral reefs, capture fisheries and
as on-farm energy use is the most emission-intensive stage. Intensive shrimp aquaculture. Warmer waters in the region are already having an impact by
farms require the use of aerators and pumping systems to maintain water quality, generating stronger and more frequent tropical storms that wipe out farm stock
which drives up the operational energy expenditure. and erase farm infrastructures. Southeast Asia, one of the world’s most productive
Compared to land animal proteins, average farmed salmon production has relatively aquaculture regions, is expected to experience a production drop of 10% to 30%
low GHG emissions. However, shrimp aquaculture GHG emissions are comparable (Froehlich et al., 2018). Shrimp farms located in the tropics are projected to suffer
to those arising from beef production: the data in Figure 12 suggest shrimp from rising sea levels, which could flood inland freshwater operations. Moreover,
production emissions are around 20% lower than beef production, however another ocean acidification is expected to lead to declines in mollusc production over
study suggests they are as high as in beef production (Poore and Nemecek, 2018). 2020-2060 (FAO, 2016: A). Diseases affecting salmon will also become more
prevalent due to climate change and warmer waters.
How climate risk impacts aquaculture Other regions
Some areas, however, especially in Africa and South America, are predicted to
Europe and North America
see aquaculture productivity increase by up to 30%. Some species, such as tilapia
In northern parts of Europe and North America, where temperatures are rising production in the tropical Pacific, may benefit from climate change (FAO, 2016: A).
fastest, severe impacts are expected to make it more challenging to farm salmon Aquaculture companies such as Tassal have reported that they are currently working
(Froehlich et al., 2018). However, climate impacts on the salmon sector are still on adaptation measures in response to rising sea temperatures and extreme
largely uncertain and require research. For example, warmer water and salinity weather events, including geographic diversification of its marine farm portfolio.
changes will likely result in increased salmon diseases and parasites, while pathogens
associated with a colder climate may be reduced (Troell et al., 2017). Overall, the lack
of clarity exposes investors in the European and North American salmon aquaculture
sector to risks.
3202 ESG issues in aquaculture
Case study: Climate change and salmon feed
Climate change will heavily impact fish meal fisheries, where catches are already Engagement questions
fluctuating due to El Niño weather impacts (FAO, 2016: B). Peru, the world’s
largest producer of fishmeal, is listed as one of 17 countries in which fisheries for investors
will be most vulnerable to climate change. This listing is based on an analysis of
a country’s exposure to global warming, the importance of fish production to
the economy and the country’s adaptive capacity (FAO, 2016: A). Overall, climate
change will affect raw material availability and further drive up operational costs Does the company have a strategy to reduce GHG emissions?
– particularly when considering feed already comprises 30-50% of salmon Does the company have or plan to set a science-based target
production costs. to reduce GHG emissions?
Case study: Mowi, formerly Marine Harvest, identifies and acts on climate
related business risks
Mowi conducted a materiality analysis to understand climate change-related Does the company report annually on scope 1, 2 and 3 emissions?
issues that are critical to the company and stakeholders, and the ability of the Does this include emissions from the sourcing of fish feed?
business to execute its strategy and operations. The materiality analysis highlights
areas of opportunity and risk, and the results define Mowi’s priorities and R&D
efforts, both at group and asset level.
The climate assessment considers chronic physical risks that could disrupt
Is there a downward trend in absolute emissions and/or
production capacity, such as changes to oceanic circulation and uncertain climate
emissions intensity?
variability patterns (e.g. El Niño), or changes in average precipitation. Mowi also
considers how its salmon farming operations are exposed to biological risks, which
might impact profitability and cash flows through adverse effect on factors such
as growth, harvest weight, harvest volume, mortality, downgrading percentage
and claims from customers (CDP, 2018). Has the company assessed how climate change might impact its
production sites and input costs?
What warming potentials does the company use as part of this exercise?
3402 ESG Issues in Aquaculture
Effluents Effluents, wastewater from aquaculture operations, are often discharged
in significant quantities, resulting in excess nutrients and waste polluting
the surrounding ecosystem.
They contain:
1. solid, organic waste such as faeces and uneaten feed;
2. excess nutrients, namely phosphorus and nitrogen; and
Effluents cause thick layers of sludge from faeces and excess feeds to form 3. chemical substances such as therapeutic drugs.
around ponds and below cages. They are associated with the following issues,
A study drawing on data from more than 38,000 animal and crop farms found
which impact company costs:
that farmed fish and crustaceans have a similar eutrophication impact to beef
Eutrophication. Excess nitrogen and phosphorous encourages the growth of production (Poore and Nemecek, 2018).
harmful algal blooms, which increases the chances of large-scale eutrophication
Most aquaculture production systems are open systems, with no boundary
(low oxygen levels in water). This means other marine life dependent on oxygen
between the farm and the wider environment. This means that all farm outputs
is unable to survive in the area. This can cause the deaths of farmed fish and other
are dispersed into local ecosystems, and consequently may not be used efficiently
wild aquatic animals in the area (Healey et al., 2016).
by the farm and can pollute local environments. For example, in China, researchers
Biodiversity impacts. In addition to harmful algal blooms, plants and animals concluded that nitrogen use efficiency ranged from 11.7% to 27.7%, whereas
living in benthic habitats can be physically smothered by particulate organic matter phosphorus use efficiency ranged from 8.7% to 21.2% (Zhang et al., 2015).
sinking and settling from marine farms, negatively impacting biodiversity. Effluent discharge is a greater issue in freshwater ecosystems and inland ponds,
Poor fish health. Excess feed encourages increase in pathogens, which may the most common aquaculture systems (Hall et al., 2011). Freshwater ecosystems
harm fish health. Poor water quality is known to affect gill health and the have lower flush rates, which means they are generally more susceptible to negative
immune system of farmed fish, increasing risk of mortality (Tett et al., 2018). impacts of pollution than marine ecosystems (Islam, 2005).
Companies typically deal with the issue of effluent discharge by leaving sites to
fallow after a production cycle ends, allowing a production area to rest and recover
naturally from farming impacts. However, research commissioned by the Scottish
government in 2018 indicates that the two-year fallowing period, as recommended
by the government at time of writing, may be insufficient to allow lochs to recover
over the longterm. This is due to lower flush rates in these areas. Research
undertaken at salmon farms in Canada, Scotland and New Zealand showed benthic,
or seabed, recovery rates ranging from a few weeks to six years, indicating the
complexity of measuring and managing benthic impacts. Authors noted that factors
determining recovery rates “seem not to be well understood” (Tett et al., 2018).
3602 ESG issues in aquaculture
Case study: Scottish and Irish regulatory action on marine pollution
Recent clashes between corporates and regulators suggest that the aquaculture
sector will experience stricter regulation of its environmental impacts.
Mowi Ireland has had a licence revoked for one of its production sites after
harvesting 121% of the stock specified in its licence. The company states that if
the stock at the farm cannot be sold, it would represent a loss of sales in 2020 of
€13.7 million – about 20% of its expected turnover next year – and potentially
undermines its viability.
According to Ireland’s agriculture and marine minister, Mowi harvested 1,100
tonnes of salmon from one Irish farm in 2016, despite the licence specifying a
production limit of 500 tonnes. He argued that the increase in stock will have
increased effluent discharge at the site, harming the local environment.
Mowi is appealing the regulator’s decision (Moore, 2019).
In May 2019, a BBC report named Mowi as one of several fish farmers under
investigation by the Scottish Environmental Protection Agency (SEPA) for possible
misreporting of chemical use. Mowi denied wrongdoing. Other producers under Case study: The financial impact of algal blooms on the salmon industry
investigation had not been named at time of writing. Algal blooms have disrupted production in the Norwegian and Chilean salmon
SEPA chief executive – Terry A’Hearn – said: “If companies do the right thing, industries. In 2016, Chile suffered from algal blooms that caused an estimated
then they have nothing to worry about. If companies do the wrong thing, we are $800 million in damage by killing nearly 27 million fish (20% of the country's
there to find that out and make sure they improve their game. If that’s going to salmon production that year) (Globefish, 2016). In 2018, the problem continued,
take tough action, you can be assured we’ll take it” (BBC, 2019). See the Appendix albeit with lower severity. Invermar, a Chilean salmon producer, reported a loss of
for further information on Scottish regulation. $8.25 million, which amounts to 4% of its $206 million revenue for that year (WSJ,
These events demonstrate the regulatory risks from high stocking densities on 2018:B), after algal blooms killed around 1,600 tonnes of salmon.
farms. Some governments are beginning to crack down on farms that practice The issue of algal blooms is not limited to certain geographies. As of May 2019,
overstocking due to increased pollution. See the Appendix for further Norway is currently experiencing its worst algal bloom in 30 years, causing
information on Scottish regulation. high mortalities at salmon farms (Furuset, 2019). On 21 May, the Norwegian
government confirmed that 10,000 tonnes of farmed salmon had been lost.
A Nordea Bank analyst, Kolbjørn Giskeødegård, noted that this figure does not
represent the full loss to the market, as it does not account for their potential
growth before harvest. Giskeødegård estimates this could represent a drop in
supply of 40,000 tonnes, which would lower forecasted global salmon supply
growth from 6.6% to 5.0%. He stated that companies affected by the bloom will
suffer, but conversely those unaffected are likely to benefit from higher prices.
At time of writing, the larger listed players were unaffected, but it is difficult to
forecast how the bloom may affect farms going forward (Ramsden, 2019).
This recent event demonstrates that algal blooms impact producers across
various salmon farming regions, including in Norway which has the most
stringent environmental protections. Warmer waters exacerbate the risk
of algal blooms, so strong environmental performance is not always
sufficient to protect against this risk.
38You can also read