Sheep's and Goat's Frozen Yoghurts Produced with Ultrafiltrated Whey Concentrates - MDPI
←
→
Page content transcription
If your browser does not render page correctly, please read the page content below
applied
              sciences
Article
Sheep’s and Goat’s Frozen Yoghurts Produced with
Ultrafiltrated Whey Concentrates
Natalí Garcia Marnotes 1,2 , Arona Figueroa Pires 1 , Olga Díaz 2 , Angel Cobos 2 and Carlos Dias Pereira 1,3, *

                                           1   Polytechnic Institute of Coimbra, College of Agriculture, Bencanta, 3045-601 Coimbra, Portugal;
                                               natali@esac.pt (N.G.M.); arona@esac.pt (A.F.P.)
                                           2   Department of Analytical Chemistry, Faculty of Sciences of Lugo, Nutrition and Bromatology,
                                               Food Technology Area, Universidade de Santiago de Compostela, E-27002 Lugo, Spain;
                                               olga.diaz.rubio@usc.es (O.D.); angel.cobos@usc.es (A.C.)
                                           3   Research Centre for Natural Resources, Environment and Society (CERNAS), Bencanta,
                                               3045-601 Coimbra, Portugal
                                           *   Correspondence: cpereira@esac.pt

                                           Featured Application: The present work envisages the valorization of cheese whey concentrated
                                           by ultrafiltration as the main ingredient of frozen yoghurts.

                                           Abstract: The objective of this work was the use of goat and sheep liquid whey concentrates (LWCs)
                                           produced by ultrafiltration (UF) for the manufacturing of frozen yoghurts. In a first step, natural
                                           yoghurts using only goat’s and sheep’s LWCs as raw material were obtained. One day after produc-
                                           tion, these yoghurts were used to produce frozen yoghurts with different concentrations of added
                                           inulin. The physicochemical characteristics of ewe’s and goat’s yoghurts were significantly different
                                 regarding dry matter, protein, fat and minerals. Ewe’s yoghurts were solid, while goat’s yoghurts

                                           behaved as a viscous liquid. Frozen yoghurts with different levels of inulin addition also presented
Citation: Marnotes, N.G.; Pires, A.F.;
                                           significant differences concerning physicochemical and microbiological characteristics. Overrun
Díaz, O.; Cobos, A.; Pereira, C.D.
                                           was similar for all formulations except for that produced with ewe’s LWC containing 5.0% inulin,
Sheep’s and Goat’s Frozen Yoghurts
                                           which presented a significantly higher value. Higher meltdown rates in goat’s frozen yoghurts were
Produced with Ultrafiltrated Whey
Concentrates. Appl. Sci. 2021, 11, 6568.
                                           observed. The survival rates of lactic acid bacteria were lower than the data reported for similar
https://doi.org/10.3390/                   products. Concerning sensory acceptance, both products showed encouraging results. It can be
app11146568                                considered that the production of frozen yoghurts by using LWCs as the main ingredient can be an
                                           interesting option to broaden the product portfolio of small/medium scale dairy producers.
Academic Editor: Malgorzata Ziarno
                                           Keywords: ovine; caprine; cheese whey; ultrafiltration; frozen yoghurt; inulin
Received: 28 May 2021
Accepted: 9 July 2021
Published: 16 July 2021

                                           1. Introduction
Publisher’s Note: MDPI stays neutral
                                                 The dairy industry causes the production of wastewaters and effluents that can have
with regard to jurisdictional claims in
                                           a significant environmental impact because of their pollutant characteristics [1–3]. Whey
published maps and institutional affil-
                                           is the by-product of the cheese industry that has received most attention, not only due to
iations.
                                           its environmental impact if disposed without prior treatment but also as a result of the
                                           progressive evidence of the nutritional importance of its constituents [4–6].
                                                 The high organic load of whey arises from the presence of residual milk compounds,
                                           with lactose being its major constituent (ca. 5% w/v). It has a very high biochemical
Copyright: © 2021 by the authors.
                                           oxygen demand (BOD) and chemical oxygen demand (COD) (30–50 g/L and 60–80 g/L,
Licensee MDPI, Basel, Switzerland.
                                           respectively). Its annual production surpasses 160 million tons and shows an estimated
This article is an open access article
                                           growth rate of 1–2% yearly, as a result of a similar trend in cheese production [7]. The
distributed under the terms and
                                           quality of whey components depends on the type of the process used and the opera-
conditions of the Creative Commons
                                           tion conditions occurring during its production [8,9]. Various technological approaches
Attribution (CC BY) license (https://
creativecommons.org/licenses/by/
                                           have been employed to valorize whey [10–12]. These technologies are mainly applied to
4.0/).
                                           whey resulting from cow’s milk. The technological advancements have enhanced whey

Appl. Sci. 2021, 11, 6568. https://doi.org/10.3390/app11146568                                                 https://www.mdpi.com/journal/applsci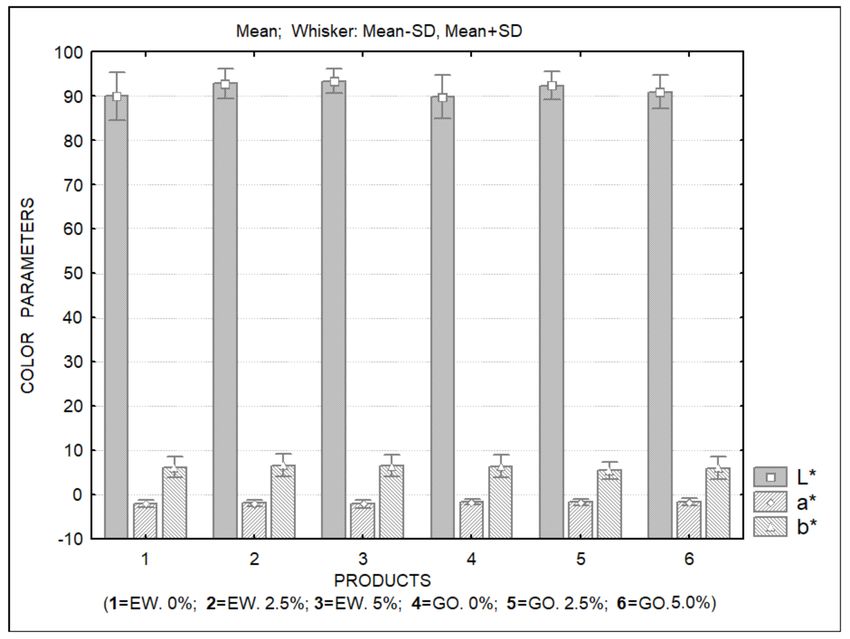
Appl. Sci. 2021, 11, 6568                                                                                           2 of 20

                            utilization and about 50% of the total produced whey is nowadays transformed into value-
                            added products such as whey powder, whey protein concentrates, whey protein isolates,
                            individual whey proteins, bioactive peptides, whey permeate, bioethanol, biopolymers
                            and other valuable materials [13]. Among various value-added products, the transfor-
                            mation of whey into proteinaceous products is attractive and is experiencing increased
                            demand. These proteinaceous products have applications as functional, nutritional, and
                            therapeutic commodities.
                                  In the case of the whey resulting from the manufacturing of ewe’s and goat’s cheeses,
                            this by-product is often used to produce whey cheeses, such as Ricotta, Requesón or Requeijão,
                            in Italy, Spain and Portugal, respectively. However, not all of this whey is transformed
                            into whey cheeses, with a large proportion being used as animal feed or directly discarded.
                            This results from the constraints associated with whey cheese production, namely the high
                            energy inputs required for the thermal precipitation of whey proteins which, along with
                            the short shelf-life of whey cheeses, discourage its application [14,15]. In previous works,
                            we proposed solutions for the valorization of whey resulting from the manufacturing of
                            small ruminant’s milk cheeses [16–23]. Most of the solutions proposed envisage the direct
                            utilization of this by-product after a concentration step performed by ultrafiltration (UF).
                            However, the adoption of such technologies by cheese producers is hindered by several
                            factors, of which the small dimensions of the cheese production units and the lack of
                            technical skills are determinants. In addition, these producers are mainly focused on cheese
                            production and are not familiar with the production and marketing strategies of other dairy
                            products. However, the possibility of the valorization of these by-products through the
                            production of innovative dairy products targeting local consumers and/or niche markets
                            may stimulate novel approaches in line with circular economy imperatives.
                                  Yoghurt is a fermented dairy product obtained by the activity of a mixed culture of
                            Lactobacillus delbrueckii subsp. bulgaricus and Streptococcus thermophilus in milk. Fermenta-
                            tion of lactose produces lactic acid, which acts on milk protein, giving the texture and other
                            sensory characteristics of yoghurt. Frozen dairy products have properties of both yoghurt
                            and ice cream and can be the carriers of lactic acid bacteria and/or probiotics. In recent
                            years, the production of frozen yoghurts or frozen yoghurts with added prebiotics and pro-
                            biotics created new opportunities for the development of products with health-promoting
                            properties beyond their nutritional value. The production of ewe’s and goat’s yoghurts
                            and frozen yoghurts has also followed this trend [24–26].
                                  The aim of this work was to manufacture frozen yoghurts with or without different
                            concentrations of inulin using goat and sheep liquid whey concentrates produced by
                            ultrafiltration, and to study their physicochemical, microbiological and sensory properties
                            in order to evaluate the feasibility of the use of these by-products by the dairy industry. As
                            follows from the literature reports, there are no studies regarding the production of frozen
                            yoghurt with goat and sheep liquid whey protein concentrates.

                            2. Materials and Methods
                            2.1. Production of Liquid Whey Concentrates
                                 Sheep and goat cheese whey, supplied by external dairy companies, was taken to
                            the pilot plant of the Escola Superior Agrária de Coimbra (Coimbra, Portugal), where it
                            was processed. A total of 500 L of each type of whey (ewe’s or goat’s) were subjected
                            to ultrafiltration (UF) in a Proquiga Biotech SA pilot plant (A Coruña, Spain), equipped
                            with a UF organic membrane (3838 PVDF/polysulfone) with an effective filtration area
                            of 7 m2 and 10 kDa cutoff, supplied by FipoBiotech, Spain. The process was carried out
                            at 40–45 ◦ C, at a transmembrane pressure of 0.35 MPa aiming at a volumetric concen-
                            tration factor (VCF = Vol. Feed/Vol. retentate) of 20, obtaining 25 L of concentrate. The
                            concentrate was pasteurized (65 ◦ C, 30 min) and then homogenized at 10 MPa using
                            a homogenizer APV Rannie™ model Blue Top (Copenhagen, Denmark). Liquid whey
                            concentrates (LWCs) were frozen at −25 ◦ C until the moment they were used to produce
                            yoghurts and frozen yoghurts.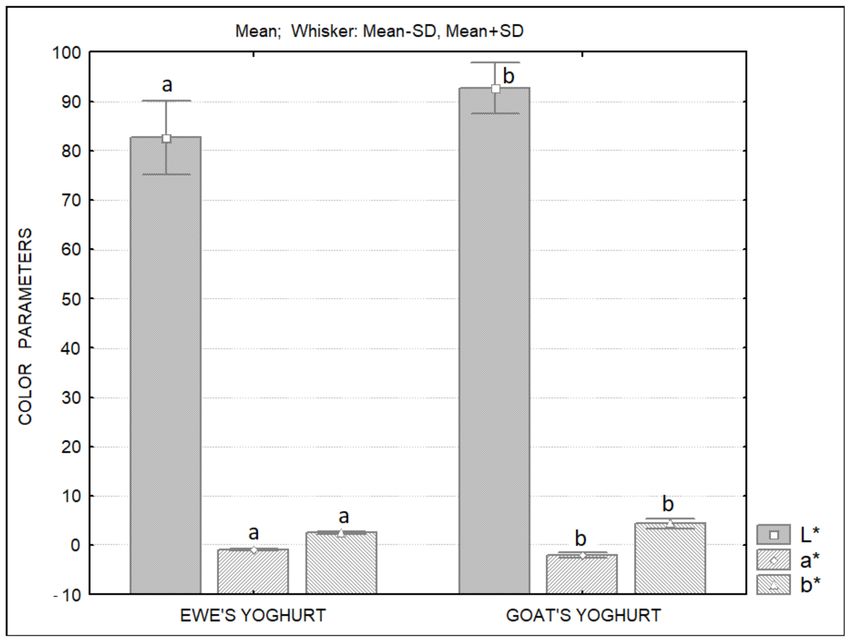
Appl. Sci. 2021, 11, 6568                                                                                                            3 of 20

                            2.2. Manufacture of Yoghurt and Frozen Yoghurt
                                  Twelve liters of sheep’s or goat’s LWCs were thawed under refrigeration for 24 h.
                            Subsequently, LWCs were heated at 65 ◦ C and homogenized using APV Rannie™ model
                            Blue Top (Copenhagen, Denmark) at 10 MPa. Subsequently, the samples were heated
                            to 85 ± 5 ◦ C and homogenized again in order to achieve a particle diameter of whey
                            protein aggregates less than 10 µm to avoid granularity and increase the smoothness of
                            the concentrate. The concentrates were then cooled to 44 ◦ C and inoculated with Yoflex™
                            (YF-L903, CHR Hansen, Denmark) thermophilic yoghurt starter culture at a concentration
                            of 0.005% (w/v).
                                  The inoculated goat and sheep LWCs were placed in an incubation chamber (Jenogand
                            Y 1000) at 43 ◦ C, and the pH and titratable acidity were monitored until the products
                            reached a pH value of 4.6. Fermentation was stopped by rapid cooling to 20 ◦ C in less than
                            30 min. Afterwards, the yoghurts were placed in the refrigeration chamber at 2 ± 2 ◦ C for
                            12 h.
                                  For each type of LWC yoghurt, three frozen yoghurts with increasing inulin concen-
                            trations were produced. The remaining ingredients used in frozen yoghurt formulations
                            were added in the proportions presented in Table 1.

                            Table 1. Formulations used for the production of frozen yoghurts (% w/w).

                                        Product                      0% Inulin                2.5% Inulin               5% Inulin
                                    LWC yoghurt                         89.4                      86.9                      84.4
                                       Inulin 1                          0.0                       2.5                       5.0
                                     Guar gum 2                          0.1                       0.1                       0.1
                                    Xanthan gum 3                        0.1                       0.1                       0.1
                                       Honey 4                           5.0                       5.0                       5.0
                                       Sugar 5                           5.0                       5.0                       5.0
                                     Citric acid 6                       0.4                       0.4                       0.4
                            Suppliers of ingredients: 1 Inulin: Fibruline™XL, Cosucra, supplied by Induxtra de Suministros, Moita, Portugal;
                            2, 3 Formulab, Maia, Portugal; 4 Aldi, Portugal; 5 RAR, Porto, Portugal; 6 J.M. Vaz Pereira, Lisbon, Portugal.

                                  The ingredients were added to yoghurts and stirred until a homogeneous distribution
                            was obtained. The mix was allowed to mature for 12 h at 0 ± 2 ◦ C in the chamber. For
                            each formulation, two 1 L batches of frozen yoghurts were produced in a laboratory-scale
                            frozen yoghurt freezer (Klarstein, Electronic Star) for 40 min. Immediately after freezing,
                            the temperature of frozen yoghurts was −6 ± 1 ◦ C. After this process, the frozen yoghurts
                            were packaged in 500 mL polypropylene boxes and stored in a Zanussi freezer chest at
                            −21 ± 1 ◦ C for 21 days. Formulations 1, 2 and 3 correspond to ewe’s frozen yoghurts with
                            0, 2.5 and 5.0% added inulin, while formulations 4, 5 and 6 correspond to goat’s frozen
                            yoghurts with 0, 2.5 and 5.0% added inulin. All experiments were performed in triplicate.

                            2.3. Physico-Chemical Analysis
                            2.3.1. Compositional Analysis
                                 Dry matter was determined by drying the samples in a Schutzart DIN 40050-IP20
                            Memmert™ oven, according to NP 703: 1982 for yoghurt [27] and AOAC (1997) for frozen
                            yoghurt [28]. The ash content was determined by the incineration of dry samples in a
                            Nabertherm™, model LE 4/11/R6 electric muffle furnace at 550 ◦ C for 4 h, according
                            to AOAC method 935.42 [28]. The fat content was determined by the Gerber method
                            (SuperVario-N Funke Gerber™ centrifuge) according to NP 469: 2002 [29] and by the
                            Soxhlet method using 2050 Soxtec Auto Extraction Unit Foss Tecator™. The total N content
                            was determined by the Kjeldahl method in the Digestion System 6 1007 Digester Tecator™
                            following the AOAC (1997) standard, and the conversion factor of 6.38 was used to calculate
                            the percentage of protein [28]. All analyses were performed in triplicate.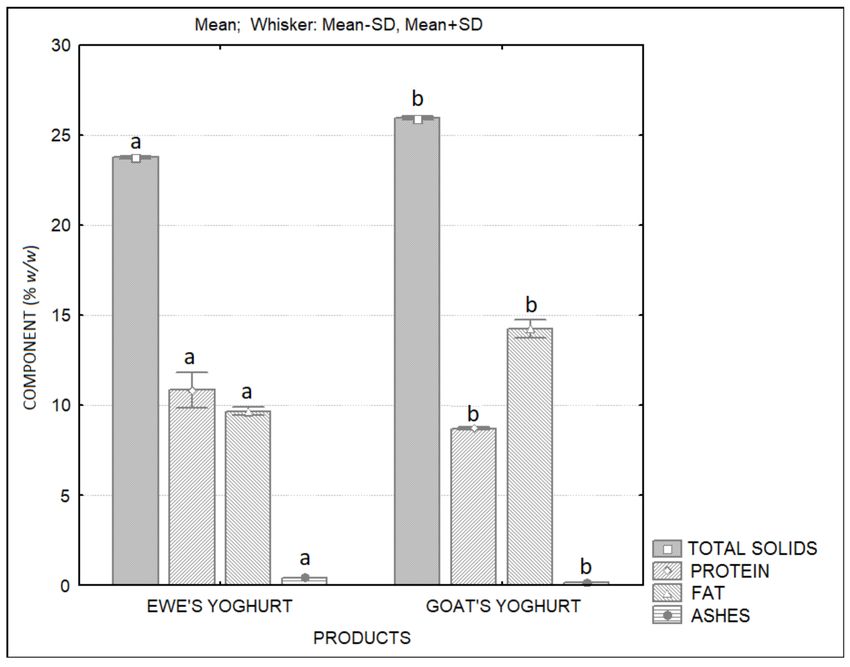
Appl. Sci. 2021, 11, 6568                                                                                           4 of 20

                            2.3.2. PH and Titratable Acidity
                                  The pH was determined with a HI 9025 HANNA Instruments pH meter, in order to
                            monitor its evolution over yoghurt fermentation, immediately after the production of the
                            yoghurts and on the 7th, 14th and 21st days of storage of frozen yoghurts. The pH meter
                            was previously calibrated with 7.01 (HI5007) and 4.01 (HI5004) Hanna buffer solutions.
                            The titratable acidity, expressed in g of lactic acid per liter, was determined by means of
                            titration using a 0.1 N NaOH solution according to the technique described in NP 701:
                            1982 for yoghurts [30] and AOAC (1997) for frozen yoghurts [28]. For each sample, three
                            determinations were made both for pH and for titratable acidity.

                            2.3.3. Color Analysis
                                 The color of the yoghurt and frozen yoghurt was determined with a Minolta Chroma
                            Meter, model CR-200B colorimeter calibrated with a white standard (CR-A47: Y = 94.7; x
                            0.313; y 0.3204). The following conditions were used: illuminant C, 1 cm diameter aperture,
                            10◦ standard observer. The color coordinates were measured in the CIEL*a*b* system.
                            Color difference (∆Eab*) was calculated as:
                                                                                                     1
                                                    ∆Eab* = [(L*-L*0) 2 + (a*-a*0) 2 + (b*-b*0)2 ]   2                 (1)

                            where L*0, a*0, and b*0 were the values measured for ewe’s yoghurt and L*, a*, and b* were
                            the values measured for goat’s yoghurt. In the case of ice cream formulations, a matrix
                            of ∆Eab* values between products was constructed. Five measurements were taken for
                            each sample.

                            2.3.4. Viscosity of Yoghurts
                                 The evaluation of the yoghurt viscosity was carried out in triplicate for 10 min (30 s
                            intervals), in a rotational Brookfield Viscometer, model DV2T, with a concentric cylinder RV
                            (spindle 3) at a constant angular speed (100 rpm for goat’s yoghurt and 1 rpm for sheep’s
                            yoghurt). The viscosity of the samples was the mean value of the viscosity measurements
                            recorded during the 10 min of analysis. Three measurements were taken for each sample.

                            2.3.5. Rheological Analysis of Yoghurts
                                 The rheological properties of the yoghurts were evaluated in a rheometer (Rheostress
                            1, ThermoHaake™) in oscillatory mode. The measurement system consisted of a cone and
                            plate geometry, C60/Ti-0.052 mm (35 mm diameter and 1◦ angle). Stress sweep tests were
                            performed at 1 Hz to investigate the rheological linear viscoelastic behavior of the yoghurts.
                            The elastic modulus (G0 ), the viscous modulus (G”) and the complex viscosity (η*) of the
                            products were evaluated in the range of 0.3 to 6.5 rad/s at 3 Pa. Three measurements were
                            taken for each sample.

                            2.3.6. Texture of Yoghurts
                                  A Stable Micro Systems texture analyzer, model TA.XT Express Enhanced, was used
                            to perform the texture analysis of the yoghurts one day after production, and the results
                            were calculated using the Specific Expression PC software. A TPA-type test was run with a
                            penetration distance of 20 mm at 2 mm/s using an acrylic cylindrical probe with a diameter
                            of 25.4 mm and a height of 38.1 mm. The following parameters were quantified: hardness,
                            adhesiveness, gumminess (the product of hardness and cohesiveness), cohesiveness, and
                            resilience [31]. Five measurements were taken for each sample.

                            2.3.7. Overrun
                                 Overrun is the increase in the volume of the yoghurt when making frozen yoghurt due
                            to the incorporation of air. The method described by Skryplonek et al. [32] was followed,
                            measuring the weight of the yoghurt and that of the frozen yoghurt with the same volume.
                            The determinations were done in triplicate.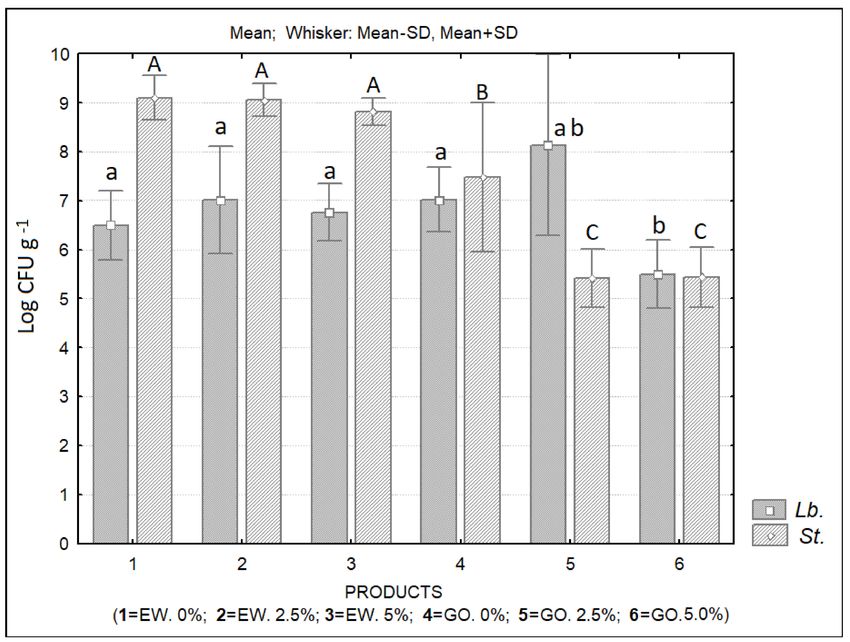
Appl. Sci. 2021, 11, 6568                                                                                                 5 of 20

                 Overrun [%] = (weight of yoghurt-weight of frozen yoghurt/weight of frozen yoghurt) × 100

                                 2.3.8. Meltdown Rate
                                      The meltdown rate was determined by the method described in Skryplonek et al. [33]
                                 by placing 30 g of frozen yoghurt on a stainless-steel screen with 1 × 1 mm opening,
                                 located on top of a beaker. After 45 min at 20 ± 1 ◦ C, the weight of the sample collected
                                 in the beaker was measured (n = 3). The meltdown rate was expressed as the percentage
                                 of the melted frozen yoghurt weight divided by the initial frozen yoghurt weight. The
                                 determinations were done in triplicate.

                   Meltdown [%] = (weight of melted frozen yoghurt/initial weight of frozen yoghurt) × 100

                                 2.4. Microbiological Analysis
                                       The microbial counts of lactic acid bacteria (LAB) of the genera Streptococcus and Lacto-
                                 bacillus were analyzed after production and during storage at −21 ◦ C of frozen yoghurts.
                                 Streptococci and lactobacilli were enumerated on plates at 37 ◦ C for 48 h on M17 agar (in
                                 aerobiosis) and on MRS agar (in anaerobiosis) (Biokar Diagnostics, France), respectively,
                                 according to ISO 7889, IDF 117 (2003) [34]. In this process, 1 mL of dilutions of 10−5 , 10−6
                                 and 10−7 were inoculated in triplicate along with two controls for each medium.

                                 2.5. Sensory Analysis
                                      Consumer preference tests were conducted with an untrained panel within 6 days of
                                 storage, both for yoghurts and frozen yoghurts. The hedonic test was used to determine
                                 the degree of acceptability of the products [35]. A category-type scale with an odd number
                                 (five) categories (1 = I don’t like it at all to 5 = I like it very much) was used. A neutral
                                 midpoint (neither like nor dislike) was included.
                                      In the case of yogurts, 34 non-trained members rated the product with regard to
                                 aroma, texture, taste and global evaluation. In frozen yoghurts, the six formulations
                                 were presented to panelists that were asked to evaluate the characteristics of consistency,
                                 appearance, aroma, flavor, and global evaluation using a hedonic scale from 1 to 5. Thirty
                                 consumers participated in the panel.

                                 2.6. Statistical Analysis
                                       IBM SPSS Statistics version 19 for Windows (2010; SPSS Inc., Chicago, IL, USA) was
                                 used for data evaluation. Prior to statistical analysis, normal distribution was tested using
                                 the Kolmogorov–Smirnov test. Three types of analysis of variance were carried out. One-
                                 way ANOVA and the Tukey post hoc test were used to test and compare, respectively, the
                                 statistical significance of differences among means.
                                       Two-way ANOVA was used to determine the interactions between the species and
                                 the amount of inulin added in chemical composition, pH, color parameters, overrun and
                                 meltdown rate. Three-way ANOVA was performed to establish the interactions among
                                 the species, the inulin amount and the storage time in microbial counts. The general linear
                                 model procedure was applied. For all mean evaluations, a significance level of p < 0.05
                                 was used.

                                 3. Results and Discussion
                                      Ewe’s and goat’s yoghurts produced with UF concentrated whey were significantly
                                 different regarding their composition and textural properties. As it can be observed
                                 in Figure 1, ewe’s yoghurts presented lower solids content than goat’s yoghurts. The
                                 main differences resulted from the significantly lower fat content of ewe’s yoghurts when
                                 compared to goat’s yoghurts. However, ewe’s yoghurts presented significantly higher
                                 amounts of protein and minerals. These differences resulted from the different gross
                                 chemical composition of the original sheep’s and goat’s whey, which were reflected in
                                 the UF whey concentrates. The original ewe’s whey presented 0.76 ± 0.07% protein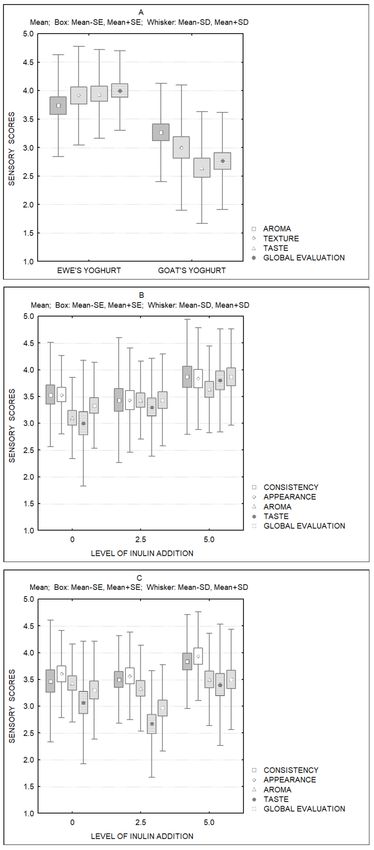
Appl. Sci. 2021, 11, 6568                                                                                                                   6 of 20

                                and 0.68 ± 0.02% fat, while the original goat’s whey presented 0.61 ± 0.01% protein and
                                0.87 ± 0.14 fat.

      Figure 1. Gross composition of ewe’s and goat’s yoghurts produced with UF concentrated cheese whey. Different letters
      indicate significant differences (p < 0.05) between components of ewe’s and goat’s yoghurts.

                                     Ewe’s yoghurts demonstrated a solid nature and were much harder than goat’s
                                yoghurts, which behaved as a viscous liquid (hardness values of 13.5 and 0.5 N, respectively,
                                for ewe’s and goat’s yoghurts). All texture parameters were significantly different between
                                both products. Large differences were also observed in the viscosity of both types of
                                yoghurt (Table 2). These differences result mainly from the protein content differences,
                                which in the case of goat’s LWCs was probably below the minimum concentration required
                                to form a structured gel.

                                Table 2. Texture parameters of ewe’s and goat’s yoghurts one day after production (mean values and
                                standard deviation).

                                         Parameter                          Ewe’s Yoghurt                             Goat’s Yoghurt
                                                                      Mean                    ±                  Mean                  ±
                                      Hardness (N)                    13.55 a               0.33                0.50 b               0.08
                                    Adhesiveness (N.s)                 0.53 a               0.03               −0.51 b               0.10
                                     Gumminess (N)                    13.52 a               0.34                0.47 b               0.08
                                      Cohesiveness                    1.00 a                0.01                0.93 b               0.02
                                       Resilience                      0.90 a               0.02                0.04 b               0.01
                                     Viscosity (Cps)                16 946.67 a             46.19              143.33 b             12.66
                                Different superscript letters indicate significant (p < 0.05) differences between values in rows.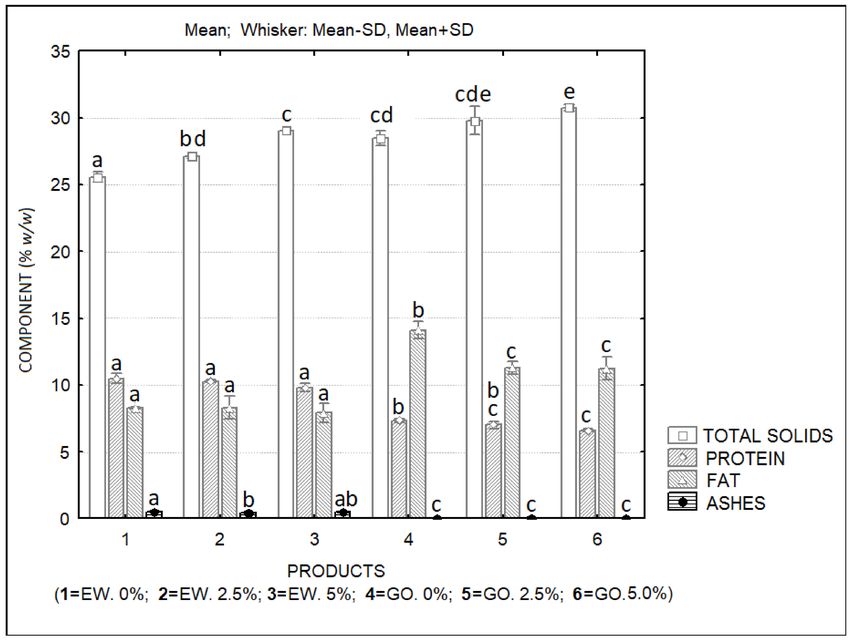
Appl. Sci. 2021, 11, 6568                                                                                                     7 of 20

                                       Small strain oscillatory tests also confirmed the differences in texture of both products.
                                 Goat’s yoghurts behaved as liquids, with the viscous modulus (G00 ) being higher than the
                                 elastic modulus (G0 ), while ewe’s yoghurts presented higher values for G0 (Figure 2). Clear
                                 differences can also be seen concerning the complex viscosity of both products, with higher
                                 values for ewe’s yoghurt.

      Figure 2. Elastic (G0 ) and viscous (G00 ) moduli and complex viscosity of ewe’s (A,B) and goat’s (C,D) yoghurts produced
      with UF concentrated cheese whey.

                                       Regarding color parameters (Figure 3), it could be observed that ewe’s yoghurts were
                                 significantly darker (lower L* values) when compared to goat’s yoghurts. Goat’s yoghurts
                                 presented slightly lower values for the parameter a* (green–red axis) and slightly higher
                                 values for the parameter b* (blue–yellow axis). The average calculated color difference
                                 (∆Eab*) between both products was 10.22, which indicates that it is immediately perceptible
                                 by the observer.
                                       As expected, the different composition of yoghurts was reflected in the composition
                                 of frozen yoghurts with different levels of added inulin (Figure 4). Ewe’s frozen yoghurts
                                 presented higher levels of protein and lower levels of fat. The fat content of formulation
                                 4 (goat’s frozen yoghurt without inulin addition) is significantly higher than all other
                                 formulations. This difference might have resulted from an uneven distribution of fat,
                                 possibly resulting due to changes in the homogenization process of the yoghurt used in
                                 this formulation. Interactions between species and inulin amount added for fat and ash
                                 contents were observed (Table 3).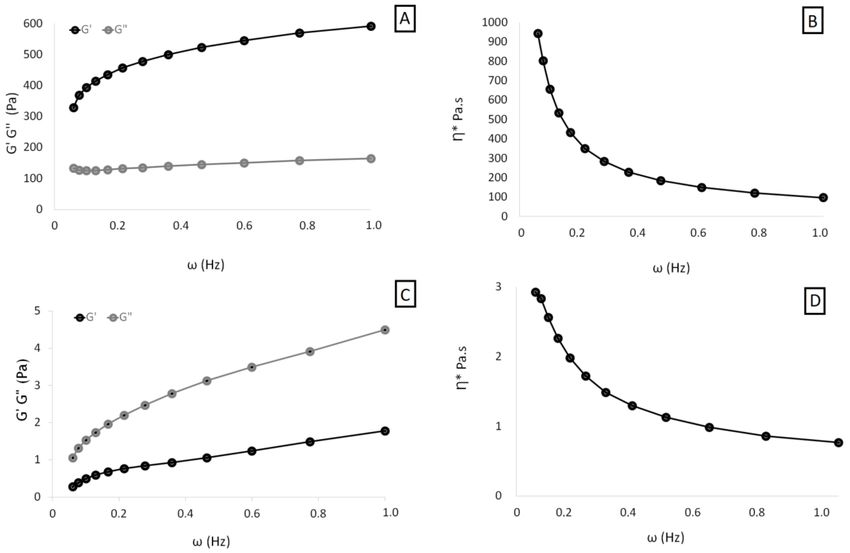
Appl. Sci. 2021, 11, 6568                                                                                                  8 of 20

      Figure 3. CIEL*a*b* color parameters of ewe’s and goat’s yoghurts produced with UF concentrated cheese whey. Different
      letters indicate significant differences (p < 0.05) between components of ewe’s and goat’s yoghurts.

                                Table 3. Interactions between species and inulin addition observed in chemical composition and pH
                                of frozen yoghurts.

                                                          Total Solids          Protein            Fat    Ash   pH     Acidity
                                  Species×Inulin               NS                  NS               **     *    ***      ***
                                 NS—not significant (p > 0.05); * p < 0.05; ** p < 0.01; *** p < 0.001.

                                     The pH and titratable acidity of ewe’s and goat’s frozen yoghurts are displayed in
                                Figure 5. These parameters were evaluated weekly, over 3 weeks of frozen storage. For
                                each formulation, a slight increase in pH and a decrease in titratable acidity values were
                                observed during storage. Interactions between species and inulin amount added for both
                                parameters were observed (Table 3).
                                     In all cases, the pH of yoghurts at the first day of storage was below the target
                                value defined for yoghurt production (4.5). This, most probably, resulted from the slow
                                refrigeration of the 2 L flasks in which they were produced. Although the flasks were
                                rapidly cooled to 20 ◦ C, the activity of microorganisms was not slowed down as rapidly as
                                intended. Formulations 5 and 6 (goat’s yoghurts with 2.5 and 5.0% added inulin) presented
                                significantly lower pH and higher acidity values when compared to all other formulations.
                                Ewe’s and goat’s original whey presented similar pH and acidity values (ca. pH 6.65 and
                                0.015% lactic acid). However, the goat’s UF concentrated whey presented an acidity value
                                higher than the ewe’s whey, meaning that acidification of goat’s whey occurred during the
Appl. Sci. 2021, 11, 6568 9 of 20
UF concentration process. In our opinion, the presence of inulin cannot be considered as
a possible explanation for the pH reduction (ca. 0.65 and 0.45, respectively) of those two
formulations, since the same pattern was not observed with ewe’s frozen yoghurts.
Figure 4. Gross chemical composition of ewe’s and goat’s frozen yoghurts produced with UF concentrated cheese whey
over 21 days of refrigerated storage (EW. 0% = ewe’s yoghurt with 0% inulin addition; EW. 2.5% = ewe’s yoghurt with
2.5% inulin addition; EW. 5.0% = ewe’s yoghurt with 0% inulin addition; GO. 0% = goat’s yoghurt with 0% inulin addition;
GO. 2.5% = goat’s yoghurt with 2.5% inulin addition; GO. 5% = goat’s yoghurt with 5% inulin addition). Different letters
indicate significant differences (p < 0.05) between components of ewe’s and goat’s frozen yoghurt formulations.
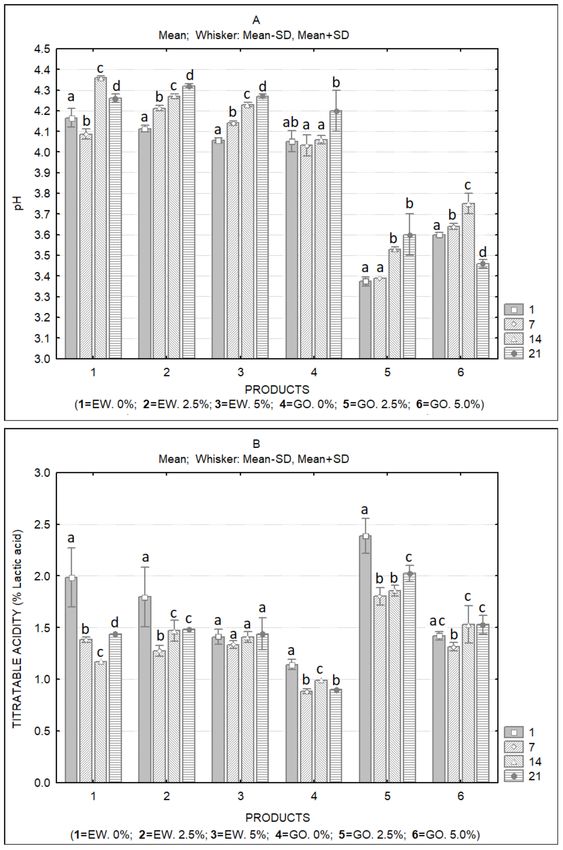
The color parameters of frozen yoghurts (Figure 6) were slightly different from those
of the original yoghurts, with the differences being more marked in ewe’s frozen yoghurts.
The lightness (L*) increased in ewe’s frozen yoghurts as compared to the original products,
and a similar trend was observed regarding the b* parameter (increased yellowness). These
changes are probably the result of air incorporation during the freezing process. Interac-
tions between species and inulin amount added for color parameters were not observed.
Table 4 presents a matrix of the color differences between all frozen yoghurt formulations.
Although non-significant differences were found between the color parameters L*, a* and
b* of frozen yoghurts, slight color differences (∆Eab*) (Table 4) were found between most
formulations, since values higher than 1 can be perceived by the observer [36].Appl. Sci. 2021, 11, 6568 10 of 20
Figure 5. (A) pH and (B) titratable acidity of ewe’s and goat’s frozen yoghurts produced with UF concentrated cheese whey
over 21 days of refrigerated storage (EW. 0% = ewe’s yoghurt with 0% inulin addition; EW. 2.5% = ewe’s yoghurt with
2.5% inulin addition; EW. 5.0% = ewe’s yoghurt with 0% inulin addition; GO. 0% = goat’s yoghurt with 0% inulin addition;
GO. 2.5% = goat’s yoghurt with 2.5% inulin addition; GO. 5% = goat’s yoghurt with 5% inulin addition). Different letters
indicate significant differences (p < 0.05) between frozen yoghurts during storage.Appl. Sci. 2021, 11, 6568 11 of 20
Figure 6. CIEL*a*b* color parameters of ewe’s and goat’s frozen yoghurts produced with UF concentrated cheese whey
over 21 days of refrigerated storage (EW. 0% = ewe’s yoghurt with 0% inulin addition; EW. 2.5% = ewe’s yoghurt with
2.5% inulin addition; EW. 5.0% = ewe’s yoghurt with 0% inulin addition; GO. 0% = goat’s yoghurt with 0% inulin addition;
GO. 2.5% = goat’s yoghurt with 2.5% inulin addition; GO. 5% = goat’s yoghurt with 5% inulin addition). Different letters
indicate significant differences (p < 0.05) between frozen yoghurts.
Table 4. Matrix of color differences (∆Eab*) between frozen yoghurt formulations.
Products 1 2 3 4 5
1 0.00
2 2.86 0.00
3 3.40 0.60 0.00
4 0.47 2.98 3.54 0.00
5 2.51 1.28 1.54 2.69 0.00
6 1.01 2.04 2.57 1.13 1.56
1 = Ewe’s yoghurt with 0% inulin addition; 2 = ewe’s yoghurt with 2.5% inulin addition; 3 = ewe’s yoghurt with
0% inulin addition; 4 = goat’s yoghurt with 0% inulin addition; 5 = Goat’s yoghurt with 2.5% inulin addition; 6 =
goat’s yoghurt with 5% inulin addition.
With regard to overrun (Table 5), with the exception of formulation 3 (ewe’s frozen
yoghurt with 5% inulin addition), which presented the highest value (40.29%), no signif-
icant differences were observed between ewe’s and goat’s frozen yoghurt formulations.
However, the meltdown rate (Table 5) of ewe’s frozen yoghurts presented values below 10,
while goat’s frozen yoghurts had values above that value. The higher amount of protein
in ewe’s frozen yoghurts can explain the higher water retention capacity of these formu-
lations and the lower meltdown rate. In goat’s yoghurts, it appears that the addition of
inulin improved this property. However, the formulation containing 2.5% inulin presented
a significantly lower meltdown rate than that containing 5.0% inulin, and the oppositeAppl. Sci. 2021, 11, 6568 12 of 20
would be expected. We consider that the method used is appropriate to evaluate large
differences, but its accuracy may not be enough to compare small differences, as is the case
here (ca. < 2%). Interactions between species and inulin amount added for both overrun
and meltdown rate were observed (Table 6).
Table 5. Overrun and meltdown rate of ewe’s and goat’s frozen yoghurts immediately after production (n = 3).
EW. EW. GO. GO.
EW. 0% ± ± ± GO. 0% ± ± ±
2.5% 5.0% 2.5% 5.0%
Overrun 31.04 a 1.89 31.09 a 2.04 40.29 b 2.20 29.34 a 1.45 31.13 a 1.56 29.34 a 2.23
Meltdown a c e
3.47 0.03 6.33 b 0.03 4.41 0.10 27.99 d 0.01 13.07 0.50 15.00 f 0.55
rate
EW. 0% = ewe’s yoghurt with 0% inulin addition; EW. 2.5% = ewe’s yoghurt with 2.5% inulin addition; EW. 5.0% = ewe’s yoghurt with 0%
inulin addition; GO. 0% = goat’s yoghurt with 0% inulin addition; GO. 2.5% = goat’s yoghurt with 2.5% inulin addition; GO. 5.0% = goat’s
yoghurt with 5% inulin addition. Different superscript letters (a,b, . . . ) indicate significant (p < 0.05) differences between values in rows.
Table 6. Interactions between species and inulin addition observed in color parameters (L*, a*, b*),
overrun and meltdown rate of frozen yoghurts.
L* a* b* Overrun Meltdown Rate
Species×Inulin NS NS NS ** ***
NS—not significant (p > 0.05); * p < 0.05; ** p < 0.01; *** p < 0.001.
In a previous work, we highlighted the potential of bovine LWC’s as the primary
raw material for acid dairy gels. Yoghurt-type gels and gels produced by acidification
with glucono-δ-lactone were characterized, and the ability of such concentrates to produce
yoghurts or dairy desserts was reported [37].
Regarding the physicochemical characteristics of frozen yoghurts, other research
works reported the manufacture of products with proximal compositions similar to the ones
obtained in our study. However, all the studies were about frozen yoghurts manufactured
with cow’s milk, which implies many differences in protein composition and interactions.
Pereira et al. [38] evaluated the influence of pH on the characteristics of frozen yoghurts.
The formulation consisted of 6% milk fat, 10% milk solids-not-fat, 11% sucrose, 3% corn
syrup, 0.3% emulsifiers and 0.5% stabilizers. The treatments with final pH values of 5.0
and 5.5 presented higher acceptability and acidity close to the ideal. It was also found that
the physicochemical characteristics, acidity content and sugar concentration had effects
on the acceptance of the product. Soukoulis and Tzia [39] tested different acidification
procedures and stabilizers as well as two protein-fortifying agents (skim milk powder and
whey powder) regarding their influence on the quality characteristics of frozen yoghurts.
Indirect acidification, by blending plain acidified milk with frozen yoghurt mix, was
found to favor texture, while direct acidification (fermentation of frozen yoghurt mix
with starter culture) improved viscosity but did not enhance the sensory acceptance of
frozen yoghurts. The same authors found that the addition of 0.2% xanthan gum and the
partial substitution of skim milk powder by whey powder increased overall acceptance and
creaminess. These frozen yoghurts presented values of overrun similar to those obtained
by us. Milani and Koocheki [40] tested the effects of date syrup and guar gum on physical,
rheological and sensory properties of low-fat frozen yoghurt. Guar gum softened the frozen
yoghurt, whereas date syrup increased the hardness of the product. Meltdown stability was
improved with the increase in gum and date syrup concentration. Low-fat frozen yoghurts
prepared showed good sensory properties. Skryplonek et al. [32] produced lactose-free
frozen yoghurts which presented significantly lower hardness and stickiness and higher
viscosity than control frozen yoghurt. Moreover, lactose hydrolysis promoted a smooth
and creamy consistency, whereas, in the case of conventional products, a coarse structure,
due to the presence of large ice crystals, was identified. Lactose-free frozen yoghurts with
added k carrageenan or corn starch were also tested [33]. These modifications may alsoAppl. Sci. 2021, 11, 6568 13 of 20
be used to improve the nutritional and sensory properties of frozen yoghurts made with
UF concentrated whey. Rezaei et al. reported that the addition of inulin at the 2% level
improved the overrun, viscosity and melting properties of frozen yoghurt with probiotics.
Acceptability tests revealed that frozen yogurt with 2% inulin had the most appealing
sensory characteristics. The flow behavior of all samples showed a pseudo-plastic nature. In
terms of probiotic survival, the sample with 2% inulin significantly improved the viability
of Lactobacillus acidophilus and Bifidobacterium lactis [41]. Similarly, in the present study,
the highest overall acceptability was obtained by the formulations containing 5.0% inulin
(formulations 3 and 6).
Concerning the microbial characteristics of frozen yoghurts, Figure 7 presents the
counts of lactobacilli and streptococci at the day of production of the frozen yoghurt
samples. Except for formulation 6 (goat’s frozen yoghurt with 5.0% inulin incorporation),
all products presented adequate levels (>log 6 UFC g−1 ) of LAB. However, lower counts
of streptococci in all goat’s frozen yoghurts were observed. Table 7 presents the LAB
counts of both frozen yoghurt types over the 21-day storage period. In the case of ewe’s
yoghurts without added inulin, it can be observed that adequate levels of LAB were
maintained for 2 weeks. However, at the 21st day of storage, lactobacilli were present at
low levels (ca. 5 log CFU g−1 ), while streptococci were absent. Regarding goat’s frozen
yoghurts without inulin addition, adequate levels of LAB were observed for seven days,
but streptococci were already present at low levels by the 7th day of storage. At the
14th and 21st days of storage, lactobacilli were absent while streptococci surpassed 6 log
UFC g−1 . The formulation of goat’s frozen yoghurt containing 2.5% inulin presented low
levels of streptococci (5.42 log UFC g−1 ) at the first day. Lactobacilli were absent at the
7th, 14th and 21st days of storage. Streptococci also presented low counts over frozen
storage. Curiously, the formulation containing 5.0% inulin presented inadequate levels of
LAB at the first day, while at the 7th day LAB counts surpassed 6 log CFU g−1 . At the 14th
and 21st day of storage, the pattern was similar to that observed with formulation 5 (2.5%
inulin). Generally, it can be indicated that ewe’s concentrated whey was more effective in
promoting LAB growth. Strong interactions (p < 0.001) among species, inulin amount and
storage time were observed for lactobacilli counts, while they were less significative, except
for species–storage time interaction, for streptococci counts (Table 8). Further studies must
be undertaken to confirm these results. In fact, several research works regarding frozen
yoghurts indicate high survival rates for both LAB and probiotic bacteria, especially when
microencapsulation was used.
In another work [42], a commercial yoghurt culture was used as a starter culture
while free and immobilized probiotic cells were added as adjuncts for frozen yoghurt
production. The viability of the immobilized probiotic cells was maintained at high levels
for 90 storage days at −18 ◦ C, while the viability of free probiotic cells decreased ca. 10%.
L. bulgaricus counts reduced by approximately 3 log cycles and no counts of S. thermophilus
were detected by the end of freezing storage.
Alves and coworkers [24] produced goat’s milk frozen yoghurt with 1% inulin, 0.25%
starter culture (Streptococcus thermophilus and Lactobacillus bulgaricus) and 0.25% probiotic
culture (Bifidobacterium animalis and Lactobacillus acidophilus) to verify its probiotic potential
after 7 and 120 days of storage. During storage, probiotic bacteria were reduced, but
the product showed probiotic potential due to both B. animalis and L. acidophilus, which
reached the minimum desirable numbers until the end of storage. The product received
good scores for global appearance, color, aroma and taste, while texture and aftertaste had
lower acceptance rates. Other researchers investigated four experimental groups of caprine
frozen yoghurt produced with the addition of fresh and spray-dried jambolan fruit pulp
and Bifidobacterium animalis subsp. lactis. The addition of B. animalis decreased the pH of
frozen yoghurt samples. Lower overrun values (14.2–22.6%) were observed for all samples
when compared to our data. The frozen yoghurt samples with probiotic presented high
cell counts (9 log CFU g−1 ) and a high probiotic survival rate throughout the 90 days of
frozen storage [25].Appl. Sci. 2021, 11, 6568 14 of 20
Table 7. Microbial counts (log CFU g−1 ) of ewe’s and goat’s frozen yoghurt over storage. Lb. = lacto-
bacilli; St. = streptococci (mean values and standard deviation).
Days 0% Inulin 2.5% Inulin 5.0% Inulin
Ewe’s Mean ± Mean ± Mean ±
Lb. 6.50 a 0.71 7.02 a 1.09 6.76 a 0.59
1
St. 9.11 a 0.45 9.05 a 0.33 8.82 a 0.28
Lb. 7.86 a 0.41 7.92 a 0.39 7.88 a 0.32
7
St. 9.28 a 0.94 9.07 a 0.54 8.56 a 0.28
Lb. 6.00 a 1.41 6.05 a 0.02 5.80 a 0.30
14
St. 8.22 a 0.37 8.01 a 0.49 8.09 a 0.62
Lb. 5.33 a 0.47 5.86 a 1.26 5.00 a 0.10
21
St. 0.00 a 0.00 0.00 a 0.00 0.00 a 0.00
Goat’s Mean ± Mean ± Mean ±
Lb. 7.02 a 0.66 8.14 ab 1.84 5.50 b 0.70
1
St. 7.48 a 1.53 5.42 a 0.60 b 0.61
5.44
Lb. 6.99 a 0.97 b 0.00 6.14 a 0.63
0.00
7
St. 5.65 a 0.49 6.68 a 1.23 7.85 a 1.58
Lb. 0.00 a 0.00 0.00 a 0.00 0.00 a 0.00
14
St. 6.94 a 0.11 b 0.51 b 0.37
5.43 5.74
Lb. 0.00 a 0.00 0.00 a 0.00 0.00 a 0.00
21
St. 6.15 a 1.63 5.33 a 0.58 6.92 a 0.99
Different superscript letters (a,b) indicate significant (p < 0.05) differences between values in rows.
Table 8. Interactions between species, inulin addition and storage time observed in microbial counts
of frozen yoghurts.
Lactobacilli Streptococci
Species×Inulin *** *
Inulin×Storage time *** *
Species×Storage time *** ***
Species×Inulin×Storage time *** **
* p < 0.05; ** p < 0.01; *** p < 0.001.
Goat milk and goat milk plus inulin were used as encapsulating agents of Bifidobac-
terium BB-12 and applied in frozen yoghurt to evaluate the antagonistic effect against
Escherichia coli. The production of organic acids by bifidobacteria was directly related to
the decrease in the E. coli counts. In plate counts, E. coli was not detected in the descend-
ing colon. However, when quantified by qPCR, the sample presented amplification that
corresponded to 3 log CFU g−1 . It was therefore possible to observe the phenomenon of
the viable but not-culturable cells of E. coli. The authors recommended the production of
microcapsules with goat milk and inulin for application in goat milk products, due to the
better antagonist effect against E. coli [26].Appl. Sci. 2021, 11, 6568 15 of 20
Figure 7. Lactobacilli sp. (Lb.) and Streptococci sp. (St.) counts (log CFU g−1 ) of ewe’s and goat’s frozen yoghurts produced
with UF concentrated cheese whey at the day of production (EW. 0% = ewe’s yoghurt with 0% inulin addition; EW. 2.5%
= ewe’s yoghurt with 2.5% inulin addition; EW. 5.0% = ewe’s yoghurt with 0% inulin addition; GO. 0% = goat’s yoghurt
with 0% inulin addition; GO. 2.5% = goat’s yoghurt with 2.5% inulin addition; GO. 5% = goat’s yoghurt with 5% inulin
addition). Different superscript letters indicate significant differences (p < 0.05) between products for lactobacilli (a, b, c)
and streptococci (A, B, C) counts.
The addition of jujube pulp greatly weakened the “goaty” flavor, improving the
sensory acceptance, and increased the antioxidant activities of goat milk yoghurt. No
significant differences were found regarding the viable counts, pH values and titratable
acidities of all formulations over 28 days refrigerated storage. All formulations showed the
viable counts above log 6 CFUmL−1 over the assessed storage period [43].
Regarding the physicochemical, microbiological, and sensory characteristics of frozen
yoghurts, several research works have been performed. Inoue et al. reported that viable
lactic acid bacteria decreased in number with increasing storage period [44]. In addition,
different sensory rates were obtained for assessors who were familiar with yogurt and for
assessors who were not. The product with a pH value of 5.5 was the most preferred frozen
yoghurt type in the products examined. Other researchers reported that experimental
storage conditions resulted in the survival of LAB in frozen yoghurts even after a 60- to
67-week period. The total LAB in three batches was higher log 7 CFUg−1 , but one of
them comprised exclusively streptococci [45]. Results obtained by Abdelazez et al. [46]
revealed that there was no significant difference between frozen yoghurt fermented by
Bifidobacterium spp. and yoghurt culture and that fermented by yoghurt culture only.Appl. Sci. 2021, 11, 6568 16 of 20
Isik et al. [47] produced frozen low-fat and no added sugar yoghurt using polydextrose,
aspartame and acesulfame-K mixture, and different levels of inulin and isomalt. The
addition of inulin and isomalt increased viscosity by 19 to 52% compared with that of
the control. Low-calorie frozen yogurt samples melted about 33 to 48% slower than the
reduced-fat control sample at 45 min. LAB counts between 8.12 and 8.49 log CFU g−1 were
found 3 months after production. Shehzad and coworkers [48] tested the effect of inulin
and glycerol supplementation on physicochemical properties of probiotic frozen yoghurt.
The results show that 4% and 6% inulin supplementation increased the overrun by 3%
and 5% and decreased the hardness by 7% and 11%, respectively. In our formulations,
this effect was only observed in formulation 3 (ewe’s frozen yoghurt with 5% inulin).
Yang et al. [49] developed a symbiotic oat-based frozen yogurt containing fermented oats,
probiotics, and inulin. The new product had 4.10% protein, 8.50% fat, and 2.10% fiber,
respectively. Bifidobacterium remained at log 6 CFUmL−1 up to 8 weeks. The results
indicate that consumption of oat-based frozen yogurt could decrease serum lipids levels
in rats.
The results obtained in the present study for goat’s frozen yoghurts cannot be con-
sidered satisfactory. We could not ascertain whether this behavior resulted from the
composition of goat’s whey, as opposed to ewe’s whey, or if it resulted from the charac-
teristics of this goat’s whey batch in particular. According to these results, we conclude
that further work with the aim of evaluating the survival of starter or probiotic cultures in
LWCs should be further investigated in order to evaluate possible causes for the low LAB
survival rates obtained in the present work.
Figure 8 shows the results of the sensory analysis performed to both yoghurts and
frozen yoghurts. It is clear the panel members’ preference with regard to ewe’s whey
yoghurts. The sensory attributes that affected goat’s yoghurts’ evaluation were texture and
taste. The liquid nature and the higher acidity of this yoghurt were pointed to as the main
negative factors. Regarding frozen yoghurts, it is clear that, for both types of yoghurts,
the formulations containing the highest level of inulin were preferred (formulations 3
and 6). The improvement of goat’s whey yoghurt’s sensory attributes after freezing is
evident. Consistency and appearance of frozen goat’s yoghurts received similar scores to
ewe’s yoghurts. Despite the fact that the aroma and taste of goat’s frozen yoghurts were
improved as compared to the original goat’s yoghurts, these attributes were less valued
when compared to the same attributes in frozen ewe’s yoghurts. It should be noted that no
flavoring agents were added to the formulations. The flavor of the products was directly
linked to the specific composition of the LWCs and to the addition of sucrose and honey.
Addition of fruit purees and flavoring agents could improve the sensory attributes of both
products, further increasing their acceptability.Appl. Sci. 2021, 11, 6568 17 of 20
Figure 8. Sensory scores of ewe’s and goat’s yoghurts and correspondent frozen yoghurts produced
with UF concentrated cheese whey ((A) = ewe’s and goat’s yoghurts; (B) = ewe’s frozen yoghurts,
(C) = goat’s frozen yoghurts).Appl. Sci. 2021, 11, 6568 18 of 20
4. Conclusions
Considering the results obtained so far, it can be concluded that the concentration of
ewe’s or goat’s whey by means of ultrafiltration can give rise to the production of liquid
whey concentrates that can be used in the production of novel dairy products such as
yoghurts and frozen yoghurts. In both cases, levels of more than 10% protein in the LWC’s
are recommended. In addition, considering the information already available regarding
the incorporation and survival of probiotic on such products, we consider that it will be
possible to produce novel symbiotic yoghurts based on ewe’s or goat’s whey. This will
represent an attractive way to valorize such by-products as a complement to the production
of whey cheeses, which is already common in dairies manufacturing small ruminant’s milk
cheeses. The processes of the production of yoghurts and frozen yoghurts do not require
the acquisition of expensive equipment and the technical skills can easily be transferred to
the existing personal. These will ease the introduction of such technologies in small- and
medium-scale dairies.
Author Contributions: Conceptualization, C.D.P.; methodology, C.D.P., N.G.M. and A.F.P.; valida-
tion, C.D.P., O.D. and A.C.; formal analysis, C.D.P., O.D. and A.C.; investigation N.G.M. and A.F.P.;
resources, C.D.P.; data curation, C.D.P., N.G.M.; writing—original draft preparation, N.G.M. and
C.D.P.; writing—review and editing, C.D.P., A.F.P., O.D. and A.C.; visualization, C.D.P.; supervision,
C.D.P.; project administration, C.D.P.; funding acquisition, C.D.P., O.D. and A.C. All authors have
read and agreed to the published version of the manuscript.
Funding: This work was supported by national funds through the Ministry of Agriculture and
Rural Development and co-financed by the European Agricultural Fund for Rural Development,
through the partnership agreement Portugal2020-PDR, under the project PDR2020-101-030768: LAC-
TIES. Partial funding was obtained through FCT—Foundation for Science and Technology—project
UIDB/00681/2020 and by Xunta de Galicia (grant number GPC ED431B 2019/13).
Institutional Review Board Statement: Not applicable.
Informed Consent Statement: All members of consumer sensory panels have authorized the publi-
cation of the obtained data.
Data Availability Statement: Data is available upon request addressed to the corresponding author.
Acknowledgments: We would like to express our gratitude to David Gomes, Adélia Vaz, Lurdes
Pires, Jorge Arede and Jorge Viegas for technical support at the dairy pilot plant and laboratory.
Conflicts of Interest: The authors declare no conflict of interest.
References
1. Jelen, P.; Fuquay, J.; Fox, P.; McSweeney, P. Whey Processing. Utilization and Products. In Encyclopedia of Dairy Sciences, 2nd ed.;
Fuquay, J.W., Ed.; Academic Press: London, UK, 2011; pp. 731–737.
2. Prazeres, A.R.; Carvalho, F.; Rivas, J. Cheese whey management: A review. J. Environ. Manag. 2012, 110, 48–68. [CrossRef]
3. Ryan, M.P.; Walsh, G. The biotechnological potential of whey. Rev. Environ. Sci. Bio/Technol. 2016, 15, 479–498. [CrossRef]
4. Smithers, G.W. Whey-ing up the options-yesterday, today and tomorrow. Int. Dairy J. 2015, 48, 2–14. [CrossRef]
5. Patel, S. Functional food relevance of whey protein: A review of recent findings and scopes ahead. J. Func. Foods 2015, 19, 308–319.
[CrossRef]
6. Henriques, M.; Gomes, D.; Rodrigues, D.; Pereira, C.; Gil, M. Performance of bovine and ovine liquid whey protein concentrate
on functional properties of set yoghurts. Procedia Food Sci. 2011, 1, 2007–2014. [CrossRef]
7. Vincenzi, A.; Maciel, M.J.; Burlani, E.; Oliveira, E.; Volpato, G.; Lehn, D.N.; de Souza, C.V. Ethanol bio-production from ricotta
cheese whey by several strains of the yeast Kluyveromyces. Am. J. Food Technol. 2014, 9, 281–291. [CrossRef]
8. De la Fuente, M.; Hemar, Y.; Tamehana, M.; Munro, P.; Singh, H. Process-induced changes in whey proteins during the
manufacture of whey protein concentrates. Int. Dairy J. 2002, 12, 361–369. [CrossRef]
9. Liu, Y.; Zhang, W.; Zhang, L.; Hettinga, K.; Zhou, P. Characterizing the changes of bovine milk serum proteins after simulated
industrial processing. LWT-Food Sci. Technol. 2020, 133, 110101. [CrossRef]
10. Tavares, T.G.; Amorim, M.; Gomes, D.; Pintado, M.E.; Pereira, C.D.; Malcata, F.X. Manufacture of bioactive peptide-rich
concentrates from Whey: Characterization of pilot process. J. Food Eng. 2012, 110, 547–552. [CrossRef]
11. Lappa, I.K.; Papadaki, A.; Kachrimanidou, V.; Terpou, A.; Koulougliotis, D.; Eriotou, E.; Kopsahelis, N. Cheese whey processing:
Integrated biorefinery concepts and emerging food applications. Foods 2019, 8, 347. [CrossRef]Appl. Sci. 2021, 11, 6568 19 of 20
12. Dullius, A.; Inês, M.; Fernanda, C.; De Souza, V. Whey protein hydrolysates as a source of bioactive peptides for functional
foods-Biotechnological facilitation of industrial scale-up. J. Func. Foods 2018, 42, 58–74. [CrossRef]
13. Yadav, J.S.S.; Yan, S.; Pilli, S.; Kumar, L.; Tyagi, R.D.; Surampalli, R.Y. Cheese whey: A potential resource to transform into
bioprotein, functional/nutritional proteins and bioactive peptides. Biotech. Adv. 2015, 33, 756–774. [CrossRef] [PubMed]
14. Pintado, M.E.; Macedo, A.; Malcata, F. Technology, chemistry and microbiology of whey cheeses. Food Sci. Technol. Int. 2001, 7,
105–116. [CrossRef]
15. Pires, A.F.; Marnotes, N.G.; Bella, A.; Viegas, J.; Gomes, D.M.; Henriques, M.H.; Pereira, C.J. Use of ultrafiltrated cow’s whey for
the production of whey cheese with Kefir or probiotics. J. Sci. Food Agric. 2020, 101, 555–563. [CrossRef]
16. Pereira, C.D.; Diaz, O.; Cobos, A. Valorization of by-products from ovine cheese manufacture: Clarification by thermocalcic
precipitation/microfiltration before ultrafiltration. Int. Dairy J. 2002, 12, 773–783. [CrossRef]
17. Díaz, O.; Pereira, C.D.; Cobos, A. Functional properties of ovine whey protein concentrates produced by membrane technology
after clarification of cheese manufacture by-products. Food Hydrocoll. 2004, 18, 601–610. [CrossRef]
18. Pereira, C.D.; Díaz, O.; Cobos, A. Impact of ovine whey protein concentrates and clarification by-products on the yield and
quality of whey cheese. Food Technol. Biotech. 2007, 45, 32–37.
19. Henriques, M.H.F.; Gomes, D.M.G.S.; Pereira, C.J.D.; Gil, M.H. Effects of Liquid Whey Protein Concentrate on Functional and
Sensorial Properties of Set Yoghurts and Fresh Cheese. Food Bioprocess Technol. 2012, 6, 952–963. [CrossRef]
20. Sanmartín, B.; Díaz, O.; Rodríguez-Turienzo, L.; Cobos, A. Composition of caprine whey protein concentrates produced by
membrane technology after clarification of cheese whey. Small Rumin. Res. 2012, 105, 186–192. [CrossRef]
21. Sanmartín, B.; Díaz, O.; Rodríguez-Turienzo, L.; Cobos, A. Functional properties of caprine whey protein concentrates obtained
from clarified cheese whey. Small Rumin. Res. 2013, 110, 52–56. [CrossRef]
22. Sanmartín, B.; Díaz, O.; Rodríguez-Turienzo, L.; Cobos, A. Properties of heat-induced gels of caprine whey protein concentrates
obtained from clarified cheese whey. Small Rumin. Res. 2015, 123, 142–148. [CrossRef]
23. Sanmartín, B.; Díaz, O.; Rodríguez-Turienzo, L.; Cobos, A. Emulsion characteristics of salad dressings as affected by caprine
whey protein concentrates. Int. J. Food Prop. 2018, 21, 12–20. [CrossRef]
24. Alves, L.D.L.; dos Santos Richards, N.S.P.; Becker, L.V.; Andrade, D.F.; Milania, L.I.G.; Rezer, A.P.D.S.; Scipioni, G.C. Sensorial
acceptance and characterization of goat’s milk frozen yogurt with addition of probiotic culture and prebiotic. Ciência Rural 2009,
39, 2595–2600. [CrossRef]
25. Bezerra, M.; Araújo, A.; Santos, K.; Correia, R. Caprine frozen yoghurt produced with fresh and spray dried jambolan fruit pulp
(Eugenia jambolana Lam) and Bifidobacterium animalis subsp. lactis BI-07. LWT-Food Sci. Technol. 2015, 62, 1099–1104. [CrossRef]
26. Verruck, S.; Barretta, C.; Miotto, M.; Helena, M.; Canella, M.; Rodrigues, G.; Liz, D.; Marchesan, B.; Mello, S.; Rosana, C.;
et al. Evaluation of the interaction between microencapsulated Bifidobacterium BB-12 added in goat’ s milk frozen yogurt and
Escherichia coli in the large intestine. Food Res. Int. 2020, 127, 108690127. [CrossRef]
27. NP 703. Yoghurts. Determination of dry residue and fat-free dry residue. Instituto Português da Qualidade (IPQ), Comissão
Técnica-32, 1º Edição, Portugal, 1982.
28. AOAC. Official Methods of Analysis of Association of Official Analytical Chemists, 16th ed.; Dairy Products: Gaithersburg, MD, USA,
1997; Volume II, p. 33.
29. NP 469. Milks; Determination of fat (Gerber technic); Routine method. Instituto Português da Qualidade (IPQ), Comissão
Técnica-32, 1º Edição, Portugal, 2002.
30. NP 701. Yoghurts. Determination of acidity. Instituto Português da Qualidade (IPQ), Comissão Técnica- 32, 1º Edição, Portugal,
1982.
31. Phadungath, C. Basic Measurement for Food Texture. Texture Technologies Corp—Texture Profile Analysis. 2010. Available
online: https://texturetechnologies.com/resources/texture-profile-analysis (accessed on 15 June 2021).
32. Skryplonek, K.; Gomes, D.; Viegas, J.; Pereira, C.; Henriques, M. Lactose-free frozen yoghurt: Production and characteristics. Acta
Sci. Pol. Technol. Aliment. 2017, 16, 171–179. [PubMed]
33. Skryplonek, K.; Henriques, M.; Gomes, D.; Viegas, J.; Fonseca, C.; Pereira, C.; Dmytrów, I.; Mituniewicz-Małek, A. Characteristics
of lactose-free frozen yoghurt with κ-carrageenan and corn starch as stabilizers. J. Dairy Sci. 2019, 102, 7838. [CrossRef]
34. IDF 117. Yoghurt-Enumeration of Characteristic Microorganisms-Colony-Count Technique at 37 ◦ C, 1st ed.; 2003. Available online:
https://www.iso.org/standard/31880.html (accessed on 15 June 2021).
35. Stone, H.; Sidel, J. Sensory Evaluation Practices, 3rd ed.; Food Science and Technology; Academic Press: New York, NY, USA, 2004;
pp. 247–277.
36. Habekost, M. Which color differencing equation should be used? Int. Circ. Graph. Educ. Res. 2013, 6. Available online:
https://www.internationalcircle.net/circular/issues/13_01/ICJ_06_2013_02_069.pdf (accessed on 15 June 2021).
37. Henriques, M.H.F.; Gomes, D.M.G.S.; Borges, A.R.; Pereira, C.J.D. Liquid whey protein concentrates as primary raw material for
acid dairy gels. Food Sci. Technol. 2020, 40, 361–369. [CrossRef]
38. Pereira, G.; Rafael, L.M.; Gajo, A.A.; Ramos, T.D.M.; Pinto, S.M.; Abreu, L.R.; Resende, J.V. Influence of pH on the physicochemical
and sensorial characteristics of strawberry frozen yogurt. Semin. Ciências Agric. Londrina 2012, 33, 675–686. [CrossRef]
39. Soukoulis, C.; Tzia, C. Impact of the acidification process, hydrocolloids and protein fortifiers on the physical and sensory
properties of frozen yogurt. Int. J. Dairy Technol. 2008, 61, 170–177. [CrossRef]You can also read