Simple Approximation of the Magnetic Induction Inside High Voltage Overhead Transmission Lines
←
→
Page content transcription
If your browser does not render page correctly, please read the page content below
E3S Web of Conferences 336, 00076 (2022)                                                               https://doi.org/10.1051/e3sconf/202233600076
ICEGC'2021

         Simple Approximation of the Magnetic Induction Inside High
         Voltage Overhead Transmission Lines
         Salah-Eddine Houicher 1,*, Rabah Djekidel 1, and Sid-Ahmed Bessidik 1
         1   Ammar Telidji University, Electrical Engineering Department, LACoSERE Laboratory, 03000 Laghouat, Algeria

                       Abstract. With the development of electrical power transmission networks, are resulted the increase and
                       continuous consumption of various power production sources, this is what requires the large quantities of
                       energy construction. The increased demand in electric power employment has generated an raised of
                       operating voltage for transmission lines (HV and VHV). The high voltage overhead transmission lines
                       create electric and magnetic fields, and therefore have elevated serious concern questions about their
                       possible potential effects in human body and environmental great associated with the resulting higher levels
                       of electromagnetic fields strength around these power lines. The accurate evaluation of extremely low
                       frequency electromagnetic fields influences produced by the high voltage overhead power lines on human
                       health and the environment are well very known and analysed in several research works and simulation
                       study projects. In this paper we precise examine and present a methodology for plot the lateral profile of
                       magnetic field distribution in close a three-phase overhead transmission line in single circuit flat horizontal
                       configuration at height 1m above the ground level, In order show the essentials factors affecting in the
                       magnetic fields intensity under and in the vicinity of high voltage overhead transmission line in any point of
                       space surface and ground plane, the analytique calculation results of the lateral profile of magnetic flux
                       density behaviour are obtained by program MATLAB software, which makes it possible better analyser and
                       easy represent the transverse profile of the magnetic field around electric power transmission lines, the
                       numerique simulation results are based in image method and the superposition theorem.

                       keywords: overhead power line; magnetic field; lateral profile; exposure limit; power frequency;
                       simulation; sag conductor.

       1 introduction                                                         community because of concerns existed by government
                                                                              agencies, non-governmental and energy utilities about
       The improvement of high voltage electrical power plants                their possible biological effects on health and the
       causes the problems related to electromagnetic fields                  environment, exposure to these electromagnetic fields
       produces the interactions with near objects and diverse                induces a current inside human body that interferes with
       problems [1]. High fields levels that can cause damage to              those, and can if necessarily intense, causes harmful
       the environment including substances located nearby                    biological effects with important implications for human
       these networks [2], moreover they could expose the                     health [4]. The increase in the population over the world
       populates working around them to serious diseases. Over                drive promote the energy needed which reasons the
       the years, electric power has better the conditions of                 evolution of the electric power demand and speed up
       human living, it plays a key role in responding to basic               the concentration of transmission lines with a high
       human being needs. However, despite all its advantages,                operating voltage levels. These transmission lines
       electricity has many negative effects on human health                  engender electric and magnetic fields, therefore
       and the environment. As energy needs increase with the                 advanced harmful questions about the potential health
       rapid advance of the human population, principal to                    and environmental effects related with high levels of
       adoption of electric power transmission systems with                   electromagnetic fields intensity around these circuit
       very high voltage levels and augmented the creation of                 lines. in the last years, several research publications have
       new circuit power lines using single or double circuit                 been made for the simulation and measurement of very
       lines near residential areas [3]. The electromagnetic                  low frequency electric and magnetic fields (ELF) created
       fields of extremely low frequency(ELF) generated by                    by electric power transmission lines [5], Most adopt that
       high voltage transmission lines have assumed great                     the power lines are horizontal straight parallel to the
       importance in recent years, widely study by the scientific             ground, and the sag due to the power lines weight is

         *
             Corresponding author: houichersalah@gmail.com

  © The Authors, published by EDP Sciences. This is an open access article distributed under the terms of the Creative Commons Attribution License 4.0
  (http://creativecommons.org/licenses/by/4.0/).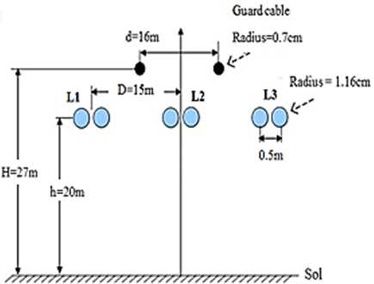
E3S Web of Conferences 336, 00076 (2022)                                                       https://doi.org/10.1051/e3sconf/202233600076
ICEGC'2021

       neglected or introduced by taking an average height               with the Matlab package because it is widely used in
       between the maximum and minimum height of the                     electrical engineering courses [12-13]. It is well known
       power lines. Based on the results and recommendations             that processes related to generation, transmission,
       reported by these research studies. A number of national          distribution, and consumption of electric power plants
       and international standards have been established, to             are associated with the generation of low-frequency
       define the exposure limits values for occupational and            electromagnetic fields (50-60Hz) and harmonic
       general public of electric and magnetic fields at very low        frequencies). The constant increase in the world’s
       frequency [6]. It is well decided by the World Health             demand for electricity requires the permanent
       Organization (WHO) that these currents excite less                construction of new circuit lines and the extension of the
       effects reversible that are more visible from the current         existing transmission and distribution power lines. Thus,
       density of 10mA/m. The limits of exposure to                      it is very important that electrical engineers obtain
       electromagnetic fields (EMF) generated by overhead                knowledge about the possible effects of electric and
       power lines are resulting from the International                  magnetic fields as well as providing them tools for
       Commission on Non -Ionizing Radiation Protection                  computing and predicting the electric field intensity and
       (ICNIRP). At low frequency 50Hz, the reference levels             magnetic flux density in the vicinity of high-voltage
       for general public exposure are 100T, and 500μT for              overhead power lines. In this work a fast method to
       occupational exposure (magnetic induction), in the other          simulate the magnetic fields created by single circuit
       hand, 5kV/m applied to the general public, and 10kV/m             three-phase power lines is presented, including the
       for professional exposure (electric field) respectively.          effects of a conducting ground and the effects of sagging
       The reference levels for occupational exposure are 1mT            conductors. The objective of the proposed system is the
       and 10kV/m [7]. These limit values are sometimes                  interpretation of a standard executable program’s output
       approached in areas close to huge transmission lines.             results, also understand the physical and electrical laws
       With the increase power demand, the electric                      involved in the computation of magnetic field at 1m
       transmission utilities are increased the function voltage         above the ground under overhead power line, in order
       levels for effective magnitude power transmission. With           show the numerous factors affecting in the magnetic
       the increase in operating voltage levels, high voltage            induction values. understanding the steps involved in the
       overhead transmission lines carry bulk amounts of power           computation of the magnetic field generated by overhead
       and in turn large currents, therefore are expected to             power lines. The methodology proposed for computing
       produce high values of magnetic fields. Consequently, in          the magnetic field has been used by the authors of this
       the design of extra high voltage overhead electric power          work, in the other hand the simulation results with
       lines, one of the important factors to be considered is the       experimental data and alternative computing methods
       magnetic field distribution at the ground level or at             reported by Garrido and al [14], resulting a close
       height 1m above ground surface. Precise calculation of            similitude between them. Note that most references that
       the magnetic flux density values under overhead power             deals with the magnetic field computation in the vicinity
       lines is important from the view point of environmental           of overhead power lines [14-16] do not take into account
       impact. It is well known that the geometrical parameters          the catenary shape of sagging conductors. These studies
       of overhead power transmission lines (OPLs) affect the            suppose that the overhead conductors are perfectly flat,
       magnetic field values and profiles under and around               thereby the geometry problem is greatly simplified. This
       them. Previous parameters effect on the magnetic field            simplification leads to a problem with a high degree of
       intensity at any point on the ground surface or in the            symmetry. Thus, under these conditions the Ampere’s
       space under and in the vicinity of overhead power circuit         law can be applied, simplifying significantly the problem
       lines, such as the height of conductors, their size and           which is the object of this study. Moreover, so far a
       phase conductors spacing together with the location of            detailed study of the magnetic field generated by sagging
       observed point where the field is to be calculated [8].           conductors with catenary shape has not been reported for
       The loading currents also affect the magnitude of                 educational purposes. This paper is organized into three
       components. Theorical formulas were given for                     sections, Section II describes the theorical formulas used
       predicting the magnetic fields of power lines given               for calculation of power line magnetic fields based in
       knowledge of the currents in power line conductors                Garson method and the superposition principle.
       beside the circuit lines configuration [9]. The analytical        Computation results of numerique simulation are offered
       results of the magnetic field calculation of a very high          and discussed in Section III. Section IV is conclusions.
       voltage single circuit line based on image method using
       MATLAB numerical software which makes it possible
       to better analyse and to represent two dimension plot 2D          2 Computation of the magnetic field
       transverse profile of the magnetic field distribution under       under high voltage overhead lines
       the high voltage overhead power line. Nowadays, many
       laboratory experiments and literature lectures in the             Although the electricity supply generally has electric and
       electrical engineering around the world are being                 magnetic fields associated with it, high-voltage power
       assisted by computer simulations [10-11]. The                     lines are a particular source of exposure to elevated
       modulation of electrical power systems has acquired               levels of these fields. The electrical and magnetic fields
       great importance in engineering education because of the          will be decoupled, that is to say, they will be
       huge increase of the computer importance based systems            independent of each other. This indicates that one cannot
       in learning methodologies. The present article contracts          be deduced from the other but rather that they have to be

                                                                     2
E3S Web of Conferences 336, 00076 (2022) https://doi.org/10.1051/e3sconf/202233600076
ICEGC'2021
calculated separately. It is also necessary to take into an infinite straight conductor placed in position (xi,yi,zi)
account that the electrical field is due to the difference in can be determined by applying Biot Savart law [17],
&
voltage between the power line and the ground and that & μ 0 I i dl ∧ r&
the magnetic field is generated by the current transported dBi = (3)
by the line. In this work study depicts a cross-sectional 4π r3
&
view of a single-circuit three phase overhead power line being r = ( x − xi )iˆ + ( y − y i ) ˆj + 0kˆ , μ0=4×10⁻⁷
(400kV, 1.4GVA) that will be used here for &
exemplification purposes. The phase conductors are N/A2, and dl = dzkˆ has the same direction as Ii.
arranged in a flat configuration, each phase comprising a Therefore, as deduced in Ref. [17] the result is
bundle of two sub conductors (L1, L2, L3). A pair of two
μ0 I i
ground wires (G1–G2) is also represented in detail. Bi = (4)
Assuming that the overhead phase bundles are replaced 2π i ri
with equivalent single conductors; assuming these
conductors carry sinusoidal currents directed along the -
axis, with complex amplitudes (phasors) denoted by I1, I2
and I3, and assuming no other currents are present, the
complex amplitude of the magnetic induction field
vector in a point 1m above ground is obtained, from
Ampère’s law, as a simple summation of three terms of
the magnetic field components in overhead power line.
2.1 Original field of the line
The process starts with the given line geometry and with
its specified loading conditions. In our case, phase
bundles are located at: Fig. 1. Vectorial magnetic field created by a single conductor.
x1= -15.0 [m] , y1 =20.0 [m] for phase 1
From both, Fig. 1 and Equation (4), it can also be
x2 = 0.0 [m] , y2 =20.0 [m] for phase 2, and
deduced that the vectorial magnetic field expression is
x3 = 15.0 [m] , y3=20.0 [m] for phase3
given by the following formula:
The Corresponding phase currents are:
I 1 = 1500 ∠ 0 ° [ A ]
& μ0Iiϕ (y − yi ) (x − xi )
I 2 = 1500 ∠ − 120 ° [A ] (1)
Bi = ( , ,0)
(5)
I 3 = 1500 ∠ 120 ° [A ] 2π (x − xi ) +(y − yi) (x − xi )2 +(y − yi )2
2 2
In the first step, the ground-level magnetic field caused Where is the phase angle of the current flowing in the
by phase currents is computed. The general approach phase conductors of electric power line. It is necessary to
follows Ampere's Law as illustrated by Fig. 1. A current take into account that Ii and Bi are sinusoidal alternating
Ii at the point (xi,yi) causes magnetic field intensity at physical variables, and it is convenient to express their
location (xj, yj) of the magnitude definite by this magnitudes in the root mean square (RMS) value.
formula:
Ii ª Aº
H ij = «¬ m »¼ (2) 2.1.2 Image methodology principle
2.π .rij The image method is helpful to take into account the
impacts of the presence of a conducting ground [18]. The
alternating magnetic field that the line generates induces
(1)ground and these, at the same time
return currents in the
2.1.1 Calculation of the magnetic field generated by
an Infinite and Isolated straight conductor generate a magnetic field that is composed to that
Mostly high-voltage power lines use a three-phase produced by the line. The image theory states that the
system in order to transport electric energy. This means field created by a current carrying conductor, when
that they consist of three conductors with alternating placed at height Derc above a perfectly conducting
sinusoidal voltages of 50Hz with equal amplitude but out ground, can be represented by the common fields of
of phase with each other at an electric angle of 1200. conductors and its image [19]. When the finitely
Therefore, this angle must be taken into account in the conducting ground is replaced with a perfectly
calculation of the magnetic field. In this section a conducting ground, standard image theory can be used to
formula to determine the magnetic field generated by an locate the conductor image depth. As depicted in Fig. 2,
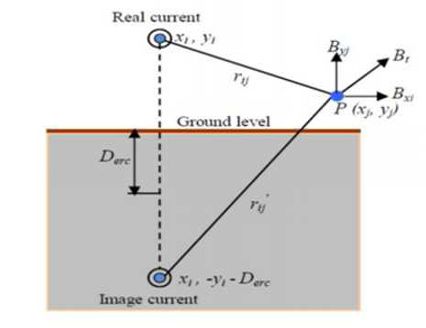
infinite and isolated straight conductor is deduced. Fig. 1 the image conductor is placed at a depth given by
shows a straight conductor along which a current Ii Derc+yi, being Derc a complex distance [20] which value
circulates, which generates a magnetic field Bi in the depends on the ground electrical conductivity as
space that surrounds it. The magnetic field generated by expressed in Equation (6).
3E3S Web of Conferences 336, 00076 (2022) https://doi.org/10.1051/e3sconf/202233600076
ICEGC'2021
ρs Where, (xi, yi) and (xj, yj) are the coordinates of the
Derc = 658.87. (6) observation point and location of simulation line
f current, respectively; rij is the distance between each
Where, s is the electrical resistivity of the earth conductor and observation point above ground, rij’ is
expressed as .m, f is the frequency of the source the distance between each image conductor and
current in Hz. In the case of a perfectly conducting observation point.
ground it results =0 and, therefore =0. However,
The magnetic field of transmission line can be
terrains of low conductivity give a very large penetration
written in adding the components of the given field for
depth and, therefore, is also very high. In the case of
each conductor:
a perfect insulator the result is α = ∞ .
Bxj = ¦ Bxj ½
N
n =1 °
N ¾ (8)
B yj = ¦ B yj °
n =1 ¿
The magnitude of the total magnetic induction at any
desired point P is calculated by the summation of the
horizontal and vertical components as a following:
Btot = Bxj + B yj
2 2
(9)
2.2 Geometric and characteristic of line study
We consider a high voltage three-phase overhead power
Fig. 2. Magnetic field engender by reel current and its image. line, Each phase of the line (L1, L2, L3) contains a
bundle of two conductors in single circuit horizontal
Practical ground resistivities fluctuate from vary from configuration parallel to the flat ground, are separated by
3,000.m for very poor conducting ground [21]. In The total section of a sub-conductor equals 590mm2.
order to calculate the resistance of ground, =100.m The diameter of a sub-ray of sub-conductor is 23.2mm,
has been used. By substituting in Equation (6) f=50Hz,
=100.m, and μ 0=4×10⁻⁷ gives a calculation result of
=711.76m. This value is approach superior to the
distance between overhead current carrying conductors
and the ground. The components of magnetic flux
density due to a conductor are given by the two
components vertical and horizontal in the equations
above. The deviation of the normal component of the
magnetic field strength from the zero value is calculated
at a set of check points (match points) chosen on the
sub-conductor’s surfaces, the values and positions of
simulation currents are known, the distribution of the
magnetic field in any region can be calculated easily.
Since the typical value for the conductivity of the earth is Fig. 3. Single circuit high voltage overhead transmission line.
in range from 0.001 to 0.1 S/m, the image currents are
located at hundreds of meters below the ground. This While the guard cable is of wire having a single bundle
image expression is valid under two conditions: if the of linear loads. the phase conductors are arranged on the
frequency is low and if the ground is nonmagnetic. same horizontal plane, that is to say the same height of
The horizontal and vertical components of the magnetic conductors above the ground. This plant type it is usually
flux density around high voltage overhead power line used for electric power high voltage transmission lines.
can be calculated by following [22-23]: The conductors are at a height of 20m, the separation
distance between phase conductors is 15m, the radius of
μ 0 ª yi − y yi + y j + Derc º ½ guard cable 0.7cm positioned horizontally at -8m and
Bx j = − .I n « − »°
j
+8m, at height 27m above the ground, the span length of
2.𠫬 rij 2 rij ' 2 »¼ °° the power line is of 300m.The geometry of three-phase
¾ (7) high voltage overhead transmission line of its
μ ª xi − x j x i − x j º ° characteristics and geometric coordinates presented in
B yj = 0 .I n « − » ° Fig.3. shows above, its parameters are listed in Table 1.
2.𠫬 rij 2 rij ' 2 »¼ °¿
Table 1. Parameters used for overhead power circuit line.
4E3S Web of Conferences 336, 00076 (2022) https://doi.org/10.1051/e3sconf/202233600076
ICEGC'2021
Parameter Value(m)
Height of
20
conductors
Spacing between
15
phase conductors
Height of the guard
27
cable above ground
Spacing between
8
guard cable
Spacing between
0.5
subconductors
Span lenght 300
3 Results and discussions
For the simulation computation, are obtained for a
balanced system in which the currents in phase
conductors are symmetric and in direct succession at a
phase angle of 1200 to one another. For the power line
situation, the magnitude of electric current circulates in Fig. 4. Lateral profile of the magnetic induction distribution in
the power line is I=1500A, the current through the guard 1m above the ground level under overhead transmission line.
cable is nul, Ig= 0. The resistivity of soil is considered as
= 100.m, and the source frequency 50Hz are used for
On observe in this curve graph, For the horizontal
the numerical calculation of the magnetic flux density.
magnetic component Bx, in the x-axis of single circuit
The circuit line is assumed to carry the same amount of
overhead power transmission line, the maximum value
current magnitude, and earth wires effects on the circuit
of lateral profile of the magnetic induction distribution is
line are neglected. The effect of transmission line current
Bmax = 10.03μT is registered in the distance located
unbalance is not considered, because it is usually low.
between the lateral and central conductor x= 18meters
The lateral profile distribution of magnetic field intensity
near under the side phase conductor accounting for only
depends on the phases arrangement. Underneath power
10.03% of the exposure limit established by ICNIRP for
lines the same phases arrangement produces the highest
the general public 100T, then it slowly reduces until to
magnetic field; the magnetic flux density can be reduced
register the minimum value Bmin = 6.06μT in the
either underneath or far from the lines by changing the
symmetry point (center distance x= 0meter) accounting
phases arrangement. The currents system in the phase
for only 6.06% of the exposure limit established by
conductors is considered symmetrical and in direct
ICNIRP for the general public 100μT, is less intense
positive succession as a following:
under the middle phase conductor from where in this
2 .π 2 .π point it increases slowly again in symmetric manner in
−j +j
I L1 = I , I L 2 = I .e 3
, I L 3 = I .e 3 the two sides positive and negative of the high voltage
overhead transmission line, until to reach the peak
maximum intensity value of the magnetic induction
In this case, from the simulation of magnetic field Bmax= 10.03μT near under the side phase conductor at
intensity, we found the following results present below: distance located between the lateral and central
Fig.4 illustrates the curve of the lateral profile conductor x= 18meters, near under the side phase
distribution of horizontal, vertical and total components conductor accounting for only 10.03% of the exposure
(Bx, By, Bt) of the magnetic field at height 1m above the limit established by ICNIRP for the general public
ground level in the vicinity of three-phase high voltage 100T, then it slowly reduces until to register the
overhead power line, as a function of the lateral distance minimum value Bmin = 6.06μT in the symmetry point
of circuit line, according on the numerique simulation, it (center distance x= 0meter) accounting for only 6.06%
is very clear the magnetic field strength increases in of the exposure limit established by ICNIRP for the
symmetrically and continuous manner in the two sides general public 100μT, is less intense under the middle
positive and negative of the high voltage overhead phase conductor from where in this point it increases
transmission line in single circuit flat horizontal slowly again in symmetric manner in the two sides
configuration, then decreases rapidly for significative positive and negative of the high voltage overhead
increases of the lateral distance of overhead power line. transmission line, until to reach the peak intensity value
of the magnetic induction Bmax= 10.03μT near under
the side phase conductor at distance located between the
lateral and central conductor x= 18meters, then decreases
rapidly with significative increase of the lateral distance
5E3S Web of Conferences 336, 00076 (2022) https://doi.org/10.1051/e3sconf/202233600076
ICEGC'2021
of single circuit line, to recorder the lower values when line. On the other hand, It can also observed that the
one moves away from the conductors, to reach at a maximum value of magnetic field intensity under
lateral distance of 75meters far from the center line a overhead power lines generally for frequency 50Hz is
very low value is about 0.67μT almost negligible below and not exceed the exposure limits values
accounting for only 0.67% of the exposure limit prescribed by the guidelines and internationals standards
established by ICNIRP for the general public 100μT such as IRPA recommendations (International
approximately accounting ten times less than the Association for Protection against Radiation), and
maximum value that found under the line. For the CENELEC (European Committee for Standardization in
vertical magnetic component By, in the y-axis of single Electrotechnique), are respectively 100μT, and 500μT.
circuit transmission line, we find that unlike the electric
field, the maximum value of lateral profile of the
magnetic induction distribution Bmax =13.29μT which
occurs at the center distance of power line (the symmetry
point x= 0meter), in the middle of the right-of-way
transmission line(the center of phases), accounting for
only 13.29% of the exposure limit established by
ICNIRP for the general public 100T, which is takes the
values max than that register at the same level as a
comparing in the horizontal magnetic component (x-
axis), then from this point the field it is strongly
attenuated laterally rapidly in a continuous and
symmetrically manner in two sides positive and negative
of the single circuit line to reach a low value about
1.30μT accounting for only 1.30% of the exposure limit
established by ICNIRP for the general public 100μT at a
lateral distance of 26meters, elsewhere which the
magnetic induction increases slightly again to register
the minimum value about 2.39μT at a lateral distance
about 39meters, after from this point the magnetic field
begins also decreases rapidly in symmetric manner as a Fig. 5. The magnetic field intensity as a function of various
the lateral distance increases, to recorder the lowest values of loading current flowing in the phase conductors.
values if when one moves away from the conductors, to
reach at a lateral distance of 75meters far from the center
power line a minimum value approximately about Fig. 5 shows the liaison between the magnetic field
1.19μT almost negligible accounting for only 1.19% of intensity and electric current flowing through the phase
the exposure limit established by ICNIRP. for the conductors, plots the lateral profile of the magnetic
general public 100μT, about ten times lower than the induction distribution at height 1m above the ground as a
maximum value found under the line. On the other hand, function of different loading currents of phase
On observe in this curve for the total magnetic conductors I= 500, 1000, 1500, and 2000A. It is clear the
component Bt, the maximum value of lateral profile of maximum magnetic flux density values corresponding to
the magnetic induction distribution Bmax = 12.12μT is this currents amplitude are 3.94, 7.88, 11.82 and
registered in the side phases conductor at a lateral 15.76μT respectively. It is very clear that as this curve is
distance located between the lateral and central symmetric in the two sides positive and negative of
conductor about x= 9meters, accounting for only 12.12% single circuit line, it observe the currents magnitude
of the exposure limit established by ICNIRP for the increase, the magnetic field intensity increases until to
general public 100T, then reduces little in the center reach the maximum values for all this four current values
point of power line (x= 0meter) under the middle phase in the center distance under the middle phase conductors,
conductor, which is register a minimum value Bmin = then decreases rapidly with significative increase of the
11.82μT, after from this point the field is increased lateral distance, to recorder the minimum values when
laterally again in symmetrically and continuous manner one moves away from the conductors, a very far for the
in two sides positive and negative of single circuit line center power line. On note the maximum magnetic flux
until to reach a peak value of magnetic induction Bmax density is found to be about 15.76μT corresponding to
= 12.12μT under the side phase conductor, at a distance maximum current I=2000A. On the other hand, show the
located between the lateral and central conductor about minimum magnetic flux density is found to be about
x= 9meters, then later reduces rapidly in symmetric way 3.94μT corresponding to minimum current I=500A
when one moves away from the conductors, to recorder flowing the conductors in all corridor right of way of the
at a distance of 75meters, very far from the center line a transmission line. The results obtained allow us saw
minimum value is approximately 1.36μT, about ten significant linear relationship between the magnetic
times lower than the maximum value found under the induction and current. More the current is higher, the
line. From previously mentioned above, On notice the magnetic field is intense. The magnetic field generated
calculated magnetic field strength which is within the by overhead transmission line varies independently of
acceptable range of the right of way (ROW) transmission
6E3S Web of Conferences 336, 00076 (2022) https://doi.org/10.1051/e3sconf/202233600076
ICEGC'2021
the operating phase voltage, it is strong proportional to
the loading current intensity that passes through them.
Fig. 7. The lateral profile variation of magnetic induction
Fig. 6. The lateral profile variation of magnetic induction for distribution for various phases spacing between conductors.
various heights of phase conductors above the ground level.
Fig.7 plot the lateral profile variation of magnetic
Fig.6 plot the lateral profile variation of magnetic induction at 1m above the ground level as a function of
induction at 1m above the ground as a function of various separation distances between the phase
various conductors heights H =10, 12, 15, 18 and 20m. It conductors D =8, 10, 12, and 15m. It is very clear the
is very clear the maximum magnetic flux density values maximum magnetic flux density values corresponding to
corresponding to these phase conductors heights are these separation distances between phase conductors are
30.75, 24.17, 14.55, 13.04 and 11.82μT respectively. As 9.47, 10.73, 11.48 and 11.82μT respectively. As a shown
a shown in this curve, it is observed that as the heights of in this curve, it is observed that as the separation
conductors increase, the magnetic field intensity distances between phase conductors increase, the
decreases in symmetric manner in the two sides positive magnetic field intensity increases in continuous and
and negative of circuit line with a significative increase symmetric manner in the two sides positive and negative
of the lateral distance, to reach the maximum values in of single circuit line, to reach the maximum values in the
the center distance under the middle phase conductors, center distance under the middle phase conductors, then
then decreases rapidly to register the minimum values decreases rapidly with a significative increase of the
when one moves away from the conductors, a very far lateral distance, to register the minimum values when
for the center power line in all this five phase conductors one moves away from the conductors, a very far for the
heights. It sees an opposite relationship between the center power line in all this four phase spacing between
magnetic induction and the height of conductors. conductors. Accordinate to this graph, on observe the
Accordinate to this graph, on observe the maximum maximum magnetic flux density is found to be about
magnetic flux density is found to be about 30.75μT 11.82μT corresponding to maximum separation distance
corresponding to minimum height of conductors H=10m. between phase conductors D=15m. On the other hand,
On the other hand, the minimum magnetic flux density is the minimum magnetic flux density is found to be about
found to be about 11.82μT corresponding to maximum 9.47μT corresponding to minimum separation distance
height of conductors H=20m in all corridor right of way between phase conductors D=8m. This variation is
of the high voltage overhead transmission line. significative linearity relationship between them in all
Increasing the line height is most effective parameter in corridor right of way of the high voltage overhead
the line design, which reduces the maximum field transmission line, for all types of circuit lines
strength for all circuit lines configurations and phases configurations and phase conductors arrangement. So,
arrangement. The changement of conductors height in the changement of separation distances between phase
the power line have great impact in the field intensity conductors have a great impact in the line design for
variation by increase or minimize the field stress under increases or reduces the field strength, elsewhere the
high voltage overhead power line, Therefore optimization of field intensity and modification case
optimization or modification of the power line geometry geometry under high voltage overhead power lines in
in all configurations and phase conductors arrangement. each phases arrangement and circuit lines configuration,
which is solution method for obtained the magnetic field
minimization for overhead power transmission line.
7E3S Web of Conferences 336, 00076 (2022) https://doi.org/10.1051/e3sconf/202233600076
ICEGC'2021
overhead power line for all types of circuit lines
configurations and phase conductors arrangement.
Fig.9 illustrates the lateral profile of magnetic induction
distribution in four different phases configuration of high
voltage overhead power transmission line: horizontal,
vertical, triangular, and inverted triangular circuit line at
height 1m from the ground level. On observe in this
curve the magnetic field intensity increases in
symmetrically and continuous manner in the two sides
positive and negative of single circuit line, to reach the
maximum values in the center distance under the middle
phase conductors for all this four single circuit line
configurations, then decreases rapidly for significative
increase of the lateral distance of overhead power line, to
reach the lower values a very far from the center line.
Fig. 8. The lateral profile variation of magnetic induction
distribution for various observation point heights above earth.
Fig.8 plot the lateral profile variation of magnetic
induction at 1m above the ground as a function of
various observation point heights above the ground
(calculation point of the magnetic field ) z =0, 1, 1.5, 2
and 3m. It is very clear the maximum magnetic flux
density values corresponding to these observation point
heights are 11.23, 11.82, 12.13, 12.43 and 13.04μT
respectively. As a shown in this curve it is clear that as
the heights of observation point above the earth increase,
the magnetic field intensity increases in continuous and
symmetric manner in the two sides positive and negative
of single circuit line, to reach the maximum values in the
center distance under the middle phase conductors, then
decreases rapidly with a significative increase of the Fig. 9. Lateral profile of magnetic induction for different
lateral distance, to register the minimum values when configurations of single circuit overhead transmission lines.
one moves away from the conductors, a very far for the
center power line in all this five heights of observation By comparing the values obtained, it can be observed
point above the ground level. Accordinate to this graph, that the magnetic induction is higher for the horizontal
on observe the maximum magnetic flux density is found configuration at all points on the domain right of way
to be about 13.04μT corresponding to maximum transmission line. On the other hand, the calculated
observation point height z=3m. On the other hand, the magnetic induction is lower for the inverted triangular
minimum magnetic flux density is found to be about configuration single circuit line in comparison with the
11.23μT corresponding to minimum observation point magnetic induction values with other configurations
height z=0m (ground level). Remarque from the (vertical, triangular), the last register the value 6.77T
foregoing, it we notice that this variation in the lateral for vertical configuration, in the addition the value
profile of magnetic field generated by three-phase circuit 8.85T for triangular configuration, respectively. As a
line is significative linearity relationship between them shown in this curve, It is very clear that the horizontal
in all corridor right of way of the high voltage overhead flat configuration generates the greatest value of
transmission line. Note according to the simulation magnetic induction with a maximum value of 11.82T,
results obtained that the magnetic induction values under although the inverted triangular configuration produces
and in the vicinity of high-voltage three-phase overhead the lower values of magnetic induction with a maximum
power line, depending on the distance to several levels value of 3.48T in the center configuration for the same
starting with the beginning level 0m at the ground plane, current magnitude of 1500A. Elsewhere, from previously
therefore, on show clearly a two-dimensional 2D plot of mentioned above, on notice this deviation in the lateral
the lateral profile of magnetic field distribution for this profile of magnetic field distribution at 1m above the
following levels as a function of the lateral distance of ground is due to difference in the height of phase
conductors in each single circuit configuration. While
8E3S Web of Conferences 336, 00076 (2022) https://doi.org/10.1051/e3sconf/202233600076
ICEGC'2021
the reverse triangular configuration should be the best Appendix
solution when changing in the modification case of the
basic geometry of circuit line for obtained the reduced Table 2. Lists of different abbreviations.
values of the field intensity under the power line. So, the
changement of phases arrangement have a great impact Abbreviation Name
in the power line construction for increases or reduces
the field strength, obtained the suitable phase conductors μT Micro tesla
arrangement, Therefore, achieved the optimization and
minimization of the field intensity under and in the kV Kilo volt
vicinity of high voltage overhead transmission lines.
A Ampere
4 Conclusions International Commission on
ICNIRP Non-Ionizing Radiation
In this article we used the image method for calculation Protection
the lateral profile distribution of magnetic field intensity
Hz Hertez
generated by the high voltage three-phase overhead
power line arranged in single circuit horizontal
m Meter
configuration at height 1m above the ground level.
Depending on the simulation results, we see the
magnetic induction values are maximum in the middle
point of the power line at a center distance of phase
conductors, then decrease quite rapidly in symmetrically
manner for significative increase of the lateral distance, References
to reach the lower values when one moves away from
the conductors at a center distance far from power line. 1. A. Cigre, Electrical and magnetic fields generated
There are many factors that affect in the magnetic by transmission networks, example of calculation of
induction values produced under and in the vicinity of electromagnetic disturbances by the CIGRE method,
the high voltage overhead transmission line, it mainly International Conference of Large High-voltage
depends on the geometry of circuit line, that is to say the Electrical Networks, Paris Edition Dunod, 21-43
arrangement of phases conductors, the current magnitude (1983)
carry through the conductors, the height of phase 2. G. Kulkarni, W.Z. Gandhare, Proximity effects of
conductors above the ground, the separation distance high voltage transmission lines on humans, ACEEE
between phase conductors, and the observation point Int. J. on Electrical and Power Engineering 3, 1, 28-
height above earth where the magnetic field is 32 (2012)
calculated. Based in the simulation results it is very clear
the magnetic flux density is higher for horizontal 3. R. Radwan, M. Abdel-Salam, A.B. Mahdy, M.
configuration than the other configurations triangular Samy, Laboratory Validation of Calculations of
and vertical single circuit line, but the magnetic flux Magnetic Field Mitigation Underneath
density for reverse triangular configuration is lesser Transmission Lines Using Passive and Active
compared to the other conductors configurations. The Shield Wires, Innovative Systems Design and
calculation maximum magnetic induction values Engineering 2, 4, 218–232 (2011)
underneath high voltage overhead power lines with the 4. J. C. Bravo-Rodríguez, J .C. del-Pino-López, and
same current amplitude of 1500A is minimum and does P.A. Cruz-Romero, Survey on Optimization
not exceed the value 20μT,which is five times lower of Techniques Applied to Magnetic Field Mitigation in
the exposure limit value established by international Power System, Escuela Politécnica Superior,
standard ICNIRP for the general public 100μT. in the Universidad de Sevilla. Energies 12, 7 p. 1332,
future research we find simple and fast methods for https://doi:10.3390/en12071332 (2019)
accurate fastly the magnetic field of high voltage 5. Jamal M. Ehtaiba, Sayeh M. Elhabashi, Magnetic
overhead power line for any complex geometry circuit Field Around the New 400kV OH Power
power line, therefore minimize, and negliged the errors Transmission Lines In Libya, Proceedings of the
caused in the temporal period or the tools in test review. Wseas International Conference on environment,
This system enables the simulation of the magnetic field medicine and health sciences, January 2010
created by the majority of overhead lines and presents a
6. W. Tourab, A. Babouri, Measurement and modeling
series of advantages such as the ease of being able to
of personal exposure to the electric and magnetic
study different types of lines, as well as the possibility of
fields in the vicinity of high voltage power lines,
predicting the magnetic field that projected lines will
Safety and Health at Work 7, 10, 102–110, (2016)
generate. The simulation code analysing and
understanding thoroughly the steps involved in the 7. R. Amiri, H. Hadi, M. Marich, The influence of sag
computation of magnetic field. Results from simulations in the electric field calculation around high voltage
through applying the method explained in this work have overhead transmission lines, In:2006 IEEE
been precisely for observe the magnetic field profile.
9E3S Web of Conferences 336, 00076 (2022) https://doi.org/10.1051/e3sconf/202233600076
ICEGC'2021
Conference on Electrical Insulation and Dielectric 22. D. Yao, B. Li, J. Deng, D. Huang, X. Wu, Power
Phenomena. IEEE, 206-209, (2006) frequency magnetic field of heavy current transmit
8. R. Deltuva, R. Lovri , Distribution of magnetic electricity lines based on simulation current method,
In Proceedings 2008 World Automation Congress.
field in 400kV double-circuit transmission lines,
Applied Sciences 10, 9, p. 3266 IEEE, 1-4 (2008)
9. S. Vujevi , D. Lovri , P. Saraj ev, Comparison of 23. J.R Riba Ruiz, A. Garcia Espinosa, Magnetic field
2D algorithms for the computation of power line generated by sagging conductors of overhead power
electric and magnetic fields, European Transactions lines, Computer Applications in Engineering
on Electrical Power 21, 1, 505-521 (2011) Education 19, 4, 787-794 (2009)
10. K Erenturk, MATLAB-based GUIs for fuzzy logic
controller design and applications to PMDC motor
and AVR control, Computer Applications in
Engineering Education 13, 1, 10-25 (2005)
11. J. R. Riba Ruiz, A. Garcia Espinosa, J. A. Ortega,
Validation of the parametric model of a DC
contactor using Matlab-Simulink, Computer
Applications in Engineering Education, Published
online in Wiley Inter Science, DOI:
10.1002/cae.20315 19, 2, 337-346 (2011)
12. C. Hamilton, Using MATLAB to advance the
robotics laboratory, Computer Applications in
Engineering Education 15, 3, 205-213 (2007)
13. M. C. M. Teixeira, E. Assunção, M. R. Covacic,
Proportional controllers: Direct method for stability
analysis and MATLAB implementation, IEEE
Transactions on Education 50, 1, 74-78 (2007)
14. C. Garrido, A. F. Otero, J. Cidras, Low-frequency
magnetic fields from electrical appliances and
power lines, IEEE Transactions on Power Delivery
18, 4, 1310-1319 (2003)
15. R. G. Olsen, T. A. Pankaskie, On the exact, carson
and image theories for wires at or above the earth’s
interface, IEEE Transactions on Power Apparatus
and Systems PAS-102, 4, 769-778 (1983)
16. H. M. Ismail, Characteristics of the magnetic field
under hybrid ac/dc high voltage transmission lines,
electric power systems Research 79, 1, 1-7 (2009)
17. P. A. Tipler, Physics for Scientifics and Engineers,
4th edition.W.H. Freeman and Company, Worth
Publishers, New York, 892-893 (1990)
18. P. R. Bannister, Image theory results for the mutual
impedance of crossing earth return circuits, IEEE
Transactions on Electromagnetic Compatibility 4,
158-160 (1973)
19. K. Budnik, W. Machczy ski, Contribution to
studies on calculation of the magnetic field under
power lines, European Transactions on Electrical
Power 16, 4, 345-364 (2006)
20. M. Darveniza, A practical extension of Rusck's
formula for maximum lightning-induced voltages
that accounts for ground resistivity, IEEE
Transactions on Power Delivery 22, 1, 605-612
(2006)
21. E. Resistivity, ANSI/IEEE Std 81, An American
National Standard IEEE Guide for Measuring Earth
Resistivity, Ground Impedance, and Earth Surface
Potentials of a Ground System (1983)
10You can also read