Simultaneous emission and attenuation reconstruction in time-of-flight PET using a reference object - EJNMMI Physics
←
→
Page content transcription
If your browser does not render page correctly, please read the page content below
García-Pérez and España EJNMMI Physics
https://doi.org/10.1186/s40658-020-0272-9
                                                      (2020) 7:3
                                                                                                                                        EJNMMI Physics

 ORIGINAL RESEARCH                                                                                                                                Open Access

Simultaneous emission and attenuation
reconstruction in time-of-flight PET using a
reference object
Pablo García-Pérez1 and Samuel España1,2*

* Correspondence: sespana@ucm.es
1
 Departamento de Estructura de la           Abstract
Materia, Física Térmica y Electrónica,
Facultad de Ciencias Físicas,               Background: Simultaneous reconstruction of emission and attenuation images in
Universidad Complutense de                  time-of-flight (TOF) positron emission tomography (PET) does not provide a unique
Madrid, IdISSC, Ciudad Universitaria,       solution. In this study, we propose to solve this limitation by including additional
28040 Madrid, Spain
2
 Centro Nacional de Investigaciones         information given by a reference object with known attenuation placed outside the
Cardiovasculares (CNIC), Madrid,            patient. Different configurations of the reference object were studied including
Spain                                       geometry, material composition, and activity, and an optimal configuration was
                                            defined. In addition, this configuration was tested for different timing resolutions and
                                            noise levels.
                                            Results: The proposed strategy was tested in 2D simulations obtained by forward
                                            projection of available PET/CT data and noise was included using Monte Carlo
                                            techniques. Obtained results suggest that the optimal configuration corresponds to a
                                            water cylinder inserted in the patient table and filled with activity. In that case, mean
                                            differences between reconstructed and true images were below 10%. However,
                                            better results can be obtained by increasing the activity of the reference object.
                                            Conclusion: This study shows promising results that might allow to obtain an
                                            accurate attenuation map from pure TOF-PET data without prior knowledge
                                            obtained from CT, MRI, or transmission scans.
                                            Keywords: Positron emission tomography, Attenuation correction, Joint
                                            reconstruction, Time of flight

                                          Background
                                          In order to obtain quantitative images in positron emission tomography (PET), correc-
                                          tions such as attenuation, scatter, and randoms must be implemented. Attenuation in-
                                          formation in early PET scanners was obtained using transmission sources, while
                                          attenuation maps are currently derived from computed tomography (CT) images on
                                          hybrid PET/CT scanners.
                                            In combined PET/MRI (magnetic resonance imaging) scanners, MRI provides ana-
                                          tomic images with better soft tissue contrast than CT and no ionization radiation is
                                          used, reducing the dose delivered to the patient. In addition, other applications such as
                                          spectroscopy or molecular imaging are also possible with MRI [1, 2]. Furthermore, de-
                                          velopment of stand-alone PET scanners dedicated to specific anatomical regions like
                                          the brain [3, 4] or breast [5] has been pursued in the last decade motivated by the need
                                         © The Author(s). 2020 Open Access This article is distributed under the terms of the Creative Commons Attribution 4.0 International
                                         License (http://creativecommons.org/licenses/by/4.0/), which permits unrestricted use, distribution, and reproduction in any medium,
                                         provided you give appropriate credit to the original author(s) and the source, provide a link to the Creative Commons license, and
                                         indicate if changes were made.
García-Pérez and España EJNMMI Physics         (2020) 7:3                                                               Page 2 of 12

                 of improved scanner performance. However, hybrid PET/MRI and stand-alone PET
                 scanners lack accurate methods for attenuation correction. Therefore, simplified at-
                 tenuation maps are derived from MR images [6–8] or when no transmission data is
                 available [9–11]. A promising approach suggested the joint reconstruction of emission
                 and attenuation images from time of flight (TOF)-PET data using algorithms like max-
                 imum likelihood estimation of attenuation and activity (MLAA) [12–15]. However, as
                 pointed by Defrise et al. [16], a major drawback of this approach is that the attenuation
                 sinogram can be only determined up to an additive constant. This limiting factor is
                 considered to be the main reason why these methods are still not implemented in clin-
                 ical practice [17].
                    Several methods have been proposed to overcome this limitation. Some of these
                 methods rely on available CT data [17–20] which might not be available in most cases
                 where the use of simultaneous reconstruction of emission and attenuation is valuable
                 like PET/MRI and stand-alone PET scanners. Other methods propose searching for an
                 optimal initialization of the attenuation map based on MR images [14, 20, 21], which
                 are prone to segmentation and misclassification errors, are limited by data availability,
                 and rely on patient databases. Other authors attempted to accomplish this task by add-
                 ing transmission sources in the scanner [22, 23], using the lutetium background radi-
                 ation source as the transmission source [24], or trying to use scattered events from
                 emission data [25, 26].
                    In this work, we evaluated a strategy suggested by Defrise et al. [16] that uses a refer-
                 ence object external to the patient with known attenuation values to overcome the limi-
                 tation of the additive constant. For that purpose, a modified MLAA reconstruction
                 algorithm was proposed and different configurations of the reference object were
                 evaluated.

                 Materials and methods
                 Reconstruction algorithm
                 MLAA algorithm is based on two iterative procedures. For the reconstruction of the ac-
                 tivity distribution, a maximum likelihood expectation maximization (MLEM) procedure
                 is used with the TOF-PET sinogram and the attenuation map as input. On the other
                 hand, the reconstruction of the attenuation map is performed using a maximum likeli-
                 hood gradient ascent procedure with the TOF-PET sinogram and the activity distribu-
                 tion as input. As both activity and attenuation images are unknown, these procedures
                 are concatenated every iteration or few iterations leading to the mentioned simultan-
                 eous reconstruction of both images.
                    The MLEM algorithm used in this work can be expressed as:
                                         P            y
                                                 TOF i;TOF
                                          i;TOF cij     ðnÞ
                      ðnþ1Þ       ðn Þ                bi;TOF
                     λj       ¼ λj ∙     P                                                                     ð1Þ
                                                    TOF ðnÞ
                                            i;TOF cij  ai
                          ðnÞ
                 where λ j      is the estimated activity at iteration n on image voxel j, yi,   TOF   is the mea-
                 sured number of coincidences in sinogram entry (i,TOF),           cTOF
                                                                                    ij    is the system matrix
                                                                                                             ðnÞ
                 which reflects the sensitivity of pixel j with respect to sinogram entry (i,TOF), ai              is
                                                                  ðnÞ
                 the estimated attenuation sinogram, and         bi;TOF   is the estimated emission sinogram.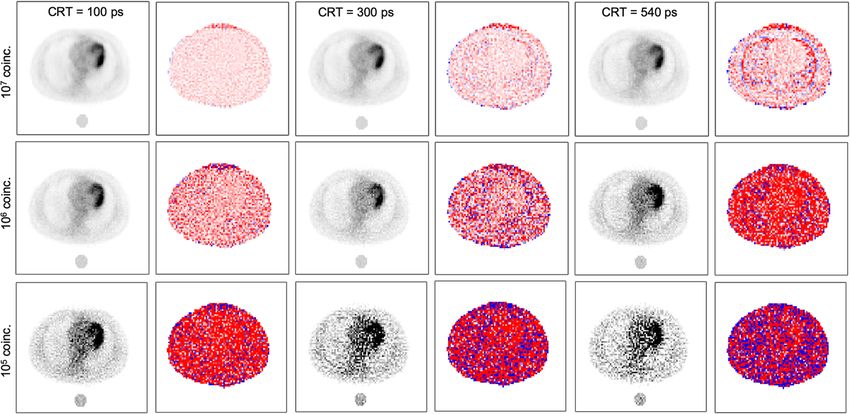
García-Pérez and España EJNMMI Physics              (2020) 7:3                                                Page 3 of 12

                 cTOF
                  ij  was estimated using a Siddon’s ray tracing algorithm [27] and the TOF resolution
                 model was included with a Gaussian profile according to the employed coincidence re-
                                                  ðnÞ               ðnÞ
                 solving time (CRT). bi;TOF and ai                  can be expressed as:
                                   X                                  X
                      ðnÞ                        ðn Þ    ðn Þ                       ðnÞ
                     bi;TOF ¼              cTOF λ j
                                          j ij
                                                        ai      ¼ exp −    j
                                                                             l ij μ j                  ð2Þ

                             ðnÞ
                 where μ j is the estimated attenuation coefficient and lij is the intersection length of
                 the line of response (LOR) for sinogram entry i with pixel j.
                   The maximum likelihood gradient ascent algorithm used for the reconstruction of
                 the attenuation map can be expressed using the following equation:
                                        0                    1
                                                P
                       ðnþ1Þ    ðnÞ  αp @           c ij y
                     μj      ¼ μj þ       1− P  i i A                                               ð3Þ
                                     D               ðnÞ ðnÞ
                                               cij a b          i         i   i

                 where αp is a relaxation coefficient and D the diameter of the PET ring [12, 14]. Note
                 that no TOF information is used in this case. The results shown in this study were ob-
                 tained after 1000 iterations updating the attenuation map according to Eq. 3 every 3
                 MLEM iterations (see Eq. 1) and with αp = 2 and D = 903 mm.
                   As pointed out by Defrise et al. [16], the MLAA algorithm allows to calculate the at-
                 tenuation sinogram up to an additive constant. They also mentioned that if the attenu-
                 ation coefficient is known for some LORs, the emission data determine in a unique way
                 all the attenuation factors. For that purpose, they proposed using a reference object
                 with known attenuation and activity placed outside the convex hull of the scanned ob-
                 ject to recover the attenuation factors for all LORs. This is possible because the attenu-
                 ation is thus known for any LOR that crosses this reference object but does not cross
                 the scanned object. However, to the best of our knowledge, this strategy has not been
                 tested to date.
                   In order to implement this technique, the MLAA algorithm was modified as follows.
                 Every time the attenuation map is updated by (3), an additive constant is added to the
                 entire map forcing the pixels within the reference object to have an average attenuation
                 coefficient according to its known value (μref ). For that purpose, the difference between
                 μref and the mean attenuation coefficient within a region of interest (ROI) drawn inside
                                                                                            ðnÞ
                 the reference object in the attenuation image at current iteration ( μROI ) is obtained,
                 and the entire attenuation map is corrected by this difference as follows:
                      ðn Þ         ðn Þ
                     μ j;corr ¼ μ j þ K ðcorr
                                          nÞ
                                                                                                       ð4Þ

                 where K ðnÞ
                         corr is given by

                                            ðnÞ
                     K ðcorr
                         nÞ
                             ¼ μref −μROI                                                              ð5Þ

                                      ðnÞ
                   In this way, μ j;corr is used as the attenuation map for the next iteration.

                 2D simulation
                 To test the proposed algorithm, multiple 2D simulations were performed. As input, re-
                 constructed PET/CT images for a patient were extracted from an online database [28,
                 29] and one slice from the thoracic region was selected (see Fig. 1). The PET image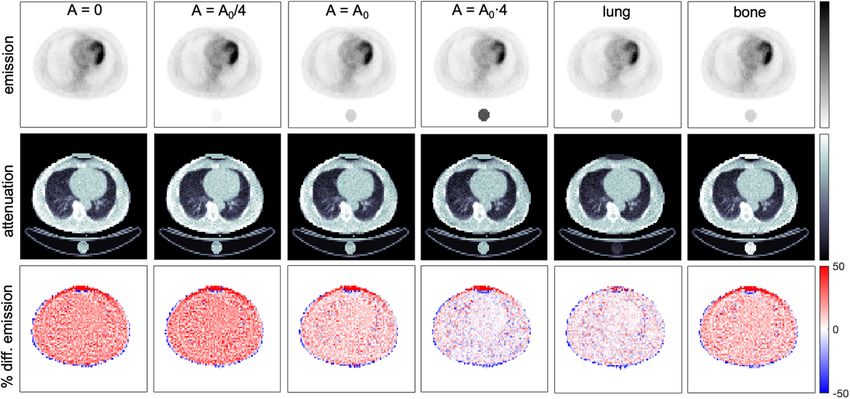
García-Pérez and España EJNMMI Physics      (2020) 7:3                                                                      Page 4 of 12

                  Fig. 1 Reconstructed emission and attenuation images and percentage difference maps of emission images
                  obtained with standard MLAA reconstruction (no reference object) and with proposed MLAA reconstruction
                  including a bias correction based on known attenuation of a reference object. True emission and
                  attenuation images are also shown as a reference

                 used as true activity distribution has 128 × 128 pixels with a pixel size of 5 mm. CT
                 image was resampled to the same voxel size as the PET image in order to obtain true
                 attenuation images. Attenuation map was obtained by conversion from Hounsfield
                 units (HU) to attenuation coefficients at 511 keV using the bilinear conversion pro-
                 posed by Carney et al. [30] for the corresponding energy (130 kVp). True emission and
                 attenuation sinograms were generated by forward projection of the true activity and at-
                 tenuation images (see Eq. 2). Attenuated emission sinogram was generated as the prod-
                 uct of both sinograms as follows:
                     yi;TOF ¼ bi;TOF  ai                                                                             ð6Þ

                    The sinograms obtained had 90 angular samples over 180°, 256 radial samples with
                 2.5 mm bin size and 13, 27, or 81 TOF-bins for 540, 300, or 100 ps CRT, respectively.
                    Attenuated emission sinograms including noise were generated using an acceptance-
                 rejection Monte Carlo (MC) method. For that purpose, a random sinogram entry (i,
                 TOF) is chosen and a random number is generated between 0 and the maximum value
                 of the noise-free sinogram. The event is added to the new sinogram if the random value
                 is lower than the noise-free sinogram at entry (i,TOF). This process is repeated until
                 the desired number of events is reached. In that way, a new sinogram is built with a
                 predefined number of events distributed as the noise-free sinogram. The number of co-
                 incidences to be simulated was established by obtaining attenuated sinograms of a cy-
                 linder with 20-cm diameter filled with water and uniform activity with different
                 number of coincidences. Those sinograms were reconstructed using standard MLEM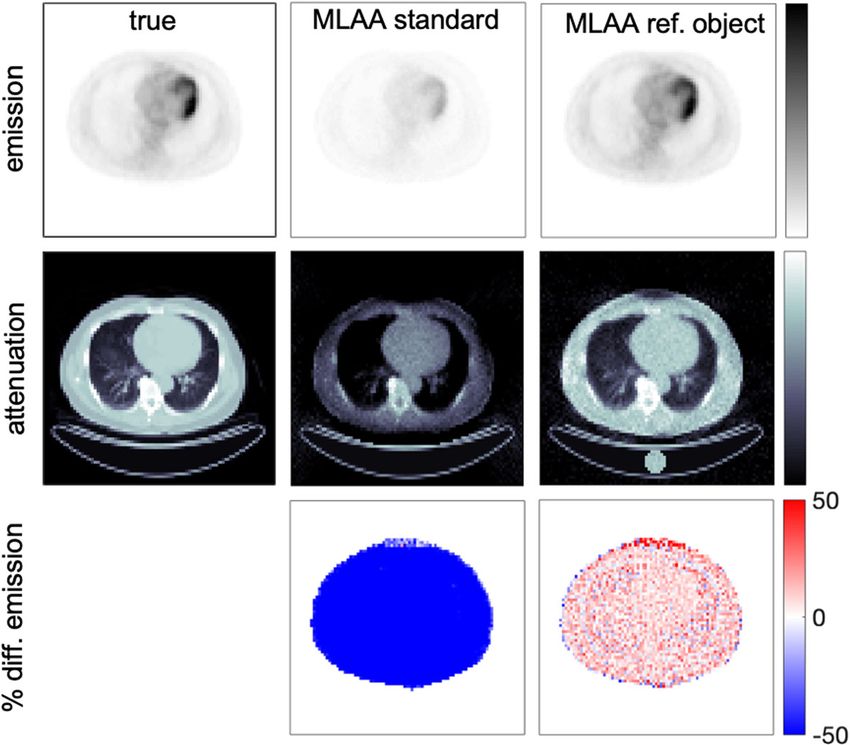
García-Pérez and España EJNMMI Physics          (2020) 7:3                                                     Page 5 of 12

                 algorithm with 100 iterations including known attenuation map. The standard devi-
                 ation (SD) was computed in a ROI at the center of the reconstructed image and the
                 number of events leading to a SD of 5% was selected as a reference for simulations with
                 patient data which corresponded to 107 coincidences for a CRT of 300 ps. In addition,
                 simulations with lower number of coincidences (106 and 105) were also tested to evalu-
                 ate the method at different noise levels.
                    In order to provide an initial estimate of the attenuation map for the MLAA algo-
                 rithm, we performed a non-attenuation corrected MLEM reconstruction and the body
                 contour was segmented using a Gaussian filter followed by a watershed algorithm. The
                 attenuation coefficient within the patient volume was initialized as water. True attenu-
                 ation values for the patient table and the reference object were included as a template
                 in the initial attenuation map.
                    The proposed algorithm was tested with different configurations of the reference ob-
                 ject including variations of the geometry, material composition, and activity. Initially,
                 the reference object was defined as a water cylinder with 4-cm diameter inserted in the
                 patient table with an activity concentration equal to the average activity concentration
                 within the patient (A0). In addition, other activity values were tested including no activ-
                 ity, A0/4, and 4·A0. The geometry of the reference object was also tested including 2
                 and 4 water cylinders each one filled with A0/2 and A0/4, respectively, to preserve the
                 total activity within the reference objects. For the case of 2 cylinders, an additional cy-
                 linder was placed on top of the patient and for the case of 4 cylinders, 2 more cylinders
                 were added on both lateral sides of the patient. Finally, two other materials for the ref-
                 erence object were tested using one cylinder with A0 made of lung or bone equivalent
                 materials with attenuation coefficients of 2.76·10− 3 and 12.01·10− 3 mm− 1, respectively.
                    A CRT of 300 ps was chosen to study all the configurations mentioned above which
                 is similar to the TOF resolution of most recent PET scanners [31–33]. In addition, two
                 other CRT values were studied to evaluate the performance of the proposed method in
                 the previous generation of PET scanners with a CRT of 540 ps [34, 35] and in PET
                 scanners with improved CRT (100 ps) that might be available in the future [36–38].

                 Image analysis
                 The accuracy of the obtained reconstructed images was evaluated as follows. The pa-
                 tient volume was segmented into four tissue types (t) including lung, bone, soft tissue,
                 and adipose tissue according to the attenuation coefficients included in the CT-derived
                 attenuation map. The mean percentage difference (Δt) between the reconstructed (xj)
                 and the true (xtrue
                                j ) emission images and the standard deviation of the percentage differ-
                 ence (SDt) were calculated for each tissue

                            1 X x j −x j
                                         true
                     Δt ¼                ∙100                                                           ð7Þ
                            nt j xtrue
                                     j

                 where nt is the number of pixels in the tissue t. In addition, pixel-wise maps with the
                 percentage difference between the reconstructed and the true emission images were
                 obtained.
García-Pérez and España EJNMMI Physics (2020) 7:3 Page 6 of 12
Results
First, the standard MLAA algorithm was applied without any reference object and
therefore, Eqs. 4 and 5 were not applied (see Fig. 1). Reconstructed emission and at-
tenuation images show a large deviation (> 50%) compared with true images due to the
limitation mentioned by Defrise et al. [16]. The reconstructed images obtained with
proposed method including a reference object and using the reference configuration
(CRT = 300 ps, 107 coincidences and reference object as one water cylinder with A0 ac-
tivity) are also shown in Fig. 1 obtaining a much better agreement (mean differences
are below 10% for all tissues).
In order to study the influence of the activity concentration within the reference ob-
ject, different cases were simulated and the resulting images are shown in Fig. 2. The
bias of the reconstructed image increased when the activity was reduced while a similar
SD was obtained for all cases when A > 0 (see Table 1). On the other hand, very large
differences were obtained when no activity was placed in the reference object as the
LORs with measured coincidences that cross the reference object are also crossing the
patient and then, the limitation mentioned by Defrise et al. [16] remains. Therefore,
some activity must be placed within the reference object to be able to implement this
method. This activity should be high enough to improve convergence although a very
high activity might deliver an unnecessary dose to the patient. Percentage difference
maps of attenuation images are also shown in Fig. 2 where larger deviations can be ob-
served at patient edges and lung interfaces with other tissues.
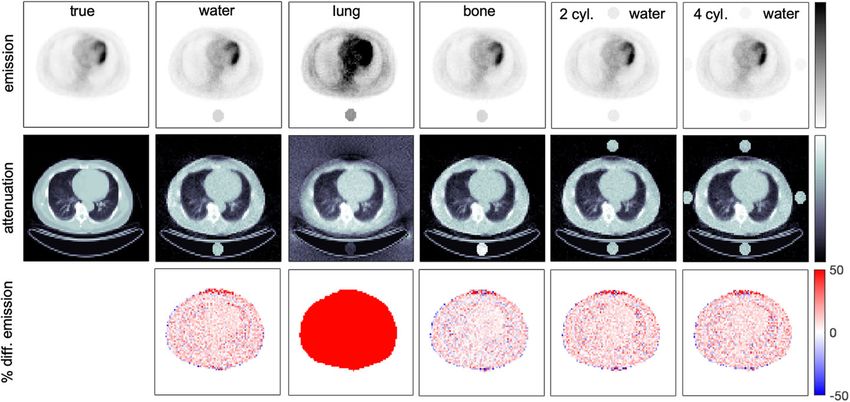
Other studied configuration parameters were the material and geometry of the refer-
ence object. Figure 3 shows the results obtained with one lung, water, or bone cylinder
as well as with 2 and 4 water cylinders. Very large differences were obtained for the
lung cylinder whereas all other cases show similar results as can be also observed in
Table 1. Therefore, for simplicity, the case with one water cylinder and A0 activity con-
centration can be considered the best choice among tested options. This configuration
Fig. 2 Reconstructed emission and attenuation images, percentage difference maps of emission images,
and percentage difference maps of attenuation images obtained with proposed MLAA reconstruction using
one water-filled cylinder with different activity concentrations (A). A0 is the average activity concentration
within the patient. True emission and attenuation images are also shown as a referenceGarcía-Pérez and España EJNMMI Physics (2020) 7:3 Page 7 of 12
Table 1 Mean percentage difference between the reconstructed and the true emission images
and SD for each tissue type obtained for all configurations included in this study. Reference
configuration corresponds to proposed MLAA with reference object defined as one water
cylinder (cyl) filled with A0 activity concentration, CRT = 300 ps and 107 coincidences. Results
obtained with fixed attenuation values in air pixels (F.A.) are included below
Configuration Bone Soft tissue Adipose tissue Lung
Mean SD Mean SD Mean SD Mean SD
Standard MLAA − 66.4 3.1 − 64.5 3.6 − 57.7 9.7 − 60.7 7.0
Reference 3.3 9.3 6.7 9.1 8.1 14.3 9.1 12.6
A =0 54.4 14.0 61.0 13.4 59.6 21.5 64.8 19.4
A = A0/2 7.8 9.5 13.1 9.1 14.1 15.0 15.4 13.5
A = A0·2 − 0.8 9.4 3.2 8.4 4.5 13.2 5.5 13.5
Lung cyl 155.3 24.5 166.1 21.4 177.3 43.4 174.8 40.4
None cyl − 1.9 8.8 3.8 8.6 5.3 13.5 5.7 12.8
2 water cyl 1.8 9.3 6.2 8.4 7.6 14.3 8.7 13.2
4 water cyl 1.9 9.5 6.2 9.1 8.6 14.3 8.9 13.7
5
100 ps, 10 83.3 68.9 73.5 74.8 78.5 102.0 78.7 91.6
300 ps, 105 104.2 153.0 120.2 148.4 124.5 194.1 126.7 195.0
5
540 ps, 10 85.3 159.1 96.7 160.8 115.2 221.8 118.1 225.5
100 ps, 106 15.3 14.9 17.2 16.1 17.9 21.8 17.4 19.9
300 ps, 106 13.8 25.0 16.5 29.0 19.0 38.8 18.8 41.8
540 ps, 106 40.7 48.6 51.2 47.6 57.1 67.7 61.5 75.9
7
100 ps, 10 5.9 4.4 7.0 4.7 7.4 7.0 7.7 6.1
540 ps, 107 − 2.6 15.9 8.4 13.2 11.9 19.5 16.2 22.2
Reference F.A. 7.0 9.0 8.4 10.7 7.5 20.5 9.8 14.4
Lung cyl F.A. − 0.2 7.9 1.7 9.6 − 0.4 15.0 1.9 12.1
Bone cyl F.A. 9.6 9.0 10.6 10.4 10.0 21.8 11.7 14.2
A = 0 F.A. 15.2 9.9 17.7 11.2 13.9 23.0 18.7 15.9
A = A0/2 F.A. 16.8 9.0 18.4 11.3 15.5 22.6 19.5 16.9
A = A0·2 F.A. − 1.7 8.9 0.0 9.3 − 0.4 17.6 1.3 14.2
cyl cylinder
of the reference object was also studied using different CRT and counting statistics and
the results are shown in Fig. 4. As expected, the accuracy of the results improved with
lower CRT and better results were obtained with a higher number of coincidences.
In all previous cases, the attenuation values were updated inside and outside the pa-
tient except for the patient table. In order to facilitate the convergence of the recon-
struction process, we also tested some of the cases previously reported fixing the
attenuation values outside the patient corresponding to air (see Fig. 5). Using this strat-
egy, the lung equivalent material in the reference object provides good results while
other cases with lower or no activity in the reference object still show large deviations.
Table 1 summarizes the mean percentage difference and the standard deviation ob-
tained for all segmented tissue types on each of the configurations evaluated in this
study. Finally, Fig. 6 shows the mean percentage difference obtained for soft tissue, as a
function of the number of iterations, in order to compare the convergence of different
configurations. The reliability and robustness of the proposed iterative method is illus-
trated in Fig. 6.García-Pérez and España EJNMMI Physics (2020) 7:3 Page 8 of 12
Fig. 3 Reconstructed emission and attenuation images and percentage difference maps of emission images
obtained with proposed MLAA reconstruction using one cylinder filled with reference activity concentration
(A0) and materials with different attenuation coefficients (water, lung, and bone) and using 2 and 4
cylinders filled with water and the same total activity as for the one cylinder case. True emission and
attenuation images are also shown as a reference
Discussion
The simultaneous reconstruction of emission and attenuation images using a modified
MLAA algorithm has been evaluated in this study trying to solve the fact that the at-
tenuation sinogram can only be determined up to an additive constant with standard
MLAA (see Fig. 1). As proposed by Defrise et al. [16], a reference object with known at-
tenuation could be used to overcome this limitation but to the best of our knowledge
no prior studies have been presented evaluating this option. In this study, we proposed
a modification in the MLAA algorithm including a bias correction on the attenuation
image based on the difference between the reconstructed values on the reference object
and its known attenuation values. This strategy was tested in 2D simulations using dif-
ferent configurations of the reference object (material, activity, and geometry) using a
Fig. 4 Reconstructed emission images and percentage difference maps of emission images obtained with
proposed MLAA reconstruction using one water cylinder filled with reference activity concentration (A0).
Results are shown for different CRT values (100, 300, and 540 ps) and different number of coincidences (105,
106, and 107)García-Pérez and España EJNMMI Physics (2020) 7:3 Page 9 of 12
Fig. 5 Reconstructed emission and attenuation images and percentage difference maps of emission images
obtained with proposed MLAA reconstruction with fixed attenuation values in air pixels. Reconstructed
cases include using as reference object one water-filled cylinder with different activity concentrations (A)
and one cylinder filled with reference activity concentration (A0) and materials with different attenuation
coefficients (lung and bone)
CRT of 300 ps and 107 coincidences in all cases. Obtained results suggest that the best
configuration corresponds to one water cylinder filled with an activity concentration
equal to the average activity within the patient although a higher activity would pro-
duce more accurate results and faster image convergence (see Fig. 5a) but delivering a
higher dose to the patient. The addition of more cylinders around the patient produced
minor differences after 1000 iterations although slower convergence was achieved (see
Fig. 6 Mean percentage difference for soft tissue as a function of the number of iterations obtained for
reference object with several activity concentrations (a), materials (b), and number of cylinders (c), and for
different CRTs (d). All other options were set as in the reference configuration (CRT = 300 ps, 107
coincidences and reference object as one water cylinder with A0 activity). All pixels of the attenuation
image except for the patient table were updated during the reconstructionGarcía-Pérez and España EJNMMI Physics (2020) 7:3 Page 10 of 12
Fig. 5c) and would require more complexity in the patient setup. Other geometries as
full ring or larger cylinders were also studied (results not shown) but no improvements
were obtained and those options were discarded due to the extra complexity of those
setups [23, 39].
The chosen configuration for the reference object was tested with different CRT
values and number of coincidences. For the high statistics case (107 coincidences),
mean percentage differences below 10% are shown in all cases except for adipose tissue
and lung for a CRT of 540 ps. However, the larger differences obtained in lung and adi-
pose tissue might be due to the fact that the activity concentration in the selected pa-
tient was much lower on those tissues than in bone and soft tissue and therefore, were
more susceptible to noise variations. Hence, the proposed technique might be applic-
able in available TOF-PET scanners with both 300 and 540 ps.
When counting statistics become very low (105 coincidences), as would be the case of
short frames in dynamic studies, very large deviations were obtained for all CRT values.
However, we must consider that the attenuation map could be obtained with the pro-
posed method using a longer acquisition from the end of the dynamic study and later
used in standard MLEM reconstruction for the dynamic data.
Further improvements could be included during the reconstruction process to avoid
high noise levels and slow convergence of the algorithm [40]. However, the aim of this
study was to evaluate the influence of the reference object under different conditions
and further improvements of this method were left to future studies. In addition, this
study was based on simple 2D simulations that did not include random or scatter
events. Therefore, futures studies must evaluate this technique in complete 3D simula-
tions and on measured data that should include phantom and patient data. Regarding
patient data, other regions as the brain, prostate, or breast imaging should be also stud-
ied. One possible limitation of the proposed technique is its implementation in stand-
alone PET scanners. Some of these scanners are very compact and there might not be
enough room for a reference object. In that case, a more compact geometry of the ref-
erence object would be required.
Conclusion
In this study, we tested a modified MLAA reconstruction algorithm that corrects the
bias in the attenuation image using a reference object with known attenuation. Differ-
ent configurations of the reference object were studied including geometry, material
composition, and activity. An optimal configuration was defined. In addition, this con-
figuration was tested using different CRT values in order to evaluate its performance in
current and future PET scanners and under different noise levels to evaluate its accur-
acy in scenarios like low injected dose or dynamic PET scans. In conclusion, this study
shows promising results that might allow to obtain accurate attenuation map from pure
TOF-PET data without prior knowledge from CT, MR, or transmission scans. However,
further studies are needed to test this method under more realistic conditions.
Abbreviations
CRT: Coincidence Resolving Time; CT: Computed Tomography; HU: Hounsfield Units; LOR: Line of response;
MLAA: Maximum likelihood estimation of attenuation and activity; MLEM: Maximum likelihood expectation
maximization; MR: Magnetic resonance; PET: Positron emission tomography; ROI: Region of interest; SD: Standard
deviation; TOF: Time of flightGarcía-Pérez and España EJNMMI Physics (2020) 7:3 Page 11 of 12
Acknowledgements
Not applicable
Authors’ contributions
SE performed the study design. PGP and SE contributed to data processing. PGP and SE contributed to manuscript
writing. All authors approved the final manuscript.
Funding
This work was supported by a grant from the Comunidad de Madrid (2016-T1/TIC-1099). The CNIC is supported by the
Instituto de Salud Carlos III (ISCIII); the Ministerio de Ciencia, Innovación y Universidades (MCNU); and the Pro CNIC
Foundation, and is a Severo Ochoa Center of Excellence (SEV-2015-0505).
Availability of data and materials
Data and materials are available on request to the authors.
Ethics approval and consent to participate
Not applicable
Consent for publication
Not applicable
Competing interests
The authors declare that they have no competing interests.
Received: 2 October 2019 Accepted: 7 January 2020
References
1. Pichler BJ, Wehrl HF, Judenhofer MS. Latest advances in molecular imaging instrumentation. J Nucl Med. 2008;49:5S.
2. Vandenberghe S, Marsden PK. PET-MRI: a review of challenges and solutions in the development of integrated
multimodality imaging. Phys Med Biol. 2015;60:R115.
3. Catana C. Development of dedicated brain PET imaging devices–recent advances and future perspectives. J Nucl Med.
2019;60:1044–52.
4. Grogg KS, Toole T, Ouyang J, Zhu X, Normandin MD, Li Q, et al. National Electrical Manufacturers Association and
clinical evaluation of a novel brain PET/CT scanner. J Nucl Med. 2016;57:646–52.
5. Garcia Hernandez T, Vicedo Gonzalez A, Ferrer Rebolleda J, Sanchez Jurado R, Rosello Ferrando J, Brualla Gonzalez L,
et al. Performance evaluation of a high resolution dedicated breast PET scanner. Med Phys. 2016;43:2261–72.
6. Keereman V, Mollet P, Berker Y, Schulz V, Vandenberghe S. Challenges and current methods for attenuation correction
in PET/MR. MAGMA. 2013;26:81–98.
7. Kalemis A, Delattre BM, Heinzer S. Sequential whole-body PET/MR scanner: concept, clinical use, and optimisation after
two years in the clinic. The manufacturer’s perspective. Magn Reson Mater Phys Biol Med. 2013;26:5–23.
8. Øen SK, Aasheim LB, Eikenes L, et al. Image quality and detectability in Siemens Biograph PET/MRI and PET/CT
systems—a phantom study. EJNMMI Phys. 2019;6:16.
9. Zaidi H, Hasegawa B. Determination of the attenuation map in emission tomography. J Nucl Med. 2003;44:291–315.
10. Yamakawa Y, Kitamura K. Attenuation correction using level set method for application specific PET scanners. In: IEEE
Nuclear Science Symposium Conference Record; 2011. p. 3130–2.
11. Chang T, Diab RH, Clark JW Jr, Mawlawi OR. Investigating the use of nonattenuation corrected PET images for the
attenuation correction of PET data. Med Phys. 2013;40:082508.
12. Nuyts J, Dupont P, Stroobants S, Benninck R, Mortelmans L, Suetens P. Simultaneous maximum a posteriori reconstruction of
attenuation and activity distributions from emission sinograms. IEEE Trans Med Imaging. 1999;18:393–403.
13. Rezaei A, Defrise M, Bal G, Michel C, Conti M, Watson C, et al. Simultaneous reconstruction of activity and attenuation in
time-of-flight PET. IEEE Trans Med Imaging. 2012;31:2224–33.
14. Salomon A, Goedicke A, Schweizer B, Aach T, Schulz V. Simultaneous reconstruction of activity and attenuation for PET/
MR. IEEE Trans Med Imaging. 2011;30:804–13.
15. Vandenberghe S, Mikhaylova E, D’Hoe E, et al. Recent developments in time-of-flight PET. EJNMMI Phys. 2016;3:3.
16. Defrise M, Rezaei A, Nuyts J. Time-of-flight PET data determine the attenuation sinogram up to a constant. Phys Med
Biol. 2012;57:885.
17. Rezaei A, Deroose CM, Vahle T, Boada F, Nuyts J. Joint reconstruction of activity and attenuation in time-of-flight PET: a
quantitative analysis. J Nucl Med. 2018;59:1630–5.
18. Panin VY, Defrise M, Nuyts J, Rezaei A, Casey ME. Reconstruction of uniform sensitivity emission image with partially
known axial attenuation information in PET-CT scanners. IEEE Nuclear Science Symposium and Medical Imaging
Conference Record (NSS/MIC). IEEE. 2012;2166–73.
19. Rezaei A, Michel C, Casey ME, Nuyts J. Simultaneous reconstruction of the activity image and registration of the CT
image in TOF-PET. Phys Med Biol. 2016;61:1852.
20. Cheng JC, Salomon A, Yaqub M, Boellaard R. Investigation of practical initial attenuation image estimates in TOF-MLAA
reconstruction for PET/MR. Med Phys. 2016;43:4163–73.
21. Sousa JM, Appel L, Engström M, et al. Evaluation of zero-echo-time attenuation correction for integrated PET/MR brain
imaging—comparison to head atlas and 68Ge-transmission-based attenuation correction. EJNMMI Phys. 2018;5:20.
22. Panin VY, Aykac M, Casey ME, Member S. Simultaneous reconstruction of emission activity and attenuation coefficient
distribution from TOF data, acquired with rotating external line source. Phys Med Biol. 2011;58:3469.García-Pérez and España EJNMMI Physics (2020) 7:3 Page 12 of 12
23. Mollet P, Keereman V, Clementel E, Vandenberghe S. Simultaneous MR-compatible emission and transmission imaging
for PET using time-of-flight information. IEEE Trans Med Imaging. 2012;31:1734–42.
24. Rothfuss H, Panin V, Moor A, Kemp BJ, Hruska CB, Mcfarland AR. Characterization of 176 Lu background in LSO-based
PET scanners. Phys Med Biol. 2017;62:3700.
25. Berker Y, Li Y. Attenuation correction in emission tomography using the emission data - a review. Med Phys. 2016;43:
807–32.
26. Berker Y, Schulz V, Karp JS. Algorithms for joint activity–attenuation estimation from positron emission tomography
scatter. EJNMMI Phys. 2019;6:1–30.
27. Siddon RL. Fast calculation of the exact radiological path for a three-dimensional CT array. Med Phys. 1985;12:252–5.
28. The cancer imaging archive (TCIA). Subject ID: 0522c0096. https://www.cancerimagingarchive.net/ Accesed 7 Jun 2019.
29. Clark K, Vendt B, Smith K, Freymann J, Kirby J, Koppel P, et al. The cancer imaging archive (TCIA): maintaining and
operating a public information repository. J Digit Imaging. 2013;26:1045–57.
30. Carney JPJ, Townsend DW, Rappoport V, Bendriem B. Method for transforming CT images for attenuation correction in
PET/CT imaging. Med Phys. 2006;33:976–83.
31. Rausch I, Ruiz A, Valverde-Pascual I, Cal-Gonzalez J, Beyer T, Carrio I. Performance evaluation of the Philips Vereos PET/CT
system according to the NEMA NU2-2012 standard. J Nucl Med. 2019;60:561–7.
32. van Sluis JJ, de Jong J, Schaar J, Noordzij W, van Snick P, Dierckx R, et al. Performance characteristics of the digital
biograph vision PET/CT system. J Nucl Med. 2019;60:1031–6.
33. Hsu DFC, Ilan E, Peterson WT, Uribe J, Lubberink M, Levin CS. Studies of a next-generation silicon-photomultiplier–based
time-of-flight PET/CT system. J Nucl Med. 2017;58:1511–8.
34. Surti S, Kuhn A, Werner ME, Perkins AE, Kolthammer J, Karp JS. Performance of Philips Gemini TF PET/CT scanner with
special consideration for its time-of-flight imaging capabilities. J Nucl Med. 2007;48:471–80.
35. Delso G, Fu S, Ladebeck R, Ganter C, Nekolla SG, et al. Performance measurements of the Siemens mMR integrated
whole-body PET/MR scanner. J Nucl Med. 2011;52:1914–22.
36. Nemallapudi MV, Gundacker S, Lecoq P, Auffray E, Ferri A, Gola A, et al. Sub-100 ps coincidence time resolution for
positron emission tomography with LSO:Ce codoped with Ca. Phys Med Biol. 2015;60:4635–49.
37. Schaart DR, Seifert S, Vinke R, van Dam HT, Dendooven P, Löhner H, et al. LaBr(3):Ce and SiPMs for time-of-flight PET:
achieving 100 ps coincidence resolving time. Phys Med Biol. 2010;55:N179–89.
38. Gola A, Acerbi F, Capasso M, Marcante M, Mazzi A, Paternoster G, et al. NUV-sensitive silicon photomultiplier
technologies developed at fondazione Bruno Kessler. Sensors (Switzerland). 2019;19:308.
39. Mollet P, Keereman V, Bini J, Izquierdo-Garcia D, Fayad ZA, Vandenberghe S. Improvement of attenuation correction in
time-of-flight PET/MR imaging with a positron-emitting source. J Nucl Med. 2014;55:329–36.
40. Caribé PRRV, Koole M, D’Asseler Y. et al. Noise reduction using a Bayesian penalized-likelihood reconstruction algorithm
on a time-of-flight PET-CT scanner. EJNMMI Phys. 2019;6:22.
Publisher’s Note
Springer Nature remains neutral with regard to jurisdictional claims in published maps and institutional affiliations.You can also read