Skills Shortages in the Greater Brisbane Labour Market 2012-2021 - 2013 Update - A Report Prepared for Regional Development Australia Brisbane ...
←
→
Page content transcription
If your browser does not render page correctly, please read the page content below

Skills Shortages in the Greater Brisbane
Labour Market 2012-2021 – 2013 Update

  A Report Prepared for Regional Development Australia Brisbane Inc.
                       www.rdabrisbane.org.au

                               July 2013

                   Synergies Economic Consulting Pty Ltd
                          www.synergies.com.au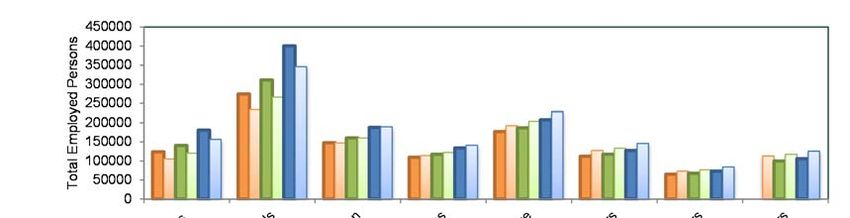
Background and Disclaimer

“Skills Shortages in the Greater Brisbane Labour Market 2012-2021 – 2013 Update”
updates the labour force capability study released by Regional Development Australia
(RDA) Brisbane in 2011. RDA Brisbane identified Brisbane’s skills base and labour force
availability as critical to the region’s economic future, and has recognised this as one of
five priorities in its Regional Roadmap (see www.rdabrisbane.org.au). Accordingly,
RDA Brisbane has been working with Brisbane City Council and Brisbane Marketing to
examine future skills needs as the first stage in developing further strategies to address
this key issue, and hence the commissioning of the study.

Synergies Economic Consulting (Synergies) has prepared this report exclusively for the
use of the party or parties specified in the report (the client) for the purposes specified
in the report (Purpose). The report must not be used by any person other than the client
or a person authorised by the client or for any purpose other than the Purpose for which
it was prepared.

The report is supplied in good faith and reflects the knowledge, expertise and experience
of the consultants involved at the time of providing the report.

The matters dealt with in this report are limited to those requested by the client and
those matters considered by Synergies to be relevant for the Purpose.

The information, data, opinions, evaluations, assessments and analysis referred to in, or
relied upon in the preparation of, this report have been obtained from and are based on
sources believed by us to be reliable and up to date, but no responsibility will be accepted
for any error of fact or opinion.

To the extent permitted by law, the opinions, recommendations, assessments and
conclusions contained in this report are expressed without any warranties of any kind,
express or implied.

Synergies does not accept liability for any loss or damage including without limitation,
compensatory, direct, indirect or consequential damages and claims of third parties, that
may be caused directly or indirectly through the use of, reliance upon or interpretation
of, the contents of the report.

This update report was prepared by John Mangan, Jeff Lassen and Lucy Yeh of Synergies
Economic Consulting.

                                               Brisbane                   Sydney                       Melbourne
Regional Development Australia Brisbane Inc.   Level 8, 10 Felix Street   Level 26, 44 Market Street   Level 40, 140 William Street
C/-DEEDI Smartlicence                          Brisbane QLD 4000          Sydney NSW 2000              Melbourne VIC 3000
400 Boundary Street, Spring Hill QLD 4000      GPO Box 2605               P 61 2 9089 8666             P 61 3 9607 8499
                                               Brisbane Qld 4001          F 61 2 9089 8989             F 61 3 9607 8491
PO Box 974, Spring Hill QLD 4004
                                               P 61 7 3227 9500
P (07) 3247 6292                               F 61 7 3221 0404
E mail@rdabrisbane.org.au
W www.rdabrisbane.org.au                       W www.synergies.com.au
Executive summary
Synergies Economic Consulting (Synergies) has been engaged by the Regional
Development Australia – Brisbane to update its report “Skills Shortages in the Greater
Brisbane Labour Market 2012-2021” released in 2011 to reflect latest socio-economic data
collected by the 2011 Census of Population and Housing and other relevant information.
This study update comes 18 months after the initial report. In normal circumstances, it
would be surprising if the update found any major points of difference to the original
report. However, over this period there have been some significant shifts both in
available data and in general labour force conditions.
Using these data we have revised our estimate of the expansion of the Greater Brisbane
Labour Market by 2021 to 292,478 jobs, based on our projections of a 2.5% annual growth
rate in labour force needs1. This is lower than our previous estimate of 343,000, which
was based on an expected growth rate of 2.9% and is indicative of the sensitivity of
economic projections to changed conditions. We feel that the “true” labour demand
growth will lie somewhere in between these two estimates. One factor that will influence
what path the actual jobs trend will take will be activity in the Construction sector. This
sector contracted rapidly in the post GFC period with a ripple effect throughout the
economy and a downward impact on our forecast results. Synergies expects that the
Construction industry will remain patchy over the next few year but start to ramp up
again after 2016. It will be interesting to track the modelling predictions for Construction
in the upcoming NIEIR job forecasts for the Greater Brisbane Region.
The following employment growth numbers by major occupational groups were
identified by 2021 (by broad ANZSCO 2006 code).
Forecasts of additional employees required for the period 2013-2021, by major occupational groupsa,
Greater Brisbane Labour Market
Occupations Persons to Employ
Managers
38494
Professionals
104156
Technicians and trades workers
44467
Community and personal service workers
31728
1 A breakdown of this figure into the amount of people that required from the Greater Brisbane, intrastate, interstate,
and international markets was unable to be performed at the time of the study due to lack of information on Brisbane
resident population components in 2011.
Page 3 of 46Occupations Persons to Employ
Clerical and administrative workers
35530
Sales workers
16998
Machinery operators and drivers
11429
Labourers
9,676
Total
292478
a Occupational major groups are classified according to ANZSCO 2006 classifications structure.
Note: Forecasts of additional employees required by major occupational groups for the Greater Brisbane Labour Market were estimated
by subtracting baseline predictions of total employment by major occupational groups in 2021 by total employed persons by major
occupational groups in May quarter 2012.
The industry breakdown of the employment growth number required by 2021 was also identified and is shown in the table below.
Forecasts of additional employees required for the period 2013-2021, by industry divisionsa, Greater
Brisbane Labour Market
Industry Persons to Employ
Agriculture, forestry and fishing
23
Mining
137932
Manufacturing
7916
Electricity, gas, water and waste services
2595
Construction
26720
Wholesale trade
144
Retail trade
20478
Accommodation and food services
20911
Transport, postal and warehousing
19082
Information media and telecommunications
2672
Financial and insurance services
3942
Rental, hiring and real estate services
7342
2 This figure for Mining is considered on the high side of our forecasts and may include estimates of employment growth
in Mining related areas and Services to Mining rather than Mining as it is normally understood. This is difficult to
test with but would be in line with our conclusion that Brisbane is increasingly becoming a service hub for the major
industries of Queensland.
Page 4 of 46Industry Persons to Employ
Professional, scientific and technical services
46741
Administrative and support services
13847
Public administration and safety
26114
Education and training
21153
Health care and social assistance
46410
Arts and recreation services
6206
Other services
6389
Total
292478
Concordance ratios3, drawn from the Household Income and Labour Dynamics Survey
(HILDA), were then used to assign these projected shortfalls across industry and
occupation (both by major and sub-major occupational groups). On this basis, and after
application of the latest vacancy rate data for the Greater Brisbane Labour Market, the
following key occupations are expected to experience skill shortages over 2013-2021.
Occupations of particular skills needs for the period 2012-2021, Greater Brisbane Labour Market
Major occupational groups Sub-major occupational groups
[11] Chief executives, general managers
[12] Farmers and farm managers4
Manager [13] Specialist managers (construction, production,
distribution, health education)
[14] Hospitality, retail and service man (retail,
accommodation)
[22] Business, human resource and market (sales,
marketing public)
[23] Design, engineering, science and training
Professionals [25] Health professionals
[26] ICT professionals (ICT/ information)
[27] Legal, social and welfare professionals
[32] Automotive and engineering trades workers
Technicians and trades workers [33] Construction trades workers
[34] Electro technology and telecommunication workers
3 The HILDA ratios are capable of performing one-to-one concordance between the 1-digit ANZSIC code and the 2-
digit ANZSCO code. Using these ratios, the number of employed persons working in an industry can be
disaggregated down to an approximation of the occupational distribution of those people working in that particular
industry.
4 Included as it is listed by the ABS as a category in Manager category- This category is unlikely to be significant in the
Greater Brisbane Labour market
Page 5 of 46Major occupational groups Sub-major occupational groups
[35] Food trades workers
[36] Skilled animal and horticultural workers5
[39] Other technicians and trades worker (Hairdressing)
[42] Carers and aides
[43] Hospitality workers
Community and personal service workers
[44] Protective service workers
[45] Sports and personal service workers
[53] General clerical workers
Clerical and administrative workers [55] Numerical clerks
[59] Other clerical and administrative workers
Note: The Hilda Concordance and the Internet Vacancy Index published by the Department of Education, Employment and Workplace
Relations were used to identify occupations requiring particular skills needs in the table.
While the above list is not exhaustive it is consistent with our overall conclusions about
the direction of the Greater Brisbane economy and its increasing service and tertiary
industry focus.
Issues with institutional arrangements primarily relate to wage flexibility and in-
migration of labour. In many ways these are national rather than local issues but local
employers will face wages issues driven by our predicted overall shortage of labour
across the board and by competition for labour between industries. The Greater Brisbane
Labour Market will be able to cope with the expected labour and skill demands over the
period 2013-2021.
The updated forecasts do not necessitate any additional recommendations to those in
our previous report. However, some issues raised in our accompanying supplementary
report does indicate that the recent changes (and proposed changes) in the structure of
tertiary education may have short to medium term impacts on the supply and cost of
skilled labour.
5 See footnote 3; A similar conclusion may be drawn for the category of Skilled animal and horticultural worker
Page 6 of 46Contents
Executive summary 3
1 Introduction 9
2 The Greater Brisbane Labour Market environment 12
2.1 Key characteristics 12
2.2 Sources of labour supply for the Greater Brisbane Labour Market 14
2.3 General labour market supply and demand in Queensland 15
2.4 Unemployment to vacancy relationships 17
2.5 Structural change 20
2.6 Summary of structural change in Greater Brisbane Labour Market 27
3 Baseline and business as usual employment projections by industry and
occupation 29
3.1 Baseline and business as usual employment estimates by industry and
occupation compared 33
4 Conclusion 37
A Labour market diagrams for the Greater Brisbane Labour Market 40
Figures and Tables
Figure 1 Queensland labour market framework as at September 2011 13
Figure 2 Labour supply and labour demand for the period February 2006 to
August 2012, Queensland 15
Figure 3 Queensland labour supply and labour demand by major occupational
groups, February 2006 to August 2012 16
Figure 4 Unemployment vacancy ratioa Australia and Queensland, February 2006
to August 2012 19
Figure 5 Unemployment vacancy ratioa Greater Brisbane Labour Market, May
2010 to September 2012 20
Figure A.1 Employed persons by non-school qualifications for the period 1996-2011,
Greater Brisbane Labour Market 40
Page 7 of 46Figure A.2 Growth projections of employment by industry divisionsa for the period
2012-2021, year on year growth rates (%), Greater Brisbane Labour
Market 41
Figure A.3 Growth projections of employment by major occupational groupsa for
the period 2012-2021, year on year growth rates (%), Greater Brisbane
Labour Market 42
Figure A.4 Projected employment by major occupational groupsa for period 2012-
2021, baseline and business as usual projections, Greater Brisbane
Labour Market 43
Figure A.5 Baseline predictions of employment by industry divisionsa for the
period 2012-2021, Greater Brisbane Labour Market 43
Figure A.6 Seasonally adjusted U/V ratiosa of major occupational groups, for the
period February 2006 to May 2011, Australia and Queensland 44
Table 1 Structural change, industry in the Greater Brisbane Labour Market, May
1989 to August 2012 21
Table 2 Structural change, occupations in the Greater Brisbane Labour Market,
May 1998 to August 2012 25
Table 3 Structural change, non-school qualifications in the Greater Brisbane
Labour Market, 1996 to 2011 26
Table 4 Growth projections of employment by industry divisionsa 2013-2021,
year on year growth rates (%) 29
Table 5 Growth projections of employment by major occupational groupsa
Greater Brisbane Labour Market, 2013-2021, year on year growth rates
(%) 30
Table 6 Forecasts of additional employees required for the period 2013-2021, by
industry divisionsa, Greater Brisbane Labour Market 31
Table 7 Forecasts of additional employees required for the period 2013-2021, by
major occupational groupsa, Greater Brisbane Labour Market 33
Table 8 Forecasts of employment by industry 2013-2021, Greater Brisbane
Labour Market (‘000) 34
Table 9 Forecasts of employment by major occupationsa (‘000) 2013-2021 Greater
Brisbane Labour Market (‘000) 35
Page 8 of 461 Introduction
Synergies Economic Consulting (Synergies) has been engaged by the Regional
Development Australia – Brisbane to update its report “Skills Shortages in the Greater
Brisbane Labour Market 2012-2021” released in 2011 to reflect latest socio-economic data
collected by the 2011 Census of Population and Housing. In this update study (Update)
we focus on the data changes and have omitted much of the background conceptual and
policy discussion. We refer interested readers to our previous report to access this
content.
Our initial report estimated that over the period 2012-2021, 343,000 new jobs were
needed in the Greater Brisbane Labour Market (GBLM). Occupationally these would be
concentrated into Professionals (136,410)6, Managers (62,403), Technicians and Trades
persons (46,202) and Clerical and Administrative workers (34,288). By industry, key
needs would be in Health Care and Social Assistance (58,519), Professional, Scientific
and Technical services (52,123) with strong labour/skill needs in Construction (43,359)
and Public Administration and Safety (34,457). Labour demand in some sectors was
expected to be reduced in an absolute sense including Wholesale trade and Agriculture,
Forestry and Fishing. The report broke these broad occupational categories into sub-
major occupational groups and flowing from this was an analysis of the capacity of the
local and national economy to provide this labour including a brief analysis of the
capacity of the educational sector to provide new graduates and diplomats.
This Update comes 18 months after the initial report. In normal circumstances, it would
be surprising if the Update found any major points of difference to the original report.
However, over this period there have been some significant shifts both in available data
and in general labour force conditions which have caused some of the agencies, against
which we benchmarked our findings, to modify their analysis of future conditions in the
Australian labour market. As a result, we have also modified our initial conclusions
because of:
• The release of the data from the 2011 Census of Population and Housing small area
data (hereafter referred to as the Census) – Some of the analysis in our initial report
was based upon trends established in the 2006 Census and as a result have changed
in the light of the more recent data. These new data plus some additional labour
6 Professionals, as defined by the Australian and New Zealand Standard Classification of Occupations (ANZSCO),
“perform analytical, conceptual and creative tasks through the application of theoretical knowledge and experience”
in various fields. Professional jobs generally require a Bachelor degree or higher qualification (skill level 1). Under
ANZSCO, the term ‘Professional’ includes 310 occupations, more than any other ANZSCO Occupation Major Group
`
Page 9 of 46force survey data for the later period of 2012 were used in re-estimated econometric
work7.
• The Australian Economy is tipped to see an easing in the Mining boom with a
consequent structural shift in labour demand.
• The Mining Industry will now need to place increased emphasis on regenerating
the industry based on exploration and increased Services to Mining.
• This in turn will require a substantial increase in the capacity and effectiveness of
the Services to Mining Industry.
• The expected shift in labour demand patterns will create both problems and
opportunities for the Queensland and Brisbane Labour market, freeing up some
skilled workers to be deployed in other areas and inducing changed labour demand
patterns, at least in the short run, in the Mining industry.
• The changed labour market conditions over the last 18 months, particularly in
Queensland, have implications for economic modelling. The more restrained labour
market conditions in the recent data will, because of the autoregressive nature of
most empirical techniques, reduce labour demand estimates in comparison to the
previous study. An example in point is the downturn in the Construction industry
with its high ripple effect on other industries, will tend to lower forecasts, perhaps
below the real long run trend.
• Within the context of the existing modelling technique this downward effect is
inevitable unless these data were counteracted by reference to superior knowledge
regarding likely economic conditions in the medium to longer term. The empirical
technique used here by Synergies is robust and in line with other studies but it is
susceptible to be influenced by short run events. The issue then becomes do we
incorporate the newer (possibly) short run results or use some form of smoothing
technique to provide trend estimates over a longer period. Our preference is to view
the recent downturn, and the impact that this had on our projections of future
labour demand in the GBLM, as a short term phenomena. We expect the labour
market over the next couple of years to trend back more towards the level of
estimates described in our original report. In this case it would be reasonable to
assume that the labour demand needs forecast in this amended report are lower
level estimates.
7 It is important to note that there have been some minor changes in the way the Australian Bureau of Statistics (ABS)
classified the Greater Brisbane Area for the 2011 Census compared to the 2006 Census. These changes will not
materially affect the projections in terms of their industrial and occupational outcomes.
Page 10 of 46This report is structured as follows:
• section 2 updates data on labour markets in the Greater Brisbane region; and
• section 3 presents the results of our modelling to identify projected skills shortages
in the GBLM.
Page 11 of 462 The Greater Brisbane Labour Market environment
2.1 Key characteristics
This section considers the current labour market environment within the Greater
Brisbane area. It does this to understand the environment in which skills shortages,
perceived and real, exist. As a result, such issues as openness of the market to inward
and outward migration and structural change within the industrial and occupational
framework need to be understood by policy makers attempting to devise an effective
skills shortages strategy.
As a capital city, Brisbane does not dominate the State labour market like Sydney or
Melbourne. For example, in 2010, the GBLM accounted for approximately 47% of the
overall Queensland labour force. This compares with Sydney’s share of the New South
Wales Labour market (approximately 65%) and Melbourne’s share of the Victorian
labour market (approximately 73%)8. The implication here is that Brisbane does not exert
the same pull upon skilled labour as the two other Eastern States and to some extent
competes with the regional centres of Townsville and the Gold Coast for skilled labour
especially in the professions and in public administration.
Part of the reason for this is that Brisbane has significantly fewer company head offices
than Sydney or Melbourne, which again has implications for its ability to draw on skilled
labour from interstate. Nevertheless as the State capital and centre of government,
Brisbane is able to attract labour from other regions to meet skill shortages. In this sense
it is important to understand the structure of the Queensland labour market as a whole
before examining the GBLM environment9.
Figure 1 provides a recent indication of the current structure of the Queensland (and by
inference, Greater Brisbane) labour markets10.
8 See, Mangan, J (2001) “The Capital Cities Effect on State Labour Markets”, Labour Market Research Unit, Department
of Employment and Industrial Relations, WP 13.
9 Assessment of the Queensland labour market environment is important for understanding the source and size of
potential inflow and outflow of skill workers from regional Queensland into Brisbane for the period 2012-2021. This
will have implication on understanding the scope of the skills shortages problem and where policies need to be
directed at attracting skilled labour at an intrastate, interstate and international level.
10 Note, it was not possible to provide this level of disaggregation at the GBLM level
Page 12 of 46Figure 1 Queensland labour market framework as at September 2011
Data source: Data presented in this figure is from a number of ABS publications published at different times of the year. (1) ABS 6202.0 Labour Force, Australia, February 2012. These figures are trended and
sub-categories may not add up to the totals. (2) ABS 6291.0.55.001 Labour Force, Australia, February 2012. (3) ABS 6220.0 Persons not in the Labour Force, September 2011. ‘Permanently unable to work’
derived from ‘total without marginal attachment’ less ‘wanted to work but not actively looking and not available’ less ‘did not want to work’. This is the most recent data available for detailed breakdown of persons
Not in Labour Force.
Page 13 of 46Figure 1 demonstrates the complexity of a modern labour market. Currently Queensland
has a potential workforce of about 3.6 million persons aged 15 years or over. Of these:
• between 66% and 68% are participating (employed or actively unemployed);
• the large majority (64%) are employed with effective unemployment operating at
around 4.5% of the labour force11;
• full-time employment is 72% of the total employed and 28% is part-time
employment;
• within the labour market are the very active (working or actively seeking work) and
those that want to work but are constrained in some way from starting within four
weeks;
• the long term unemployed (those unemployed for more than 12 months) are often
classified as active but there may be some doubt on this. In any event they are
unlikely to be suitable for immediate employment; and
• the 30%-32% non-participating group are a diverse but important dynamic in the
labour market and include those constrained by commitments (study, carer duties),
those that are hidden or discouraged unemployed. This group also contains a
substantial pool of potential workforce skills who are not participating12.
2.2 Sources of labour supply for the Greater Brisbane Labour
Market
Despite being less centralised than the Greater Sydney or Greater Melbourne Labour
Markets, it needs to be recognised that the GBLM is an open labour market with
considerable in and out flows. The main sources of labour supply are detailed in our
original report. Data do not exist to currently allow an update13. One factor that will have
impacted on the behaviour of participation rates in aggregate is the observed work
patterns. It is recognised that inward migrants tend to be younger and have a higher
participation rate than the host population. Where immigration is significant this will
raise upwards the aggregate level of participation. However, Connolly, Davis and
11 This is a slightly different measure than the normal unemployment rate and measures those unemployment and
immediately able to start work
12 The issue of a “reserve army” of skilled workers who are not currently participating in the labour market is discussed
in more depth in the supplementary report
13 In part this is due to minor changes in the way the ABS defines the Greater Brisbane Labour Market
Page 14 of 46Spence (2011) find that the growth in domestic workers aged over 55 was the single
greatest impact on observed participation behaviour in Australia in recent years14.
2.3 General labour market supply and demand in Queensland
Figure 2 shows labour demand (employment + vacancies) and labour supply
(employment + unemployment) for the Queensland labour market over the period 2006-
2012.
Figure 2 Labour supply and labour demand for the period February 2006 to August 2012,
Queensland
2,500
2,450
2,400
Persons ('000)
2,350
2,300
2,250
2,200
2,150
2,100
2,050
2,000
Aug-06
Nov-06
Aug-07
Nov-07
Aug-08
Nov-08
Aug-09
Nov-09
Aug-10
Nov-10
Aug-11
Nov-11
Aug-12
Feb-06
May-06
Feb-07
May-07
Feb-08
May-08
Feb-09
May-09
Feb-10
May-10
Feb-11
May-11
Feb-12
May-12
Months (Quarterly)
Labour Supply Labour Demand
Note: Labour Supply and Labour Demand data were derived using quarterly employment, unemployment and seasonally-adjusted vacancy
data for the Queensland labour market.
Since November 2008, aggregate labour supply has been greater than labour demand.
Over-supply has resulted from reduced aggregate labour demand following the Global
Financial Crisis (GFC) and a resultant rise in unemployment since that period, although
still at a moderate level of slightly above 5%. It should be noted that since February 2010,
advertised vacancies has risen to the point that demand and supply have moved closer
together, indicating a tightening of labour market conditions.
Such labour market conditions are conducive to the existence of skill shortages both in a
Type 1 (absolute skill shortage) sense and in terms of skill shortage Type 4 (where
14 See, Connolly, E., Davis, K. and Spence, G. (2011) “Trends in Labour Supply , Reserve Bank of Australia
http://www.rba.gov.au/publications/bulletin/2011/jun/1.html
Page 15 of 46employers are forced to use lower quality workers than desired). Evidence presented
later in the analysis from government and industry sources confirms this conclusion.
Inspection of the labour supply and labour demand diagrams by major occupational
groupings in Figure 3 shows excess labour supply post-GFC for Technicians and Trades
Workers, Community and Personal Service Workers, Clerical and Administrative
Workers, Labourers, Machinery Operators and Drivers and Sales Workers. In particular,
supply and demand has been most unbalanced for Labourers15.
Figure 3 Queensland labour supply and labour demand by major occupational groups, February
2006 to August 2012
Managers Professionals
320 520
500
300
480
Persons ('000)
Persons ('000)
280 460
440
260
420
240 400
380
220
360
200 340
Aug-06
Nov-06
Aug-07
Nov-07
Aug-08
Nov-08
Aug-09
Nov-09
Aug-10
Nov-10
Aug-11
Nov-11
Aug-12
Feb-06
May-06
Aug-06
Nov-06
Feb-07
May-07
Aug-07
Nov-07
Feb-08
May-08
Aug-08
Nov-08
Feb-09
May-09
Aug-09
Nov-09
Feb-10
May-10
Aug-10
Nov-10
Feb-11
May-11
Aug-11
Nov-11
Feb-12
May-12
Aug-12
Feb-06
May-06
Feb-07
May-07
Feb-08
May-08
Feb-09
May-09
Feb-10
May-10
Feb-11
May-11
Feb-12
May-12
Months (Quarterly) Months (Quarterly)
Technicians and Trades Workers Community and Personal Service Workers
410 250
400 240
Persons ('000)
230
Persons ('000)
390
380 220
370 210
360 200
350 190
340 180
330 170
Feb-06
Aug-06
Nov-06
Feb-07
Aug-07
Nov-07
Feb-08
Aug-08
Nov-08
Feb-09
Aug-09
Nov-09
Feb-10
Aug-10
Nov-10
Feb-11
Aug-11
Nov-11
Feb-12
Aug-12
May-06
May-07
May-08
May-09
May-10
May-11
May-12
Feb-06
May-06
May-07
Aug-06
Nov-06
Feb-07
Aug-07
Nov-07
Feb-08
May-08
Aug-08
Nov-08
Feb-09
May-09
May-11
Aug-09
Nov-09
Feb-10
May-10
Aug-10
Nov-10
Feb-11
Aug-11
Nov-11
Feb-12
May-12
Aug-12
Months (Quarterly) Months (Quarterly)
15 Labour is associated with lower-skilled work.
Page 16 of 46Clerical and Administrative Workers Sales Workers
380 280
270
370
Positions ('000)
Persons ('000)
260
360
250
350
240
340
230
330
220
320
210
310 200
Feb-06
Aug-06
Nov-06
Feb-07
Aug-07
Nov-07
Feb-08
Aug-08
Nov-08
Feb-09
Aug-09
Nov-09
Feb-10
Aug-10
Nov-10
Feb-11
Aug-11
Nov-11
Feb-12
Aug-12
May-06
May-07
May-08
May-09
May-10
May-11
May-12
Feb-06
May-06
Aug-06
Nov-06
Feb-07
May-07
Aug-07
Nov-07
Feb-08
May-08
Aug-08
Nov-08
Feb-09
May-09
Aug-09
Nov-09
Feb-10
May-10
Aug-10
Nov-10
Feb-11
May-11
Aug-11
Nov-11
Feb-12
May-12
Aug-12
Months (Quarterly) Months (Quarterly)
Machinery Operators and Drivers Labourers
190 310
300
180
Persons ('000)
Persons ('000)
290
170
280
160
270
150
260
140
250
130 240
Feb-06
Aug-06
Nov-06
Feb-07
Aug-07
Nov-07
Feb-08
Aug-08
Nov-08
Feb-09
Aug-09
Nov-09
Feb-10
Aug-10
Nov-10
Feb-11
Aug-11
Nov-11
Feb-12
Aug-12
May-06
May-07
May-08
May-09
May-10
May-11
May-12
Aug-06
Nov-06
Aug-07
Nov-07
Aug-08
Nov-08
Aug-09
Nov-09
Aug-10
Nov-10
Aug-11
Nov-11
Aug-12
Feb-06
May-06
Feb-07
May-07
Feb-08
May-08
Feb-09
May-09
Feb-10
May-10
Feb-11
May-11
Feb-12
May-12
Months (Quarterly) Months (Quarterly)
a The colour determines supply or demand: labour Supply is indicated by the green line and labour demand is indicated by the orange line.
Note: Labour Supply and Labour Demand data for each major occupational group (ANZSCO 2006) were derived using quarterly
employment, unemployment and seasonally-adjusted vacancy data for the Queensland labour market.
2.4 Unemployment to vacancy relationships
Another measure of the tightness of a labour market is the Unemployment/Vacancy
ratio (U/V ratio) for the economy and for various occupations and industries. The data
in
Page 17 of 46Figure 4 indicates that Queensland and by implication the GBLM is a tight labour market
(relatively low U/V ratios) but not as tight as the rest of Australia. This situation is
expected to change as the Mining industry recovers in Queensland. Further breakdowns
of labour supply and labour demand tightness by major occupational groups are shown
in Appendix A.
Page 18 of 46Figure 4 Unemployment vacancy ratioa Australia and Queensland, February 2006 to August 2012
3
2.5
2
U/V ratio
1.5
1
0.5
0
Aug-06
Nov-06
Aug-07
Nov-07
Aug-08
Nov-08
Aug-09
Nov-09
Aug-10
Nov-10
Aug-11
Nov-11
Aug-12
Feb-06
May-06
Feb-07
May-07
Feb-08
May-08
Feb-09
May-09
Feb-10
May-10
Feb-11
May-11
Feb-12
May-12
Months (Quarterly)
Australia Queensland
a Unemployment data used represents total unemployed persons (‘000) by occupational division of last job using 1-digit ANZSIC 2006
Code at quarterly data intervals. The seasonally adjusted Internet Vacancy Index (IVI) were utilised as an indication for job vacancies by
occupation.
Note: U/V ratios presented for Australia and Queensland has been seasonally adjusted.
Data source: ABS Cat No. 6204.0.55.001, ABS Cat No. 6291.0.55.003 and DEEWR IVI.
Finally, Figure 5 traces movements in the Brisbane U/V ratio over the last three months.
The graph shows that the GBLM on average has had between two and three unemployed
persons per advertised vacancy16 for the period May 2010 to May 2011. The spike in U/V
ratio in February 2011 reflects the general volatility in the labour market due to frictional
forces (employees whose contracts ended and were looking for a new job for the start of
a new year).
16 Under normal conditions a ratio of 5 (unemployed) to one advertised vacancy would be considered reasonable.
Page 19 of 46Figure 5 Unemployment vacancy ratioa Greater Brisbane Labour Market, May 2010 to September
2012
3.0
2.5
2.0
U/V Ratio
1.5
1.0
0.5
0.0
Months
a Unemployment data used represents total unemployed persons (‘000) at a three month moving average using original monthly data. The
vacancy data for Brisbane were obtained from Regional IVI, which is a three month moving average data.
Note: U/V ratio presented is a three months moving average.
Data source: ABS Cat No. 6291.0.55.001 and DEEWR IVI.
2.5 Structural change
A key factor affecting future skill needs of the GBLM is the degree of structural change
in the economy. Structural change relates to changes in the relative share of industries
and occupations in the economy in terms of a measure of economic activity such as
employment, output or value added, both in an absolute sense and relative to some
larger economy such as Australia as a whole. It is driven by changes in consumer
preference, industry structure and technical change. Lewis and Connolly (2010) argue
that the rate of structural change in Australia has increased markedly since 2000; a fact
they put down to an increasing reliance on mining production and declines in the
manufacturing base17.
As part of formulating a “Business as Usual” scenario, this section assesses structural
change in the Queensland and Brisbane economies.
One of the most commonly used methods for measuring structural change is shift share
analysis. With this measure, change in total employment in the local labour market area
is decomposed into:
17 See, Connolly, E and Lewis, C (2010) “ Structural Change in the Australian Economy” Reserve Bank of Australia
Bulletin, September
Page 20 of 46• the local labour market’s share of national growth due to growth in the national
economy during the period of analysis;
• the mix change in activities in the local labour market (that is, the share of regional
job growth attributed to the region’s mix of industries) based on the national growth
rates for individual industry sectors; and
• the shift change of activities toward the local labour market (that is, how the region’s
competitiveness, infrastructure base and other social and economic factors
contribute to regional job growth).
The advantage of shift share analysis is that it does not need value added or production
data which is often not available at the local labour market level of disaggregation.
Instead, it uses a single variable indicator such as employment or education levels which
are more normally available.
Shift share analysis was applied to industry and occupational employment data in the
GBLM over two periods 1989–1999 and 2000-2012. Differences between the periods were
used to assess structural change.
The result of the shift share analysis for employment by industry is shown in Table 1.
The shares that are included are:
• NS: national share
• IM: industry mix change
• RS: regional shift change
• TS: total share.
A positive number for national share, regional share and total share means that the
industry’s share of employment increased. A negative number means that it declined. In
terms of industry mix, a positive number means that the industry’s share of overall
regional job growth has increased. A negative number means that it declined.
Table 1 Structural change, industry in the Greater Brisbane Labour Market, May 1989 to August
2012
May 1989 to May 1999 May 2000 to August 2012
Industry NS IM RS TS NS IM RS TS
Agriculture, forestry and fishing
0.7 -0.7 1.5 1.5 2.0 -3.4 -1.3 -2.6
Mining
0.4 -1.1 1.8 1.1 0.9 7.1 6.4 14.4
Manufacturing
11.2 -22.2 18.5 7.5 28.1 -41.8 12.0 -1.7
Page 21 of 46May 1989 to May 1999 May 2000 to August 2012
Industry NS IM RS TS NS IM RS TS
Electricity, gas, water and waste services
1.2 -5.1 0.3 -3.6 1.4 3.1 9.4 14.0
Construction
5.9 -2.4 9.1 12.6 18.8 9.1 -9.3 18.6
Wholesale trade
4.8 -3.8 2.6 3.7 11.0 -6.9 -0.2 3.8
Retail trade
9.0 2.9 3.7 15.6 25.2 -5.3 -9.0 10.9
Accommodation and food services
4.2 9.8 0.8 14.8 14.2 -2.0 9.2 21.4
Transport, postal and warehousing
4.1 3.3 5.0 12.4 13.3 -4.4 6.6 15.5
Information media and telecommunications
2.5 -5.9 2.5 -0.9 6.4 -4.8 -4.0 -2.4
Financial and insurance services
3.5 -7.8 -0.7 -5.0 6.9 0.5 16.9 24.4
Rental, hiring and real estate services
1.6 1.2 -2.8 0.0 4.3 3.2 5.7 13.3
Professional, scientific and technical services
4.1 16.9 -3.5 17.5 17.7 18.0 4.0 39.7
Administrative and support services
1.7 9.3 0.9 11.9 8.1 -1.7 -0.5 5.9
Public administration and safety
4.3 1.6 13.6 19.4 13.6 8.8 13.1 35.5
Education and training
4.6 4.7 9.5 18.8 15.3 7.3 5.5 28.1
Health care and social assistance
6.5 3.6 13.4 23.5 26.6 28.4 -10.0 45.0
Arts and recreation services
0.9 2.5 3.0 6.5 2.9 3.1 2.8 8.8
Other services
3.9 2.7 0.0 6.5 9.8 -6.0 1.8 5.7
a Total Employment includes both part-time and full-time employed.
Note: See page 31 for table definitions. Brisbane refers to Brisbane Major Statistical Region, as data for Brisbane Statistical Division were
unavailable. Industries are classified according to ANZSIC (2006)
Table 1 shows a structural shift in the employment by industry within the GBLM away
from manufacturing and process work towards managerial, professional and service
employment over both periods. Specifically:
• Agriculture, Forestry and Fishing: in both periods 1 and period 2, employment in
this industry fell as a percentage of total employment and relative to the expected
national share.
• Mining: in both periods employment grew (from a low base) in Brisbane in an
absolute sense and relative to the expected national share if mining in the GBLM
had moved in line with national trends.
Page 22 of 46• Manufacturing: the industry mix moved against the Brisbane area with the growth
in employment, particularly in the second period, offsetting the increase
attributable to growth in the national economy.
• Electricity, Gas, Water and Waste Services: there was evidence of between-period
shifts in the behaviour of this industry, with relative falls in period 1 and relatively
strong growth relative to the expected national share in period 2.
• Construction: in absolute terms employment numbers grew in both periods but
with a slight relative decline in period 2 in regional share, where the growth in the
GBLM was slightly below expected national share. The regional shift suggests that
local conditions were responsible for the growth.
• Wholesale Trade: employment in the GBLM grew in both periods but the industry
mix in Brisbane led to a less than expected rate of increase based on expected
national share and indicates a reduction in the significance of this industry.
• Retail Trade: employment grew strongly in absolute terms across both periods but
the GBLM recorded a less than expected rate of growth due to a negative industry
mix effect. This indicates that had the Greater Brisbane retail employment grown at
the same rate as the national retail employment between the period May 2000 to
August 2012, the GBLM would have lost 5,300 jobs.
• Accommodation and Food Services: both periods recorded strong absolute growth
and growth above the expected national share.
• Transport, Postal and Warehousing: strong employment growth in both periods but
small industry mix decline in the later period.
• Information Media and Telecommunications: employment in the GBLM in this area
displayed a relative decline in industry mix and regional share components and a
small overall growth below the expected national share.
• Financial and Insurance Services: employment in the GBLM in this industry grew
but at a rate below the expected national share due to negative industry mix.
• Rental, Hiring and Real Estate Services: employment trends reversed in the second
period and grew strongly to be well above the expected national share.
• Professional, Scientific and Technical Services: employment in this industry grew
well above expected national share in the second period.
• Administrative and Support Services: employment in this industry grew well above
expected national share in the second period.
Page 23 of 46• Public Administration and Safety: employment in this industry grew well above
expected national share in the second period, particularly through a strong regional
competitiveness component.
• Education and Training: employment grew across both periods in an absolute and
relative sense. The regional share component was particularly significant in the
second period.
• Health Care and Social Assistance: Strong growths in employment in both periods
with growth in the second period being approximately double the expected national
share. However, the decline in relative competitive position in the second period is
negatively impacting the growth of this industry.
• Arts and Recreation Services: employment growth in both periods and above the
expected national share.
• Other services: employment fell in a relative sense and in relation to the expected
industry mix. This is in line with a decline in the relative significance of lower skill
work in the GBLM overall.
In summary, higher than expected growth occurred in: Mining; Accommodation and
Food Services; Electricity, Gas, Water and Waste Services (second period); Professional,
Scientific and Technical Services; Administrative and Support Services; Public
Administration and Safety; Education and Training; Health Care and Social Activities,
and Art and Recreation Services. The GBLM experienced relative declines (below the
expected national share) in the employment significance of Agriculture, Forestry and
Fishing; Manufacturing, Construction, Wholesale Trade, Retail Trade, and Financial and
Insurance Services.
Shift share analysis was also applied to observe structural shifts in the distribution of
employment in the GBLM by major occupational groups. The full results appear in
Table 2.
Page 24 of 46Table 2 Structural change, occupations in the Greater Brisbane Labour Market, May 1998 to
August 2012
May 1998 to May 1999 May 2000 to August 2012
Occupation NS IM RS TS NS IM RS TS
Managers
0.8 0.3 -6.1 -5.0 16.5 10.0 37.6 64.1
Professionals
1.8 1.8 1.4 5.0 42.8 34.7 50.1 127.6
Technicians and trades workers
1.4 -2.1 16.7 16.0 33.9 -8.1 -4.6 21.2
Community and personal service workers
0.8 2.2 1.0 4.0 19.4 16.6 8.3 44.3
Clerical and administrative workers
2.0 -0.6 -15.4 -14.0 45.4 -24.3 -1.9 19.2
Sales workers
1.1 -0.6 0.5 1.0 26.0 -13.0 -12.7 0.3
Machinery operators and drivers
0.7 0.6 -0.4 1.0 16.5 -7.4 1.5 10.6
Labourers
1.2 -1.5 -4.7 -5.0 26.3 -18.3 1.9 9.9
a Total Employment includes both part-time and full-time employed.
Note: See page 31 for table definitions. Brisbane refers to Brisbane Major Statistical Region, as data for Brisbane Statistical Division were
unavailable. Occupation classified according to ANZSCO (2006).
In summary, the results show:
• Managers in the first period of employment of this group fell well below that which
would have occurred if demand in the GBLM had grown at the national average
because of a negative regional competitiveness effect. This trend was completely
reversed in the second period where demand for Managers and Administrators
grew at approximately four times what would have applied if the GBLM had
followed national trends.
• Professionals experienced modest growth (above national share) in period 1 but
accelerated to four times that expected from the national share in period 2.
• Technicians and Trades Workers experienced slightly above national share in
period 1 but fell 35% below expected national share in period 2.
• Community and Personal Services Workers experienced growth above the national
share in period 1 due to a strong industry mix effect. This accelerated in period 2
where effective demand (employment) for this occupation increased at twice the
rate expected from observed outcomes at the national level.
Page 25 of 46• Clerical and Administrative Worker employment declined in period 1 relative to
the national share in period 1 and was 42% less than that projected from national
trends in period 2.
• Machinery Operators and Drivers employment declined due to a negative regional
competitiveness effect. Regional competitiveness improved in period 2 but this was
offset by a negative Industry Mix effect where the actual increase in employment
was 36% lower than that expected from the national share.
• Labourers employment numbers declined over both periods due to negative
industry mix and regional share effects. In period 2 the actual employment
performance was 2.7 times lower than if the GBLM had followed national trends.
Shift share analysis was also applied to observe structural shifts in the distribution of
employment in the GBLM by major educational classification. The full results appear in
Table 3.
Table 3 Structural change, non-school qualifications in the Greater Brisbane Labour Market, 1996
to 2011
1996 to 2001 2006 to 2011
Non-School Qualifications NS IM RS TS NS IM RS TS
Postgraduate diploma or graduate (postgraduate
degree) 2.4 3.9 1.5 7.8 13.362 11.100 1.751 26.212
Graduate diploma or graduate certificate
2.2 -0.9 1.8 3.1 6.967 0.718 2.004 9.689
Bachelor degree
14.2 16.1 3.5 33.8 59.983 1.341 8.654 69.978
Advanced diploma or diploma
9.5 -7.6 6.7 8.5 32.725 3.528 4.079 40.331
Certificate III/IV
16.7 14.0 1.9 32.5 61.096 2.069 18.073 81.238
Certificate I/II
3.9 -8.8 2.3 -2.7 5.216 -1.885 2.974 6.305
Certificate not further defined
0.0 - - - 6.973 -4.079 1.665 4.559
Level of education inadequately described
1.2 2.8 0.7 4.7 5.566 -1.269 -2.057 2.240
Level of education not stated
12.5 19.3 2.9 -9.7 37.515 -8.842 8.123 36.796
a Total employed includes both part-time and full-time employed.
Note: See page 31 for table definitions. Total employed persons employed measured by all person aged 15-64 level of highest non-school
qualification and selected characteristics (based on usual residence). Brisbane refers to Brisbane Major Statistical Region, as data for
Brisbane Statistical Division were unavailable.
Briefly, the results indicate the following:
• Postgraduate degree increased strongly in both periods, well above expected
national share. These results were driven by a very strong industry mix effect
Page 26 of 46indicating a structural shift in the Greater Brisbane Labour Market into activities
that support professional employment.
• Graduate Diploma or Graduate Certificate growth over both periods was in line
with expected national share.
• Bachelor Degrees were well above the expected national share in both periods,
driven by strong industry mix and regional share effects across both periods.
• Advanced Diploma or Diploma degrees in the first period did not grow at the same
rate as the national average. This was reversed in the second period mainly through
a stronger industry mix and regional share effect.
• Certificate III/IV qualifications grew in period 1 but had a small decline in period 2
due to an adverse industry mix effect in that period.
• Certificate I/II qualifications grew in period 1 but at a lower rate than the national
share and actually fell in absolute numbers in period 2.
• Certificate: not described grew in absolute numbers over both periods but at a lower
rate that the national share.
• No Qualifications showed less persons reported having no qualifications than
would have been predicted by the national share.
More detailed information regarding the shift share results is contained in Appendix A.
We also estimated employment distribution by major educational qualifications for
Brisbane Major Statistical Region in 2011 in Appendix A.1. In particular, significant
increases are estimated for people employed with a Bachelor Degree or a Certificate
III/IV qualification in 2011 compared with in 2006.
2.6 Summary of structural change in Greater Brisbane Labour
Market
Overall, the picture of the distribution of employment by industry, occupation and
qualifications is a pronounced shift into Managerial, Professional and other service
provisions in Mining, Public Administration and Safety, Health Care and Social
Assistance, Education and Training, and Accommodation and Food Services. It shows
underperformance and even partial withdrawal from process, trades and labouring
positions.
This in turn produced a shift in the distribution of workforce qualifications from an
earlier period of lagging behind the national trends to being:
Page 27 of 46• above national growth in higher level post school qualifications;
• broadly in line with national growth in diplomas and upper level Certificates; and
• lower than expected growth in lower level and technical qualifications.
The occupational employment baseline growth rates for 2013-2021 suggest Greater
Brisbane will continue to develop as a professional service hub for its adjoining region.
The factors supporting this view are:
• predicted high growth rates in Professionals and Technicians and Trades Workers;
• Queensland’s resources boom, which will continue to draw on high skill labour
residing in the greater Brisbane area; and
• increased affluence boosting consumption of high skill services.
The region need not necessarily be limited to State boundaries, although common
language, law and customs make growth within Queensland and Australia easier.
Page 28 of 46RDA
3 Baseline and business as usual employment
projections by industry and occupation
Our model predicts that labour requirements within the GBLM will increase at an
average annual rate of 2.5%. The growth predictions by industry are presented in Table
4.
Table 4 Growth projections of employment by industry divisionsa 2013-2021, year on year growth
rates (%)
Industry Synergies non-linear baseline predictions
Agriculture, forestry and fishing
0.1
Mining
6.2
Manufacturing
1.0
Electricity, gas, water and waste services
1.6
Construction
3.1
Wholesale trade
0.04
Retail trade
2.01
Accommodation and food services
3.2
Transport, postal and warehousing
2.75
Information media and telecommunications
1.6
Financial and insurance services
1.1
Rental, hiring and real estate services
3.2
Professional, scientific and technical services
4.2
Administrative and support services
4.2
Public administration and safety
2.9
Education and training
2.5
Health care and social assistance
3.2
Arts and recreation services
3.5
Other services
1.7
Page 29 of 46RDA
Industry Synergies non-linear baseline predictions
Overall
2.5
a Industries are classified according to ANZSIC 2006 divisional structure.
Note: Synergies non-linear year on year growth rate predictions for the period 2012-2021 applies to the Greater Brisbane Labour Market
only. Year on year growth rate predictions for DEEWR estimated are based on DEEWR’s 5 year Industry Employment Projections in 2010.
Deloitte Access Economics had projected annual employment growth for the period 2010-2025. NIEIR year on year industry
employment growth predictions were obtained by adjusting the projected employed persons by industry for the period 2006-2026. ABS/
SGS Economics & Planning annual employment by industry growth predictions were for the period 2006-2036.
Source: (1) DEEWR (2010), Industry Employment Projections. (2) Deloitte Access Economics (2009), Economic Modelling of Skills
Demand, report prepared for Skills Australia. (3) NIEIR (2008), Economic Activity and Employment Forecasts: 2006-2026. (4) ABS/SGS
(2008), Melbourne Employment Projections- Final Report, a report prepared for the Victorian Department of Transport, August 2008.
Similarly, our predictions for occupational growth are compared to other studies in
Table 5.
Table 5 Growth projections of employment by major occupational groupsa Greater Brisbane
Labour Market, 2013-2021, year on year growth rates (%)
Occupation Synergies non-linear baseline predictions
Managers
2.7
Professionals
3.3
Technicians and trades workers
2.6
Community and personal service
workers 2.7
Clerical and administrative workers
1.9
Sales workers
1.4
Machinery operators and drivers
1.6
Labourers
0.9
a Occupational major groups are classified according to ANZSCO 2006 classifications structure.
Note: Synergies non-linear year on year growth rate predictions for the period 2013-2021 applies to the Greater Brisbane Labour Market
only. Year on year growth rate predictions for DEEWR estimated are based on DEEWR’s occupation major group employment growth to
2015-16. Deloitte Access Economics had projected annual employment growth for the period 2010-2025. NIEIR year on year occupation
employment growth by place of work predictions were obtained by adjusting the projected employed persons by occupation for the period
2006-2026. ABS/ SGS Economics & Planning annual employment by occupation growth predictions were for the period 2006-2036.
Source: (1) DEEWR (2012), Employment Projections, Australian Jobs 2012. (2) Deloitte Access Economics (2009), Economic Modelling
of Skills Demand, report prepared for Skills Australia. (3) NIEIR (2008), Economic Activity and Employment Forecasts: 2006-2026. (4)
ABS/SGS (2008), Melbourne Employment Projections- Final Report, a report prepared for the Victorian Department of Transport, August
2008.
In this section two estimates of employment distribution by industry and occupation are
presented. The baseline projections are derived directly by applying the estimated
growth equation on the basis of the growth rates shown in Table 4 and Table 5. The
Business as Usual distribution is derived by holding employment distribution across
industry and occupation constant (at 2012 ratios) into the future. Total employment
growth is held constant for both scenarios to enable direct comparison of the predicted
Page 30 of 46RDA
structural changes (and therefore potential skill shortfalls) that will occur over the period
2013-2021.
Overall, between 2013 and 2021 labour force requirements within the GBLM are
expected to grow by at an annual rate of 2.5% and lead to an additional 292,47818
employees. It is noted that these represent lower estimates than contained in our earlier
report due to the influence of the relative labour market downturn over the last 18
months.
The extra employment needed to satisfy this needed labour requirement by industry is
shown in Table 6.
Table 6 Forecasts of additional employees required for the period 2013-2021, by industry
divisionsa, Greater Brisbane Labour Market19
Industry Persons to Employ
Agriculture, forestry and fishing
23
Mining
13793
Manufacturing
7916
Electricity, gas, water and waste services
2595
Construction
26720
Wholesale trade
144
Retail trade
20478
Accommodation and food services
20911
Transport, postal and warehousing
19082
Information media and telecommunications
2672
Financial and insurance services
3942
Rental, hiring and real estate services
7342
Professional, scientific and technical services
46741
18 A breakdown of this figure into the amount of people that will be required from the Greater Brisbane, intrastate,
interstate, and international markets was unable to be performed at the time of the study due to lack of information
on Brisbane resident population components in 2011.
19 Using August 2012 ABS Labour Force Data
Page 31 of 46RDA
Industry Persons to Employ
Administrative and support services
13847
Public administration and safety
26114
Education and training
21153
Health care and social assistance
46410
Arts and recreation services
6206
Other services
6389
Total
292,478
a Industries are classified according to ANZSIC 2006 divisional structure.
Note: Forecasts of additional employees required by industry divisions for the Greater Brisbane Labour Market were estimated by
subtracting baseline predictions of total employment by industry divisions in 2021 by total employed persons by industry divisions in May
quarter 2011.
The data in Table 6 shows that all industry groups will experience an absolute growth
in employment with very small but still positive gains in Agriculture, Forestry and
Fishing (23 new jobs) and Wholesale Trade (144 new jobs) . The results for these two
industries are the direct result of applying the non-linear growth model to the observed
employment declines in both industries as a result of productivity growth and structural
change in these industries over the period 1989-2012, and, in the case of Wholesale Trade,
a decentralisation of activity into the rest of Queensland.
Largest sectoral gains occur in:
• Professional, Scientific and Technical Services (46,741 additional positions required
by 2021);
• Health Care and Social Assistance (a need for 46,410 more positions by 2021);
• Construction (over 26,720 new positions required by 2021);
• Public Administration and Safety (26,114 additional positions required by 2021)
• Education and Training (21,153 additional positions required by 2021); and
• Accommodation and Food Services (20,911 new positions required by 2021).
More modest growth will occur in Retail Trade, Transport, Postal and Warehousing, and
Administrative and Support Services.
In terms of occupational growth, the baseline predictions are shown in Table 7.
Page 32 of 46You can also read