Snake River Watershed Stressor Identification Report-Lakes
←
→
Page content transcription
If your browser does not render page correctly, please read the page content below
Stressor identification – Lakes

February 2021

Snake River Watershed Stressor
Identification Report—Lakes
A study of local stressors limiting the fish community health in lakes within the Snake River Watershed,
with a focus on Pokegama Lake. Pokegama Lake is impaired based on the Fish Index of Biotic Integrity.
Report prepared by Minnesota Department of Natural Resources staff, for the Minnesota Pollution Control Agency.
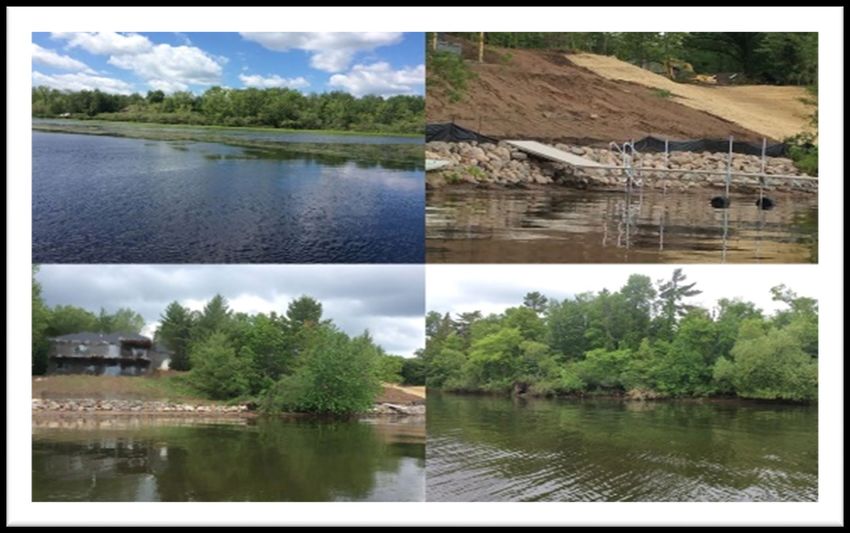
Author
Jacquelyn Bacigalupi (MNDNR)

Contributors/reviewers
Derek Bahr (MNDNR)
James Gerads (MNDNR)
Aaron Sundmark (MNDNR)
Leslie George (MNDNR)
Heidi Lindgren (MNDNR)
Mike Koschak (MPCA)

Cover photos: Four Shoreline Images taken during a June 2019 Pokegama Lake Fish Survey. Images
show two undeveloped shorelines and two highly developed shorelines with egregious clearing of
vegetation observed, photos taken during a 2019 FIBI survey.

Minnesota Department of Natural Resources
500 Lafayette Road | Saint Paul, MN 55155-4194 |
651-296-6157 | 888-646-6367 | Or use your preferred relay service. | Info.dnr@state.mn.us
This report is available in alternative formats upon request, and online at www.pca.state.mn.us.
Document number: wq-ws5-07030004c

Contents
Contents ......................................................................................................................................................... i
List of tables ................................................................................................................................................. iii
List of figures ................................................................................................................................................. ii
Key terms and abbreviations ........................................................................................................................ ii
Executive summary ....................................................................................................................................... 1
1. Introduction .............................................................................................................................................. 2
   1.1. Monitoring and assessment of lakes ................................................................................................. 2
   1.2. Stressor identification process........................................................................................................... 3
   1.3. Summary of lake stressors ................................................................................................................. 3
2. Overview of Snake River Watershed Lakes............................................................................................... 5
   2.1. Background ........................................................................................................................................ 5
   2.2. Monitoring and summary of biological impairments ........................................................................ 5
3. Possible Stressors to Lake Fish Communities in the Snake River Watershed ......................................... 10
   3.1. Candidate causes ............................................................................................................................. 10
   3.2. Eliminated causes............................................................................................................................. 13
4. Evaluation of candidate and inconclusive causes in Pokegama Lake ..................................................... 15
   Eutrophication ........................................................................................................................................ 16
   Physical habitat alteration ...................................................................................................................... 17
   Altered interspecific competition ........................................................................................................... 20
5. Conclusions and recommendations ........................................................................................................ 22
   Conclusions ............................................................................................................................................. 22
   Recommendations .................................................................................................................................. 22
References .................................................................................................................................................. 26

                                                                                 i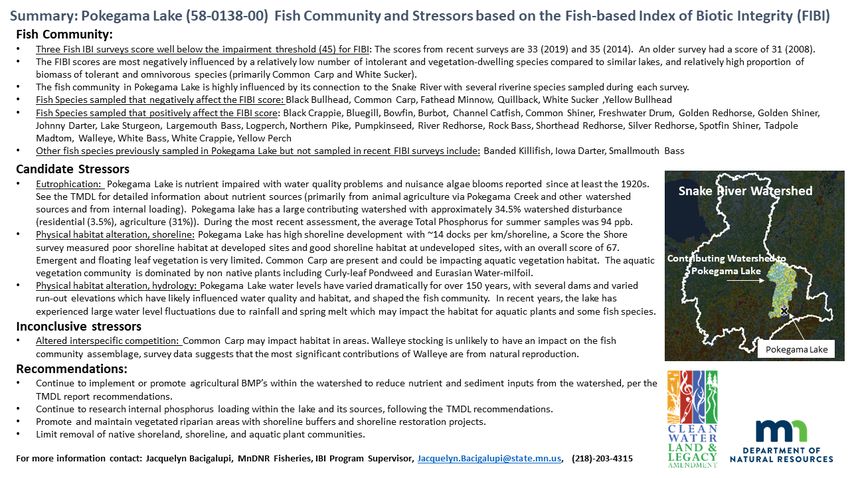
List of tables
Table 1. Summary of lake characteristics and metrics for FIBI tools. ........................................................... 2
Table 2. Summary of potential stressors of biological communities in Minnesota lakes. ........................... 3
Table 3. Lake FIBI tools with respective number of lakes assessed in the Snake, FIBI impairment
thresholds, and lower/upper 90% confidence limits (CL) around the impairment threshold. .................... 5
Table 4. Summary of lakes in the Snake River Watershed assessed with FIBI tools. ................................... 7
Table 5. Fish species captured1 historically in Pokegama Lake, in recent FIBI surveys (2019, 2018, 2014) in
Pokegama Lake, and sampled in the Snake River Watershed. ..................................................................... 7
Table 6. Summary of watershed and shoreline stressor information for the Snake River Watershed lakes
that were assessed using FIBI tools ............................................................................................................ 10
Table 7. Interpretation of Score the Shore survey data (From Perleberg et al. 2019). ............................. 11
Table 8. Score the Shore survey data for Pokegama Lake, June 8, 2017. .................................................. 18
Table 9. Summary of the conclusions related to stressors associated with the FIBI assessed lakes in the
Snake River Watershed. .............................................................................................................................. 22
List of figures
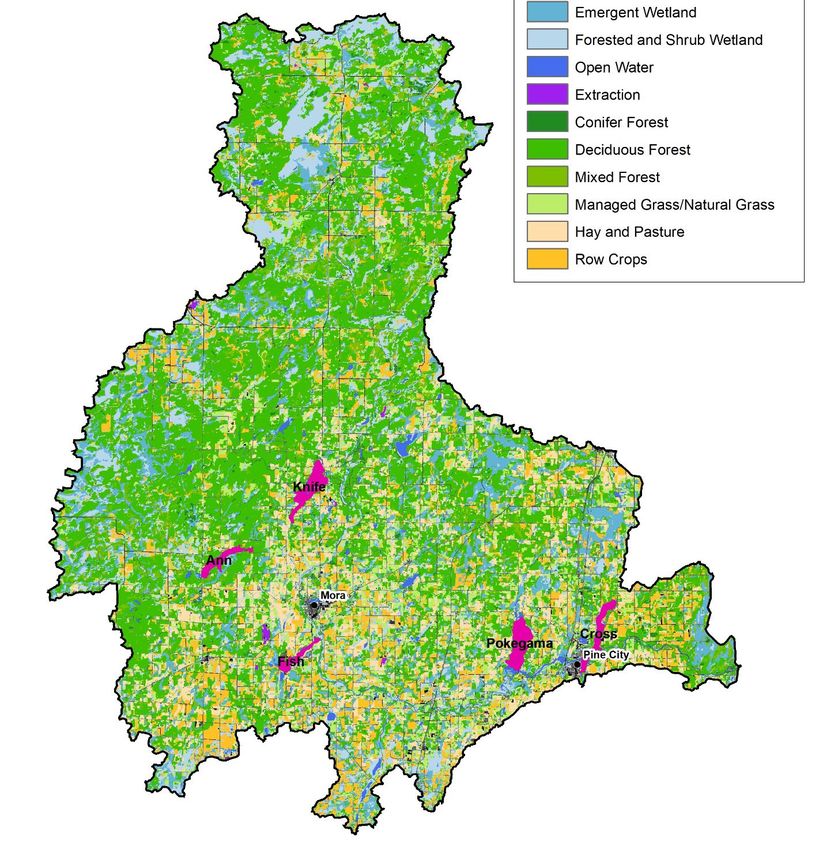
Figure 1. Snake River Watershed land cover classes with lakes sampled and assessed with Fish IBI
protocols (2016 National Land Cover Database land use data. Land use categories as described in Jin et
al. (2019)). ..................................................................................................................................................... 6
Figure 2. Floating leaf and emergent plants mapped in summer 2017, Pokegama Lake. ......................... 19
Figure 3. Pokegama Lake hydrograph available at mndnr.gov. Note the significant gaps in the record
prior to 1992 (elevations in NGVD 1929 datum). ....................................................................................... 20
Figure 4. Pokegama Lake (58-0138-00) fish community and stressors summary and handout; based on
fish index of biological integrity (FIBI) results. ............................................................................................ 25
Key terms and abbreviations
APM Aquatic Plant Management
AMA Aquatic Management Area
Contributing watershed All upstream areas bounded peripherally by a divide that ultimately drain
into a particular watercourse or water body
DO Dissolved oxygen
DOW Division of Waters number; in this report, a unique identification number for
water basins in Minnesota. Numbering follows the format of XX-YYYY-ZZ
where XX is a county code, YYYY is the basin number in that county, and ZZ is
the sub-basin identifier
iiEPA United States Environmental Protection Agency
FIBI Fish-based lake index of biological integrity; an index developed by the
MNDNR that compares the types and numbers of fish observed in a lake to
what is expected for a healthy lake (range from 0–100). More information
can be found at the MNDNR Lake Index of Biological Integrity website
HUC Hydrologic Unit Code
Insectivorous species A species that predominantly eats insects
Intolerant species A species whose presence and/or abundance decreases as human
disturbance increases
Littoral acres In this report, the acres of a lake that are 15 feet deep or less
MDA Minnesota Department of Agriculture
MNDNR Minnesota Department of Natural Resources
MPARS Minnesota Department of Natural Resources Permitting and Reporting
System
MPCA Minnesota Pollution Control Agency
Nearshore survey In this report, a fisheries survey conducted at evenly spaced, but random
sites along the shoreline utilizing 1/8 inch mesh seines and backpack
electrofishing to characterize primarily the nongame fish community of a
lake
NLCD National Land Cover Database developed by the U.S. Geological Survey to
provide spatially explicit information on the land cover and land cover
change in the U.S.
Small benthic dwelling
Species A species that is small and predominantly lives in close proximity to the
bottom
SSTS Sewage treatment systems
StS Score the Shore survey; a survey designed by the MNDNR to be able to
rapidly assess the quantity and integrity of lakeshore habitat so as to assess
differences between lakes and detect changes over time
TMDL Total Maximum Daily Load
Tolerant species A species whose presence or absence does not decrease, or may even
increase, as human disturbance increases
TP Total phosphorus; measurement of all forms of phosphorus combined
Vegetative dwelling
species A species that has a life cycle dependent upon vegetated habitats
Weight of evidence
Approach A method of using multiple sources or pieces of information to classify a
waterbody as impaired
iiiExecutive summary
The Minnesota Pollution Control Agency (MPCA) in coordination with the Minnesota Department of
Natural Resources (MNDNR) uses biological monitoring and assessment as a means to determine and
report the condition of the state’s lakes and inform restoration and protection strategies and projects.
This approach examines fish communities and related habitat conditions at multiple lakes throughout
major watersheds. Fish communities are sampled using a combination of trap nets, gill nets, beach
seines, and backpack electrofishing. From these data, a fish-based index of biological integrity (FIBI)
score can be developed, which provides a measure of overall fish community health. More information
about the sampling and assessment process can be found at the MNDNR lake index of biological
integrity website. If biological impairments are found, stressors to the aquatic community must be
identified.
Stressor identification (SID) is a formal and rigorous process that identifies stressors causing biological
impairment of aquatic ecosystems and provides a structure for organizing the scientific evidence
supporting the conclusions (Cormier et al. 2000). In simpler terms, it is the process of identifying the
major factors causing harm to aquatic life. SID is a key component of the major watershed restoration
and protection projects supported by Minnesota’s Clean Water Legacy Act.
This report summarizes SID work related to lakes in the Snake River Watershed. The Snake River
Watershed encompasses about 1,006 square miles and is predominantly as a mix of forested, wetland,
and agricultural land, and includes the cities of Mora and Pine City. The Snake River Watershed also
contains several lakes, rivers, streams, and wetland complexes.
Of the lakes within the Snake River Watershed, five were sampled and assessed using the FIBI to
evaluate biological health. Of the lakes that were sampled, all appear impacted by human activities in
the watershed and on the shorelines. Pokegama Lake was assessed as not supporting aquatic life use
based on FIBI scores that were below the impairment threshold established for similar lakes. The
remaining lakes were assess as fully supporting, but Cross Lake scored near the impairment threshold.
After examining many candidate causes for the biological impairments, eutrophication and physical
habitat alteration were identified as probable causes of stress to aquatic life within Pokegama Lake.
Altered interspecific competition was identified as a possible, but inconclusive cause. This SID report
follows a format to first summarize candidate causes of stress to the biological communities at
watershed scale. Within Section 3 there is information about how each stressor relates broadly to the
Snake River Watershed, water quality standards, and general effects on biology. Section 4 focuses on
Pokegama Lake. Section 5 contains conclusions and recommendations for the lakes assessed, with a
focus on Pokegama Lake. Each section discusses the available data and relationships to the fish
communities in more detail.
Snake River Watershed Stressor Identification Report – Lakes • February 2021 Minnesota Department of Natural Resources
11. Introduction
1.1. Monitoring and assessment of lakes
The approach used to identify biological impairments in lakes includes the assessment of fish
communities present in lakes throughout a major watershed. The fish-based lake index of biological
integrity (FIBI) utilizes fish community data collected from a combination of trap nets, gill nets, beach
seines, and backpack electrofishing. From this data, an FIBI score is calculated for each lake survey. The
FIBI score provides a measure of overall fish community health based on species diversity and
composition. The MNDNR has developed four FIBI tools to assess different types of lakes throughout the
state (Table 1; Table 3). More information on the FIBI tools and assessments based on the FIBI is
available at the MNDNR lake index of biological integrity website. Although an FIBI score may indicate
that a lake’s fish community is impaired, a weight of evidence approach is still used during the
assessment process that factors in considerations such as sampling effort, sampling efficiency, tool
applicability, location in the watershed, and any other unique circumstances to validate the FIBI score.
A common source of confusion regarding assessment decisions based on the FIBI is that if a lake
supports a quality gamefish population (e.g., high abundance or desirable size structure of a popular
gamefish species), that lake is considered completely healthy. This is not necessarily true because both
game-and nongame fish species must be considered when holistically evaluating fish community health.
Oftentimes, the smaller nongame fishes serve ecologically important roles in aquatic ecosystems and
are generally the most sensitive to human-induced stress. Likewise, high abundance or quality size
structure of gamefish populations will not disproportionately affect the FIBI score because multiple
metrics are used to evaluate different components of the fish community and each contributes equal
weight to the total FIBI score.
Table 1. Summary of lake characteristics and metrics for FIBI tools.
Lake characteristics FIBI 2 FIBI 4 FIBI 5 FIBI 7
Generally deep (many areas greater than 15' deep) X X Blank Blank
Generally shallow (most areas less than 15' deep) Blank Blank X X
Generally with complex shape (presence of bays, points, islands) X Blank X Blank
Generally with simpler shape (lack of bays, points, and islands) Blank X Blank Blank
Species richness metrics
Number of native species captured in all gear X Blank Blank Blank
Number of intolerant species captured in all gear X X X Blank
Number of tolerant species captured in all gear X X X X
Number of insectivore species captured in all gear X Blank Blank X
Number of omnivore species captured in all gear X X X Blank
Number of cyprinid species captured in all gear X Blank Blank Blank
Number of small benthic dwelling species captured in all gear X X Blank X
Number of vegetative dwelling species captured in all gear X X Blank X
Community composition metrics
Relative abundance of intolerant species in nearshore sampling X Blank X Blank
Relative abundance of small benthic dwelling species in nearshore
X X Blank Blank
sampling
Snake River Watershed Stressor Identification Report – Lakes • February 2021 Minnesota Department of Natural Resources
2Lake characteristics FIBI 2 FIBI 4 FIBI 5 FIBI 7
Relative abundance of vegetative dwelling species in nearshore
Blank Blank Blank X
sampling
Proportion of biomass in trap nets from insectivore species X X X X
Proportion of biomass in trap nets from omnivore species X X X Blank
Proportion of biomass in trap nets from tolerant species X X X X
Proportion of biomass in gill nets from top carnivore species X X X X
Presence/absence of Intolerant species captured in gill nets X X Blank Blank
Total number of metrics used to calculate FIBI 15 11 8 8
1.2. Stressor identification process
Stressor Identification (SID) is a formal and rigorous process that identifies stressors causing biological
impairment of aquatic ecosystems. The process provides a structure for organizing scientific evidence to
support conclusions (Cormier et al. 2000). In simpler terms, it is the process of identifying the major
factors causing harm to aquatic life. Stressor identification is a key component of the major watershed
restoration and protection strategy (WRAPS) projects funded by Minnesota’s Clean Water Legacy Act.
1.3. Summary of lake stressors
The MNDNR has developed a separate document that describes the various stressors of biological
communities in lakes, including where they are likely to occur, their mechanism of harmful effect,
Minnesota’s standards for those stressors where applicable, and the types of data available that can be
used to evaluate each stressor (MNDNR 2018a;
Table 2). Many literature references are cited, providing additional sources of information. The
document is entitled “Stressors to Biological Communities in Minnesota’s Lakes” and can be found on
the MNDNR lake index of biological integrity website. Additionally, the United States Environmental
Protection Agency (EPA) has information, conceptual diagrams of sources and causal pathways, and
publication references for numerous stressors to aquatic ecosystems on their CADDIS website.
Table 2. Summary of potential stressors of biological communities in Minnesota lakes.
Stressor Examples of anthropogenic sources Examples of links to aquatic biology
Eutrophication Inputs of excessive nutrients from Detrimental changes to aquatic plant
agricultural runoff, animal waste, fertilizer, diversity and abundance, restructuring of
industrial and municipal wastewater facility plankton communities, detrimental effects
discharges, non-compliant septic system to vegetative dwelling and sight-feeding
effluents, and urban storm water runoff predatory fishes
Physical habitat Riparian lakeshore development, aquatic Detrimental changes to aquatic plant
alteration plant removal, non-native species diversity and abundance, reduced
introductions, water level management, diversity and abundance of habitat
impediments to connectivity, sedimentation specialists, reductions in spawning success
Altered Unauthorized bait bucket introductions or Detrimental changes to energy flow,
interspecific unintentional transport, introductory and reductions in native species diversity and
competition supplemental stocking activities by abundance through predation or
management agencies or private parties, competition for resources
angler harvest
Snake River Watershed Stressor Identification Report – Lakes • February 2021 Minnesota Department of Natural Resources
3Stressor Examples of anthropogenic sources Examples of links to aquatic biology
Temperature Climate change resulting from emission of Physiological stress and reduced survival,
regime changes greenhouse gases particularly for intolerant coldwater
fishes, increases in aquatic plant biomass
and distribution
Decreased Inputs of excessive nutrients, climate change Suffocation, detrimental effects to
dissolved oxygen resulting from emission of greenhouse gases locomotion, growth, and reproduction of
intolerant fishes
Increased ionic Road salt and de-icing product applications, Detrimental effects to intolerant fishes
strength industrial runoff and discharges, urban and other aquatic organisms
storm water and agricultural drainage,
wastewater treatment plant effluent
Pesticide Herbicide applications to aquatic plant Reduced aquatic plant biomass, reduced
application communities, runoff and drift from herbicide abundance and diversity of vegetative
and insecticide applications to agricultural, dwelling fishes
suburban, and urban areas
Metal Runoff and leaching from mining operations, Reduced survival, growth, and
contamination industrial sites, firing ranges, urban areas, reproduction of fishes
landfills, and junkyards
Unspecified toxic Runoff and leaching from industrial sites, Altered food web dynamics, reduced
chemical agricultural areas, mining, logging, urban fitness of fishes from chronic exposure
contamination and residential activities, and landfills, spills,
illegal dumping, and discharges from
industries, municipal treatment facilities,
and animal husbandry operations
Snake River Watershed Stressor Identification Report – Lakes • February 2021 Minnesota Department of Natural Resources
42. Overview of Snake River Watershed Lakes
2.1. Background
The Snake River Watershed encompasses approximately 1,006 square miles characterized
predominantly as a mix of forested, wetland, and agricultural land, with more forested and wetland land
in the northern part of the watershed, and a higher portion of agricultural land in the southern portion
of the watershed (Figure 1. ). Approximately 25% of the watershed is in public ownership with several
state forests and wildlife management areas, mostly in the upper portions of the watershed. Most of the
watershed is rural, with Mora and Pine City as the largest population centers. The Snake River
Watershed also contains many rivers, streams, and wetland complexes and several lakes. The Snake
River Watershed falls within the North Central Hardwood Forest and Northern Lakes and Forests
ecoregions.
2.2. Monitoring and summary of biological impairments
The FIBI was used to assess five lakes in the Snake River Watershed (Figure 1. ; Table 4). Four lakes with
FIBI scores at or above the impairment threshold for their respective FIBI tool were assessed as fully
supporting aquatic life use (Table 3; Table 4). These lakes include Knife, Fish, Ann, and Cross Lakes.
Pokegama Lake was assessed as not supporting aquatic life use because the FIBI scores were below the
impairment threshold (Table 4). The focus of this document is to review stressor information for
Pokegama Lake, although sections 3 and 5 will briefly discuss stressors relevant to all lakes in the
watershed.
Table 3. Lake FIBI tools with respective number of lakes assessed in the Snake, FIBI impairment thresholds, and
lower/upper 90% confidence limits (CL) around the impairment threshold.
Number of Snake River FIBI impairment
Lake FIBI tool WS lakes assessed threshold Lower CL Upper CL
Tool 2 2 45 36 54
Tool 5 1 24 9 39
Tool 7 2 36 27 45
The five lakes sampled and assessed with the FIBI in the Snake River Watershed had fairly high species
richness, likely due to the strong connections with several streams and rivers, including the Snake River
in some cases. Several riverine species not commonly sampled in Minnesota lakes were sampled during
FIBI surveys, including Chestnut Lamprey, Lake Sturgeon, and several redhorse species. In the lakes
assessed in the Snake River Watershed, relatively few vegetative dwelling species or intolerant species
were sampled.
Snake River Watershed Stressor Identification Report – Lakes • February 2021 Minnesota Department of Natural Resources
5Figure 1. Snake River Watershed land cover classes with lakes sampled and assessed with Fish IBI protocols (2016
National Land Cover Database land use data. Land use categories as described in Jin et al. (2019)).
Snake River Watershed Stressor Identification Report – Lakes • February 2021 Minnesota Department of Natural Resources
6Table 4. Summary of lakes in the Snake River Watershed assessed with FIBI tools.
DNR GIS FIBI Impairment FIBI Aquatic Life
DOW Lake name County FIBI survey Survey Notes acres tool % littoral1 FIBI scores Threshold for tool Assessment status2
33-0028-00 Knife Kanabec 2015, 2011 N/A 1,259 7 100 46, 47 36 FS
33-0036-00 Fish Kanabec 2017 N/A 506 7 100 56, 52 36 FS
33-0040-00 Ann Kanabec 7/2015, 6/2015 N/A 653 5 92 52, 28 24 FS
58-0119-00 Cross Pine 2018, 2014 water level high in 2014 925 2 55 52, 48 45 FS
58-0142-00 Pokegama Pine 2019, 2014 water level high in 2014 1,521 2 59 33, 35 45 NS
≤ lower CL (red) > lower CL & ≤ threshold (orange) > threshold & ≤ upper CL (green) > upper CL (blue)
1
% littoral is the percentage of the lake that is less than 15 feet deep calculated using MNDNR GIS data.
2 "FS" indicates fully supporting aquatic life use based on the Fish IBI, "NS" indicates not supporting aquatic life use based on the Fish IBI
Table 5. Fish species sampled in the Snake River Watershed with FIBI tolerance, feeding, and habitat guild assignments, and indications of which have been
sampled1 historically in Pokegama Lake, and in recent FIBI surveys (2019, 2018, 2014) in Pokegama Lake.
Species Sampled in the Snake Tolerance, feeding, and/or Historically Sampled in Sampled in recent
River Watershed habitat guild1 Pokegama Lake FIBI survey in Pokegama Lake
Bigmouth Buffalo Nat, Tol, Ins X X
Black Bullhead Nat, Tol, Omn X X
Black Crappie Nat, TC X X
Blackchin Shiner Nat, Int, Ins, Veg, Cyp Not Sampled
Blacknose Shiner Nat, Int, Ins, Veg, Cyp Not Sampled
Bluegill Nat, Ins X X
Bluntnose Minnow Nat, Omn, Cyp Not Sampled
Bowfin Nat, TC, Veg X X
Brook Silverside Nat, Ins X (1995) Not Sampled
Brown Bullhead Nat, Omn X (multiple surveys) Not Sampled
Burbot Nat, Int, TC X X
Central Mudminnow Nat, Ins, Veg Not Sampled
Channel Catfish Nat, TC X X
Chestnut Lamprey Nat, TC X X
Snake River Watershed Stressor Identification Report – Lakes • February 2021 Minnesota Department of Natural Resources
7Species Sampled in the Snake Tolerance, feeding, and/or Historically Sampled in Sampled in recent
River Watershed habitat guild1 Pokegama Lake FIBI survey in Pokegama Lake
Common Carp Tol, Omn X X
Common Shiner Nat, Ins, Cyp X X
Fathead Minnow Nat, Tol, Omn, Cyp X X
Freshwater Drum Nat, Ins X X
Golden Redhorse Nat, Ins X X
Golden Shiner Nat, Ins, Cyp X X
Greater Redhorse Nat, Int, Ins X (2000) Not Sampled
Green Sunfish Nat, Tol, Ins Not Sampled
Hornyhead Chub Nat, Ins, Cyp Not Sampled
Iowa Darter Nat, Int, Ins, Smb, Veg Not Sampled
Johnny Darter Nat, Ins, Smb X X
Lake Sturgeon Nat, Int, Ins X X
Largemouth Bass Nat, TC X X
Logperch Nat, Int, Ins, Smb X X
Mimic Shiner Nat, Int, Ins, Veg, Cyp Not Sampled
Muskellunge Nat, Int, TC, Veg X2 (1987, 2010)
Northern Pike Nat, TC, Veg X X
Northern Redbelly Dace Nat, Veg, Cyp Not Sampled
Pumpkinseed Nat, Ins X X
Quillback Nat, Omn X X
River Redhorse Nat, Ins X X
Rock Bass Nat, Int, TC X X
Shorthead Redhorse Nat, Ins X X
Silver Redhorse Nat, Ins X X
Smallmouth Bass Nat, Int, TC X (1995) Not Sampled
Spotfin Shiner Nat, Ins, Cyp X X
Spottail Shiner Nat, Ins, Cyp X (1995, 2000) Not Sampled
Snake River Watershed Stressor Identification Report – Lakes • February 2021 Minnesota Department of Natural Resources
8Species Sampled in the Snake Tolerance, feeding, and/or Historically Sampled in Sampled in recent
River Watershed habitat guild1 Pokegama Lake FIBI survey in Pokegama Lake
Tadpole Madtom Nat, Ins, Smb, Veg X X
Walleye Nat, TC X X
White Bass Nat, TC X X
White Crappie Nat, TC X X
White Sucker Nat, Omn X X
Yellow Bullhead Nat, Omn X X
Yellow Perch Nat, Ins X X
1 Tolerance, feeding, and habitat guilds are abbreviated as follows: Nat=Native, Int=Intolerant, Tol=Tolerant, Ins=Insectivore, Omn=Omnivore, TC=Top Carnivore, Smb=Small Benthic Dweller,
Veg=Vegetative Dweller, and Cyp=Cyprinid. Guild abbreviations colored red contribute negatively to the FIBI score whereas those colored blue contribute positively to the FIBI score.
2
Stocked into connected lake (Cross)
Snake River Watershed Stressor Identification Report – Lakes • February 2021 Minnesota Department of Natural Resources
93. Possible Stressors to Lake Fish Communities in
the Snake River Watershed
3.1. Candidate causes
Eutrophication
Land use disturbance and the resulting excess nutrients such as total phosphorus (TP) have been
identified as causes of eutrophication in lakes. Water quality measurements taken in the five Snake
River Watershed lakes assessed for aquatic life use indicate that TP averages 113 parts per billion (ppb)
and varies from 75 ppb in Ann Lake to 203 ppb in Cross Lake (Table 6). Similarly, land use disturbance
(i.e., cropland, pasture, urban, and/or mining), in the upstream watersheds averages 24% and varies
from 11% in Ann Lake to 34% in Pokegama Lake (Table 6). Cross and Jacobson (2013) found that TP
levels are typically significantly elevated when land use in the contributing watershed approaches 40%,
with higher rates of TP elevation in shallow lakes and in watersheds with agricultural land use
disturbance. All lakes assessed have agriculture in their contributing watersheds and are subject to
mixing and resuspension of TP. All five lakes in this report were assessed by MPCA for aquatic
recreation as impaired based on MPCA’s nutrient water quality standards (Minn. R. Ch. 7050). The
standards require that TP and either chlorophyll-a or transparency need to exceed an established
threshold to be listed as impaired. MPCA’s nutrient water quality standards have been established for
aquatic recreation use; however, fish communities may exhibit responses at different threshold levels,
and are also affected by connected waters and lake habitat characteristics. Climatic conditions can
exacerbate eutrophication with increased heavy rainfall and increased temperatures worsening existing
water quality problems. The Snake River watershed receives on average two additional inches of rain
from the historical average (1895-2018) and climate scientists suggest that precipitation events are
becoming more intense (MPCA 2020d). Given the above information, eutrophication will be evaluated
further as a potential stressor within the Snake River Watershed in Section 4.
Table 6. Summary of watershed and shoreline stressor information for the Snake River Watershed lakes that were
assessed using FIBI tools. Eutrophication, shoreline, and interspecific competition are addressed in the next
several pages and refer back to Table 6.
Percent
contributing Score Non-native
FIBI watershed Total Dock the fish and
Lake FIBI Assessment landuse phosphorus density Shore plant
DOW name tool status1 disturbance2 (ppb)3 (#/mi)4 score5 species6
33-0028-00 Knife 7 FS 20 103 17 71 CLP, EWM7
33-0036-00 Fish No Carp, CLP
7 FS 26 92 5
data
33-0040-00 Ann 5 FS 11 75 4 83 Carp, CLP
58-0119-00 Cross Carp, CLP,
2 FS 29 203 16 69
EWM
58-0142-00 Pokegama Carp, CLP,
2 NS 34 94 22 67
EWM
Snake River Watershed Stressor Identification Report – Lakes • February 2021 Minnesota Department of Natural Resources
101 "FS" indicates fully supporting aquatic life use, "NS" indicates not supporting aquatic life use 2 Percent watershed disturbance is calculated as the percentage of land in each lake’s contributing watershed that was classified as developed, agricultural, or barren based on 2016 National Land Cover Database land use data. Land use categories as described in Jin et al. (2019). Calculations of watershed disturbance from Watershed Health Assessment Framework (MNDNR 2020d). 3 Total phosphorus is calculated as the 10-year average of measurements taken June 1–September 30, MPCA data (4/2020) 4 Dock density is estimated from counts of docks visible on Google Earth in 2015–2019. 5 Score the Shore scores (Perleberg et al. 2019) assess the quantity and integrity of lakeshore habitat. 6 Carp=Common Carp, CLP=curly-leaf pondweed, EWM=Eurasian water milfoil 7 Common Carp have not been sampled in Knife Lake since the 1989 chemical reclamation. Physical habitat alteration There are a number of components of physical habitat including, but not limited to, substrate, aquatic and shoreline vegetation, and in-lake woody habitat. There are also numerous ways to measure physical habitat alteration; this section will discuss measures of shoreline disturbance, aquatic and shoreline plant alterations, hydrologic and connectivity alterations, and sedimentation. Four of the five lakes discussed in this report have MNDNR Score the Shore (StS). Score The Shore is a natural resources survey to estimate the amount of habitat in shoreland, shoreline, and aquatic lakeshore zones. StS scoring process provides a simple method of ranking individual lake sites and the entire lake based on the amount of lakeshore remaining in natural condition surveys (Perleberg et al. 2019). The scores on the Snake River Watershed lakes suggest that lakes within the Snake River Watershed have a similar amount of riparian shoreline disturbance on average to lakes that have been surveyed statewide, although lakes surveyed statewide were not selected at random. The average StS score for lakes within the Snake River Watershed was 72, which is similar to the statewide average of 73 (Table 6. The average scores for developed and undeveloped sites in the Snake River Watershed were 61 and 94, respectively. Developed sites generally scored low and undeveloped sites generally scored high. “Low” StS scores are indicative of disturbed riparian lakeshore habitat with substantial removal of natural ground cover, shrubs, trees, and a lack of emergent and floating vegetation and woody habitat. “High” StS scores are indicative of relatively undisturbed riparian lakeshore habitat (Perleberg et al. 2019; Table 7.). These results, in particular the large difference in score between developed and undeveloped sites, indicate that habitat loss from riparian lakeshore development may be affecting the aquatic habitat for fishes. Another measure of shoreline disturbance, dock density (based on Google imagery from 2015-2019), can also be used to evaluate the level of disturbance occurring along the shoreline of a lake. Dock densities exceeding approximately 16 docks per mile can significantly affect fish communities and habitat (Jacobson et al. 2016; Dustin and Vondracek 2017; MNDNR unpublished data). Of the five lakes in the Snake River Watershed that were assessed for aquatic life use, Knife, Cross, and Pokegama had dock densities exceeding 16 docks per mile (Table 6). Table 7. Interpretation of Score the Shore survey data (From Perleberg et al. 2019). Mean lakewide score Mean shoreland score Mean shoreline score Mean aquatic score Rating 85-100 28-33.3 28-33.3 28-33.3 High 66-84 22-27 22-27 22-27 Moderate 50-65 17-21.5 17-21.5 17-21.5 Low
The permitting system does not capture all vegetation removal and shoreline alterations. Largescale
removal of Curly-leaf Pondweed has been permitted on lakes within the watershed.
A review of non-native species that would have the potential to alter physical habitat, including aquatic
plant community structure, indicates that several species: Common Carp, Curly-leaf Pondweed, and
Eurasian Watermilfoil are present in a subset of lakes within the Snake River Watershed.
A GIS review of the DNR Minnesota inventory of dams indicates that there are approximately 25 dams
and water control structures located within the Snake River Watershed; however, not all water control
structures may be identified or included in this inventory. Minimal quantitative data is available
describing fish habitat conditions prior to engaging in long-term water level management on lakes
within the watershed and the effects of water level management on the FIBI score are unknown.
Therefore, water level management is an inconclusive stressor due to a lack of data from which to draw
conclusions.
A review of the MNDNR Watershed Health Assessment Framework (WHAF) Aquatic Connectivity Index
tool indicates that the potential for aquatic disruption from culverts, bridges, and dams is lower than the
statewide average (MNDNR 2020a). A lower Aquatic Connectivity Index score indicates higher potential
for aquatic disruption, and the Snake River Watershed scores 62 out of a possible 100, whereas the
statewide average is 53. Preliminary data from a MNDNR culvert inventory is also available for culverts
that have been assessed to date. Of the 56 culverts that have been evaluated in the Snake River
Watershed, mostly in the upper portion of the watershed, approximately 30 % create a possible barrier
to fish passage at some flows due to their size, function, or design (MNDNR 2019).
A review of sedimentation data indicates that measures such as total suspended solids or substrate
embeddedness are lacking for most lakes within the Snake River Watershed. Although sedimentation
may contribute to lower than expected FIBI scores for certain lakes, the lack of high quality quantitative
data and scientific research on the topic makes it challenging to draw conclusions for lakes within the
watershed.
Given the shoreline development and other factors affecting physical habitat, physical habitat
alterations will be evaluated as a potential stressor within the Snake River Watershed in Section 4.

Altered interspecific competition
A review of MNDNR survey data indicates that the Snake River Watershed is affected by non-native
species that can directly compete with native fish species for resources (Table 6). Of the five FIBI
assessed lakes, Common Carp were sampled in four lakes, including Pokegama Lake. Common Carp
have the potential to directly compete with native fishes, as well as affect vegetated habitat by
disrupting substrates and vegetation.
A review of gamefish management activities indicates that stocking and harvest regulations occur in
lakes within the Snake River Watershed. While some gamefish management activities can result in
changes to the fish community of a lake, in general, there is an overall lack of conclusive evidence linking
these changes to FIBI scores. Fisheries managers determine stocking levels with ecological
considerations and game fish are stocked at rates to increase opportunities for game fish harvest at a
sustainable level. Altered interspecific competition is considered inconclusive as a potential stressor to
the fish communities in the watershed and will be discussed further in Section 4.

Snake River Watershed Stressor Identification Report – Lakes • February 2021 Minnesota Department of Natural Resources

                                                                  12
3.2. Eliminated causes
Pesticide application
According to a USEPA report by Atwood and Paisley-Jones (2017), farmers in the United States account
for 20% of global pesticide use. In 2017, the most commonly sold pesticides to Minnesota agricultural
producers, ranked by weight, were glyphosate (herbicide), acetochlor (herbicide), metam sodium
(fungicide), metolachlor (herbicide), atrazine (herbicide), and chlorpyrifos (insecticide; MDA 2020);
however, these estimates do not include pesticide seed treatments. Seed treatments have recently
become widely adopted, with a majority of row crop seeds treated with pesticides such as
neonicotinoids prior to planting. Neonicotinoids, broad-spectrum systemic insecticides, are the fastest
growing class of insecticides worldwide and are now registered for use on hundreds of field crops in
over 120 different countries (Morrissey et al. 2015; Douglas and Tooker 2015). Coating seeds with
insecticide as a method of pest management poses a particular risk to aquatic environments as most
seed-applied neonicotinoids (80–98%) fail to enter treated plants and instead dissolve into soil water
(Goulson 2014).
Pesticides can affect fish communities through several pathways. Direct effects to fish include nervous,
metabolic, and endocrine system disruptions, as well as negative effects to ontogenetic development
(Köhler and Triebskorn 2013). Chlorpyrifos, a commonly used insecticide, has been found to be highly
toxic to fish (e.g., Bluegill Sunfish LC50 = 1.8 ppb) and aquatic invertebrates (e.g., Daphnia LC50 = 0.1 ppb)
on an acute basis (Corbin and Flaherty 2009). Aquatic invertebrates, often more sensitive to agricultural
pesticides than their terrestrial relatives (Krupke and Tooker 2020), mediate indirect negative effects on
fish abundances and community structure (Yamamuro et al. 2019). For example, Yamamuro et al. (2019)
observed a 91% reduction in average annual yields of Rainbow Smelt in a freshwater lake within a
primarily agricultural watershed and attributed the reduction to neonicotinoid pesticide contamination
resulting in a lack of invertebrate prey. As many waterbodies in Minnesota share similar agricultural
watershed characteristics, it is plausible that pesticides are negatively affecting FIBI scores either
through direct or indirect means in some cases. Indirect impacts are common with pesticide application,
and often unrelated to the toxicity on the species ultimately affected. The indirect pathway by which
pesticides can reduce the abundance of prey available for insectivorous fishes is a critical consideration
for maintaining healthy aquatic ecosystems composed of appropriately balanced native fish
communities, and is likely of greater concern than the direct effects to the fishes themselves.
A summary of monitoring data from the 2017 National Lakes Assessment (NLA) summarized pesticide
levels detected in lakes statewide with no pesticides detected in far northern Minnesota lakes, and
increasing numbers of pesticides detected in central and southern Minnesota, with a significantly higher
number of pesticides and concentration of pesticides detected with higher amount of cropland (MDA
2019).
Pesticide application is unlikely to be occurring at a level that would contribute to impaired fish
communities in the lakes in the watershed. The following three pieces of information were used to
conclude that pesticide application as an unlikely stressor to FIBI impairments in lakes in the Snake River
Watershed. Only about 10% of the land use in the Snake River Watershed is categorized as cultivated
agricultural land (MNDNR 2020d). A review of Minnesota Department of Agriculture (MDA) incident
reports indicated only one small spill and a few old emergency incidences within the watershed (MDA
2021a). And, there are no impairments in Minnesota Department of Agriculture (MDA) stations in and
near the watershed (MDA 2021b).
Snake River Watershed Stressor Identification Report – Lakes • February 2021 Minnesota Department of Natural Resources
13Temperature regime changes
A review of research (MNDNR 2020c) indicates that mean air temperatures within the Snake River
Watershed have increased by an average of 0.26°F per decade from 1895 – 2020. Increases in lake-
specific air temperature have been shown to be correlated with increases in water temperature
(Robertson and Ragotzkie 1990). Although modeling evidence suggests that water temperature has
increased in lakes within the Snake River Watershed, limited research is available to demonstrate the
magnitude of change needed to result in changes to the fish community as indicated by the FIBI.
Further, none of the lakes assessed with the FIBI were assessed as deep lakes (lakes >40 feet) supporting
cold water fisheries and therefore temperature regime changes is eliminated as a candidate cause for
impairment.
Decreased dissolved oxygen
Data regarding DO concentrations in lakes is generally limited to discrete profiles collected during
periodic MPCA and MNDNR surveys or is provided as anecdotal information when related to summer or
winterkill events. As such, limited information exists to indicate whether DO concentrations are
changing in a manner that might result in changes to fish communities in the Snake River Watershed.
Knife, Ann, and Fish Lakes are shallow lakes and very susceptible to wind mixing events. Cross and
Pokegama are deeper lakes but have a long fetch making them apt to periodic mixing and likely to not
have a strong oxycline. Further, because the lakes assessed with the FIBI are not expected to support
cold water species based on their morphometry, decreased dissolved oxygen will not be discussed
further and is eliminated as a candidate cause.
Increased ionic strength
A review of MPCA’s Impaired Waters List indicates that no lakes within the Snake River Watershed were
assessed as impaired for aquatic life use based on the chronic standard for chloride (MPCA 2020a).
Chloride concentrations that are toxic to fish and other aquatic organisms would need to exceed the
aquatic life use standards. Therefore, standards and actions intended to address chloride impairments
should provide adequate protection to eliminate chloride as a likely candidate cause for impaired fish
communities.
Metal contamination
A review of MPCA’s Impaired Waters List indicates that the Snake River Watershed contains lakes that
have been identified as impaired for aquatic consumption based on mercury levels; however, MPCA and
local partners have developed a statewide mercury reduction plan approved by the EPA to address
these impairments (MPCA 2007). Mercury concentrations that are toxic to fish and other aquatic
organisms would need to far exceed the aquatic consumption standards. Therefore, standards and
actions intended to address aquatic consumption impairment should provide adequate protection to
eliminate mercury as a likely candidate cause for impaired fish communities.
Snake River Watershed Stressor Identification Report – Lakes • February 2021 Minnesota Department of Natural Resources
14Unspecified toxic chemical contamination
A review of publicly accessible MPCA data indicated that most properties that generate hazardous waste
were located around population centers (Mora, Pine City, Brook Park) including stores, gas stations,
dumps, etc. Given their locations, they are not unlikely to be a significant stressor to fish communities in
lakes within the watershed (MPCA 2020b).
4. Evaluation of candidate causes in Pokegama
Lake (58-0142-00)
While all of the lakes within the Snake River Watershed are undoubtedly impacted by land use within
their watersheds and on their shorelines, section 4 of this report will focus on evaluating the causes of
stress to the fish community in Pokegama Lake, which was assessed as not supporting aquatic life use.
All FIBI scores for Pokegama Lake were below the impairment threshold for similar lakes (Table 4).
Pokegama Lake is about 1,521 acres, with a maximum depth of 25 feet, and a littoral zone covering
about 59% of the lake area. These characteristics put it into a group scored with FIBI Tool 2. Lakes
scored with this tool are characterized as generally deep with complex shorelines (i.e., presence of bays,
points, and islands), less than 80% littoral area, and high species richness (Table 1).
Eutrophication and physical habitat alteration have been identified as likely stressors to aquatic life use
in Pokegama Lake and will be evaluated further. Altered interspecific competition and pesticide
application have been identified as inconclusive stressors. A description of available data and current
understanding of levels believed to affect fish communities is discussed in this report and summarized in
Figure 4.
Biological community in Pokegama Lake
The biological integrity of the fish community in Pokegama Lake was evaluated using trap net, gill net,
seining, and backpack electrofishing surveys. Survey data from 2014, 2018, and 2019 was used for
assessment, with supporting information from an older survey completed in 2008. The two FIBI scores
reported for assessment are generated from a survey conducted in June and July 2014 which included
all components (gill net, trap net, seining, and backpack electrofishing), and a July 2018 gill net and trap
net survey paired with a seining and backpack electrofishing survey in June 2019.
The FIBI uses fish community data to measure a lake’s health, and the types of fish species present can
help identify any stressors that may be negatively affecting the lake environment. The FIBI score,
composed of fifteen fish community diversity and composition metrics for tool 2 lakes (Table 1),
indicates the overall health of a lake by comparing it to what is expected for a healthy lake. The FIBI
scores are 35 and 33 from 2014 and 2018/2019, respectively, which are both below the impairment
threshold (45) and below the 90% confidence interval for Tool 2 FIBI scores (36-54). The score from the
2008 survey is similar (31; Table 3).
Twenty-five native fish species were sampled in Pokegama Lake in 2014, including many riverine species,
because of its open connection with the Snake River. The overall FIBI score is most negatively impacted
by the high biomass of tolerant species (Common Carp and Bigmouth Buffalo) in the trap net survey and
Snake River Watershed Stressor Identification Report – Lakes • February 2021 Minnesota Department of Natural Resources
15a relatively low richness of intolerant, cyprinid, small benthic, and vegetation dwelling species as
indicated by the respective FIBI metric scores. Channel Catfish were most abundant by biomass in the
gill nets (47% of the biomass). Freshwater Drum and Common Carp dominated the biomass in the trap
net survey, accounting for 32% and 21% of the biomass respectively. The nearshore survey catches
were light, and were comprised primarily of Yellow Perch (41%) and Bluegill (35%).
The 2018/2019 survey sampled a similar number of species, with 27 native species, and metric scores
were similar to 2014. The overall FIBI score is most negatively impacted by the high biomass of tolerant
species (Common Carp) in the trap net survey and a relatively low richness of intolerant, cyprinid, and
vegetation dwelling species, and a relatively high number of tolerant species sampled. Channel Catfish
were most abundant by biomass in the gill nets (63% of the biomass). Common Carp and Freshwater
Drum dominated the biomass in the trap net survey with Common Carp accounting for 35% of the
biomass and Freshwater Drum 21%. The nearshore survey sampled 16 species, with Yellow Perch (66%)
and Bluegill (18%) again most commonly sampled, followed by Black Crappie (18%) and Johnny Darter
(4%).
Because this is the first time utilizing the FIBI protocols in the lake assessment process, historical surveys
of similar rigor are unavailable to facilitate comparison of fish species assemblages through time, and to
examine changes in the fish community related to changing lake conditions. However, historic data
indicates that several additional species have been sampled in Pokegama Lake, including Brook
Silverside (in 1995), Brown Bullhead (in several surveys, most recently in 2005), Greater Redhorse (in
2000), and Spottail Shiner (1995, 2000) but these species have not been observed in MNDNR surveys
since that time (MNDNR 2020b). These historically sampled species may be represented by only one or
two occurrences and identification confirmation cannot occur due to the lack of vouchered specimens.
Note that Smallmouth Bass were not sampled in the FIBI gears, but were sampled in a separate
nighttime electrofishing survey in May 2018. In addition, several species classified as intolerant of
eutrophication and shoreline disturbance, including Blacknose Shiner, Iowa Darter, and Mimic Shiner
have been sampled in other portions of the Snake River Watershed, and are common in other similar
lakes in the major basin, but are absent from Pokegama Lake (Table 5).
Data analysis/Evaluation for each candidate and inconclusive cause
Eutrophication, Candidate Cause
Eutrophication is likely occurring at a level that would contribute to an impaired fish community in
Pokegama Lake based on review of relevant water quality and watershed disturbance information.
Pokegama Lake is listed as impaired for aquatic recreation based on high nutrient levels, and has had a
history of water quality problems for decades or longer. Dense algae blooms were reported by Moyle in
1937 and Woodward and Olson in 1929 (MNDNR 2007).
Recent water quality data collected and summarized by MPCA indicates that mean TP is 94 ppb (N=22),
chlorophyll-a is 38.4 ppb (N=23), and Secchi transparency is 0.9 meters (N=108) in Pokegama Lake. A
TMDL reported on sources of nutrients to Pokegama Lake (see MPCA 2013). These parameters indicate
that the lake is receiving inputs of excess nutrients that could negatively affect the fish community.
Of the approximately 52,000 acres within the contributing watershed, 35% is classified as unnatural land
cover (i.e., 31% agricultural and 4% developed). The percentage of unnatural land cover is approaching a
Snake River Watershed Stressor Identification Report – Lakes • February 2021 Minnesota Department of Natural Resources
16threshold identified by MNDNR Fisheries Research that often results in significantly elevated TP levels in
Minnesota Lakes, especially in shallow lakes with agricultural land use (Cross and Jacobson 2013).
Additionally, the quantity of land within the contributing watershed is high relative to the size of
Pokegama Lake, as indicated by a watershed-to-lake ratio of 34:1. The combination of a large
contributing watershed and the moderate percentage of unnatural land cover can contribute large
inputs of nutrients into associated lakes and waterways. Approximately 6% of the agricultural land
within Pokegama Lake’s contributing watershed is cultivated whereas 25% is hay and pasture land.
Additionally, 16 feedlots are located within the contributing watershed (MPCA 2020c). Surface runoff
from agricultural land and feedlots can contribute excess nutrients into the lake if not properly
managed. The Snake River Watershed TMDL identified watershed drainage sources as contributing 57%
of the annual phosphorus budget for Pokegama Lake (MPCA 2013). Pokegama Creek which flows into
Pokegama Lake is also impaired for aquatic life use.
While the shoreland owners on Pokegama Lake are connected to a city sewer, there are an unknown
number of individual subsurface sewage treatment systems (SSTS) on parcels within the contributing
watershed to the lake. However, failing SSTS were estimated to only contribute 2% of the annual total
phosphorus budget for Pokegama Lake (MPCA 2013). There is a waste water treatment plant discharge
downstream of Pokegama Lake therefore potential associated nutrients do not impact the lake.
Internal loading of phosphorus from lake sediments can also be a significant contributor to
eutrophication on lakes. Internal loading was identified in the Snake River Watershed TMDL as a
significant source of nutrients to Pokegama Lake, with 40% of the annual phosphorus budget attributed
to internal loading (MPCA 2013). Common Carp are known to modify the structure and function of
aquatic ecosystems (Huser et al. 2017). Carp dig in the bottom sediment with their mouths while
searching for food, re-suspending sediment, increasing water turbidity, and uprooting aquatic plants. At
great enough densities, Common Carp play a significant role in nitrogen and phosphorus transport from
sediment to the water column as a result of both physical sediment disturbance and excretion. With the
littoral zone of Pokegama Lake covering over half of the lake area, large Common Carp populations
could intensify the effects of eutrophication. However, carp populations are not large originators of
excess nutrients, but rather function as agents for nutrient re-suspension.
Residentially developed land within the contributing watershed is predominantly located along the
shoreline of Pokegama Lake and in the small town of Brook Park. As discussed in the next section,
shoreline development practices observed on Pokegama Lake during a survey of the shoreline
documented substantial vegetation clearing in the shoreland and shoreline zones. Runoff from
shoreline development and practices could be contributing excess nutrients into the lake.
Although a high percentage of land is classified as unnatural, undeveloped land includes numerous
wetland and water features, privately owned forested land, and several WMAs and a portion of a state
forest are present within the contributing watershed. Undeveloped lands, particularly parcels in public
ownership that are protected from future development, play a critical role in collecting and filtering
rainfall, recharging the groundwater supply, and reducing surface runoff that could otherwise be
contributing sediment and nutrients into lakes and rivers.
Physical habitat alteration, Candidate Cause
Physical habitat alteration is likely occurring at a level that would contribute to an impaired fish
community in Pokegama Lake based on review of information reflecting riparian lakeshore
Snake River Watershed Stressor Identification Report – Lakes • February 2021 Minnesota Department of Natural Resources
17You can also read