Soil health assessment guide - NIAB
←
→
Page content transcription
If your browser does not render page correctly, please read the page content below
Soil health assessment guide
Introduction                                           3

Importance of good soil management                     4

What is soil?                                          5

Indicators of soil health                              6

Sampling for soil health                               7

Soil texture – the skeleton of the soil                9

Assessing soil texture                                 10

Soil structure and physical condition                  11
Field measure – visual evaluation of soil
                                                       12
structure (VESS)
Field measure – soil compactness                       13

Field measure - earthworms                             14

Soil sample analysis – organic matter                  15

Soil sample analysis – soil pH                         16

Soil sample analysis – soil nutrients                  17

Case study                                             18

Further information                                    19

Designed and produced by NIAB in association with CISL and ASDA.
While every care has been taken in the preparation of the advice contained in this booklet, NIAB cannot
accept responsibility for any loss or inconvenience arising from following the information herein.
© 2020 All information provided by NIAB is protected under copyright and is not to be reproduced in
any form or distributed to other parties without prior written permission of NIAB.
NIAB is a charitable company limited by guarantee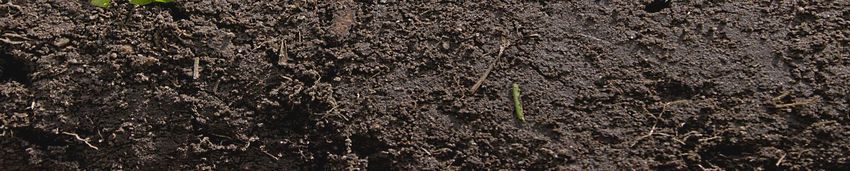
To understand the soil environment and then manage
it more effectively it is important to determine how
well the soil is performing all of its functions and how
those functions can be maintained. It is recognised
that physical, chemical and biological aspects of the
soil interact to determine overall soil health and
therefore it is important to include measures of all
these aspects. Some measures can be made directly in
the field; other characteristics are measured by
sending away samples for analysis, but it is important
to take an integrated approach to assessment to get a
good picture of soil health.
As a grower a key objective is to maximise crop
production in the present whilst ensuring a
sustainable future. To achieve this it is helpful to
remember that nearly all soils processes are powered
by living organisms and the aim of soil management is
to maintain the soil environment and keep this soil-
crop ecosystem running smoothly. Soil health is
therefore the continued capacity of soil to function as
a vital living ecosystem that sustains plants, animals,
and humans.
To help in this process NIAB has been working with
University of Cambridge Institute for Sustainability
Leadership (CISL) and ASDA to provide guidance on
how assessments of soil health indicators can be
made most effectively on-farm.
The importance of good soil management has gained recognition and priority amongst businesses in
the food and farming supply chain including retailers.

Important soil functions related to crop
production and environmental quality include:
  Retaining and cycling nutrients and supporting
  plant growth
  Sequestering carbon
  Allowing infiltration, and facilitate storage and        Why assess soil health?
  filtration of water
  Suppressing pests, diseases, and weeds                 • Increase awareness of soil health
  Detoxifying harmful chemicals                          • Understand constraints beyond
                                                           nutrient deficiencies and excesses
  Supporting the production of food, feed, fibre
  and fuel                                               • Target management practices to
                                                           alleviate soil constraints
When the soil is not functioning to its full
capacity, sustainable productivity, environmental        • Monitor soil improvement or
quality, and net farmer profits are jeopardised            degradation resulting from
over the long term.                                        management practices
The economic benefits of maintaining and                 • Facilitate applied research –
improving soil health include:                             compare management practices to
                                                           develop recommendations for farm
  Better plant growth, quality, and yield                  and field specific soil health
  Reduced risk of yield loss during periods of             management planning
  environmental stress (e.g. heavy rain, drought,        • Land valuation – facilitate the
  pest or disease outbreak)                                realisation of equity embodied in
  Better field access during wet periods                   healthier soils
  Reduced fuel costs by requiring less tillage           • Enable assessment of farming
                                                           system risk
  Reduced input costs by decreasing losses and
  improving use efficiency of fertiliser, pesticide,
  herbicide and irrigation applications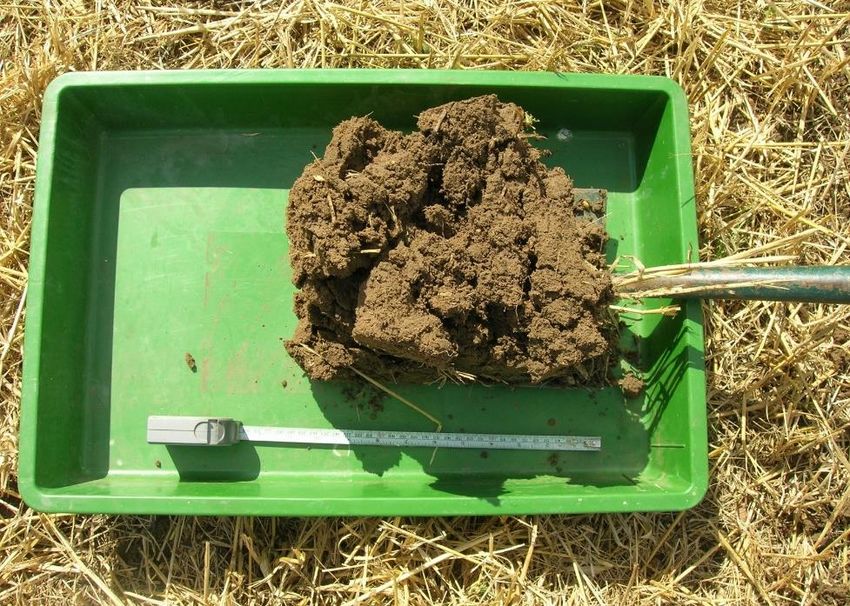
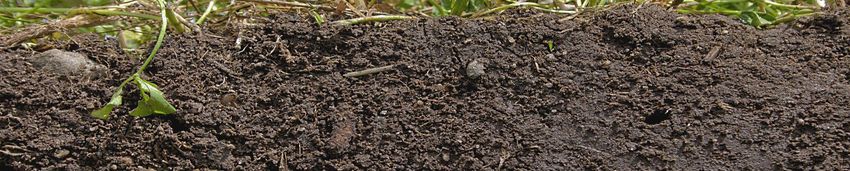
Soil is a mixture of minerals, dead and living organisms (organic materials), air, and water in varying
 proportions and these four ingredients interact with one another in amazing ways, making soil one
 of our planet’s most dynamic and important natural resources.
 A healthy soil is defined as one that has a resilient capacity to respond to (agricultural) intervention,
 such that it supports the provision of ecosystem services (e.g. clean air and water, abundant
 biodiversity) as well as optimising agricultural production.

 Healthy soil is….

                                             Soil pore                                      Soil solids
                                             spaces

                                                             25% Air

                                                                                45% Mineral

                                                          25% Water

                                                                                5% Organic matter

Knowing what soil is made of is only part of the story. The way the soil constituents are organised
(structure) has a key influence on how they interact with one another to control soil processes.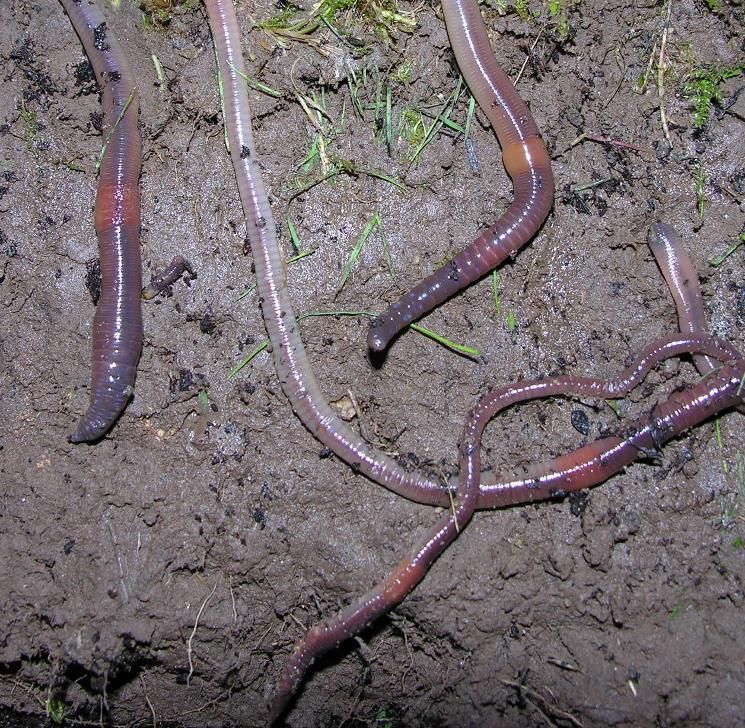
There are many indicators available that provide clues about how well the soil can function. The
indicators can have physical, chemical and biological properties or be indicators of overall function
such as crop yield or amounts of soil erosion. But soil health cannot be determined by only measuring
crop yield, water quality, or any other single outcome.
There are a whole range of measures that can be used. NIAB has screened possible indicators to
identify a set of procedures that are relatively easy and cost effective to measure, clearly linked to
changes in soil functions and are sensitive to variations in climate and management. These are not the
only indicators available and NIAB recommend this set as a useful minimum baseline for soil health.
After measurements are collected, the data can be evaluated by looking for patterns and comparing
results to measurements taken at a different time or in a field with the same soil type but different
management approach.

                         Physical                                   Chemical
                                                      Nitrogen(N)
                         Compaction                   Mineralised N (N-min)
                                                      Ammonium (NH4+)       Micro nutrients
                            Erosion                   Nitrate (N03-)            Iron (Fe)
                       Water-logging                  Macronutrients          Copper (Cu)
                         Bulk density                 Phosphorus (P),          Boron (B),
                    Soil structure (VESS)             Potassium (K),       Manganese (Mn) etc.
                  Penetrometer resistance             Magnesium (Mg)
                                                                  Cation exchange capacity
                                                                  Electrical conductivity
                                                                  Salinity
                                                                  pH

                                             Biological
                                    Respiration (solvita test, NRM)
                                 Number and diversity of mycorrhiza
                                 Number and diversity of earthworms
                                Diversity of macro and microorganisms
                                          Soil organic matter
                                          Microbial profiling
                                           Enzymatic activity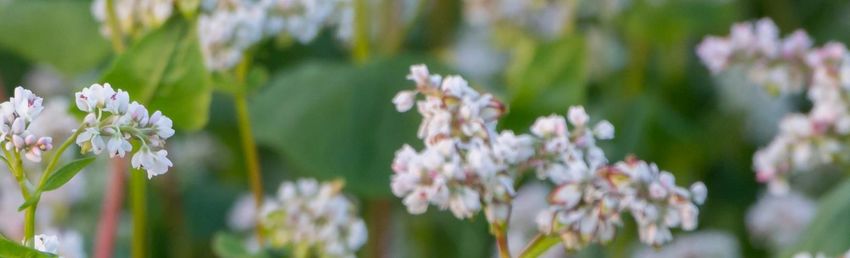
A soil health assessment analysis is only as good as the
         observations and samples that have contributed to it.
Choosing representative sampling sites
As for all soil sampling, the area selected should be relatively uniform.
•   Avoid headlands, gateways, unless you are specifically targeting them as a sampling site, and
    also avoid marked wheelings where possible.
•   Ensure soil texture and cropping history show limited variation. There may be just one sample
    site per group of fields, or there may need to be several per field, where soil texture varies
    markedly.

Choose sites where the data will best inform farm practice in soil management.
You can use a yield map and soil
scanning data (if available) to identify
possible sample sites. Here sample sites                                                    Yield (t/ha)
have been selected within areas that
                                                                                                 3.5 – 5.5
have shown low (L), medium (M) and
high (H) yields of winter wheat to                                                               5.5 – 7.5
investigate why these patterns are                                                               7.5 – 8.5
occurring.                                                                  M                    8.5 – 9.5
                                                                                                9.5 – 10.5
Sampling timing
                                                                                                10.5 – 11.5
Soil observation and sampling should
take place at a time when soil is moist
                                                                            H                   11.5 – 12.5
                                                                                                  12.5+
and at least one month after any
cultivations / moderate soil
disturbance. Ideally the sample should
not be taken within three months of
application of organic inputs.                                                        M
Regular sampling for soil health
monitoring is expected to take place
once per rotation and at the same point
in the rotation to maximise
comparability between samples. You                                                      L
should choose the point in the rotation
to integrate soil health
assessment which will allow you to fit in
the assessment most effectively and
then act on the results.                                                        Data courtesy of Morley Farms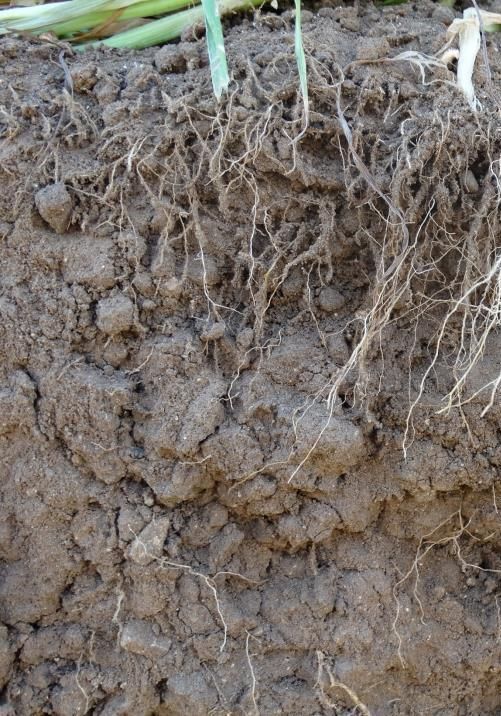
Locate the sampling site. The site is a circle of c. 5 m
radius. You may want to record the centre point Kit contents checklist:
accurately so you can come back to it easily; many
mobile phone apps can do this! Spade
You are combining measures of soil physical Marker pen
condition (VESS, penetrometer) and soil biology Plastic bags
(earthworms) made at three locations with
measures assessed on samples collected and sent to
Sample containers
the laboratory for more detailed analysis. Penetrometer
Each soil sample should be a composite of 10-15
sub-samples taken across the site using a random
pattern. The distance between sub-samples should
be at least 1.5 m. What to do…….
Penetrometer readings can also be taken which Steps for taking a soil sample at each
measures resistance in the soil in pounds per square location
inch (PSI) giving an indicator of soil compaction and
1. Remove surface debris
therefore soil health.
2. Use a spade to dig a small hole about
20 cm deep.
3. From the side of the hole take a
Sampling site within field vertical, rectangular slice of soil 15 cm
deep and about 5 cm thick.
4. Place the sub-sample into a clean
plastic bag or container.
5. Repeat steps 1 to 4 for each site
bulking the samples together.
5m 6. Take a sample (about 300 g) and place
into a clearly labelled sample bag. This
is the soil sample for the field or part
of field.
7. At each of the sub-sample locations,
you could also collect soil hardness
information with a penetrometer, if
the soil is at / close to field capacity.
Record the maximum hardness (in psi)
from the 0 to 15 cm and at the 15 to
45 cm depth ranges.
Spade assessment of soil structure
Ideally use a laboratory for soil analysis
that is a member of the Professional
Randomly located multiple cores (use Agricultural Analysis Group (PAAG)
numbers advised) consolidated into
sample sent for analysis
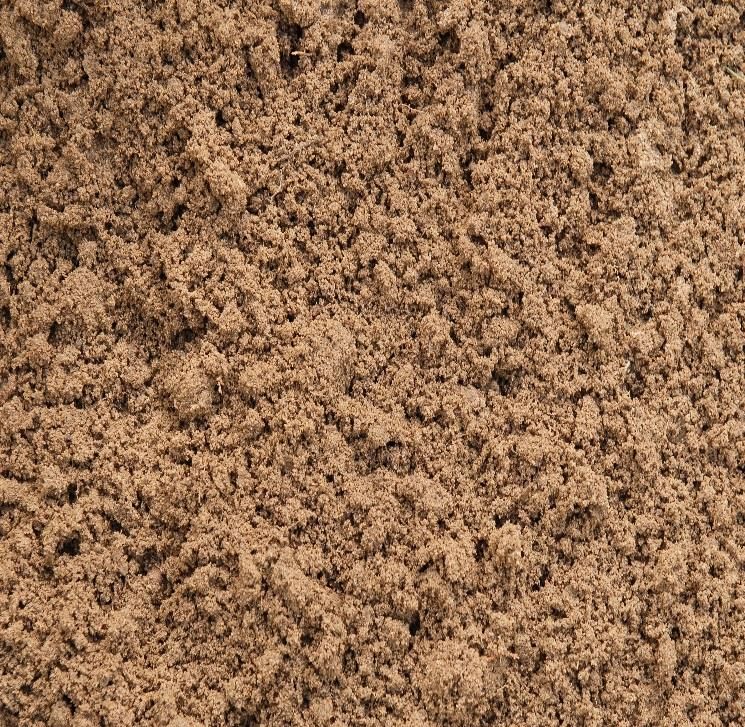
Relative size of soil particles                           Soil texture can have a major effect on many
                                                          other properties and is one of the
                                                          fundamental characteristics of the soil. Soil
                                                          texture is not a soil health indicator per se,
                                                          but a knowledge of soil texture is needed to
                                                          interpret most soil health indicators.
     Coarse sand        Medium sand        Silt           In most soils, the majority of the solids
                                                          materials are minerals inherited from the soil
                                                          parent material. Mineral particles are
                           Fine sand       Clay           defined by their sizes (gravel, sand, silt and
                                                          clay). They also differ in how they influence
                                                          soil functioning beyond size-related effects.
                                                          The relative proportions of sand, silt and clay
                                                          determine a soils texture and textural class.

Soil pyramid for determining soil textural class
                                                                          Sandy and light silty soils
                                                                          Medium soils
                                                                          Heavy soils

                                                             Sandy and light silty soil 0-18% clay

                                                             Medium soil                 19-35% clay

                                                             Heavy soil                  >35% clay

                                                             Shallow soil over chalk/
                                                                                      20% organic
                                                             Peaty soil
                                                                                         matter

Impact of clay on soil chemical properties
The amount of clay can greatly influence the ability of the soil to hold and exchange nutrients, and
store organic matter. Clays have a lot of surface area (because they are very small and layered
particles) and the surfaces are negatively charged, so that positively charged nutrient ions can ‘stick’
to them. This ability of soil particles to hold onto nutrient ions and exchange them with the soil
water, or soil solution, is referred to as the soil’s cation exchange capacity (CEC ).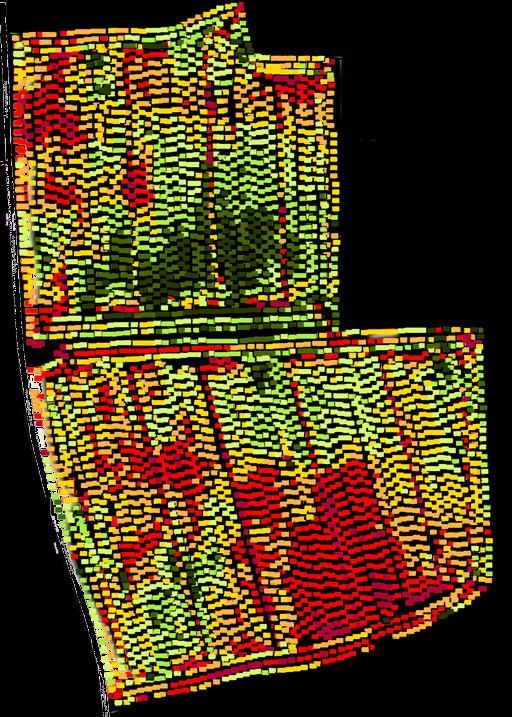
What to do……
Soil texture can be determined by taking about a dessert spoonful of soil in your hand and working
between your fingers and thumb to break down any clumps or aggregates, removing any obvious
stones and plant debris. If the sample is too dry you will need to wet it gradually with water until it
is wet enough to hold together and determine if the sample is sticky. Then work through the flow
diagram below to determine your soil type.

 Moisten a dessert spoonful of soil gradually, kneading                       Sandy and light silty soils
 thoroughly, until soft crumbs are broken down.
                                                                              Medium soils
 Is the moist soil predominantly rough and gritty?
                                                                              Heavy soils

                                                   Does soil mould to form an
                 Yes                No            easily deformed ball and feel         Yes        Silt loam
                                                   smooth and silky (butter)?

                                                               No                      Clay
          Does soil stain
            fingers?                                                                  loam

                                                   Does soil mould to form a
                                                   strong ball which smears,           Yes      Also smooth
         Yes            No          Sand                                                        and buttery?
                                                  but does not take a polish?

                                                               No             Also rough and         Yes
   Is it difficult it
                        Yes
                                    Loamy
  roll into a ball?                                                               gritty?
                                     Sand
                                                   Soil moulds like plasticine,                   Silty clay
         No                                          polishes and feels very           Yes          loam
                                                        sticky when wet?
  Does soil feel
smooth and silty as          Yes           Yes                 Yes                   Yes         Sandy
  well as gritty?                                                                              clay loam

                         Sandy                          Also rough and        Also smooth
         No
                        silt loam          Clay             gritty?           and buttery?

                                                               Yes                   Yes
      Sandy
       loam
                                                             Sandy
                                                                                  Silty clay
                                                              clay
Texture is the ratio of the three soil particle types (sand, silt, clay). Soil structure describes
the relationship between solids (soil particles and organic matter) and spaces and is determined by
how the soil particles are held together into aggregates (structural units). These units are bound
together by physical chemical and biological processes. The physical characteristics of soil allow water
and air to infiltrate, roots to explore, and biota to thrive.
Most pores in a sandy soil are large
Plant root
(but generally still smaller than 2 mm)
whilst the pores in a clay soil are
Air space small (generally less than 0.002 mm).
Soils with a higher clay content have
Soil particles
a higher proportion of small pores
and so have a greater ability to retain
Pores nutrients and are also able to
stabilise organic matter.
Water Pores in the soil are important in
governing water and air movement
Structural which affects water infiltration,
aggregate permeability, water storage, aeration,
nutrient leaching, and denitrification.
Soil organisms and plant roots live and
function in pore spaces.
Poorer compacted soil layers, caused by cultivations and wheel traffic, are dense with little air
flow. This restricts water movement and inhibits root growth so the growing crop is unable to
access nutrients and water efficiently.
Good crop growth relies on a structure that provides:
Good soil aeration (for respiration)
Drainage
Efficient supply of nutrients and water.
pH balance preventing leaching of nutrients and contamination of water courses
Movement of sodium as excess clogs soil pores trapping water
Decomposing organic matter
Fine roots and fungal hyphae to stabilise aggregates
Soil structure can be improved by adding soil amendments to increase organic matter and
improve the soil ecosystem, making clay more porous and sand more water retentiveWhen to do an assessment
Kit contents checklist:
Sample when the soil is moist – if the soil is
too dry or too wet it can be difficult to Spade
distinguish signs of poor structure. Spring or Plastic tray or mat
autumn are usually the best times of the year. Tape measure or ruler
Don't just do it once VESS score chart
Penetrometer
Compare samples from the soil health
sampling site with areas where you expect
good structure (uniform crop growth) and
from areas where you expect poor structure
(wheeled areas or areas near gates) to allow Whattotodo…….
What do……..
you to see structural differences.
1. Dig out a spadeful of soil to a depth of
about 25 to 30 cm.
• If the soil is freshly dug or recently tilled,
simply push the spade vertically into the
soil and dig out a spadeful.
• In soils with a hard surface or in crop, cut
out a spade-sized block of soil down to
approximately 25-30 cm. Cut down on
three sides and then lever the block out
leaving one side undisturbed.
2. Gently open the undisturbed side of the
block like a book and start to break it up.
• If the block breaks up easily into small
fragments then the structure is likely to
be good.
• If the block is hard to break up and is held
together by roots, pull the roots apart to
expose the soil fragments.
3. Break up the block to determine if there are
any distinct layers of differing structure. If
the block is uniform assess as a whole, if
there are two such layers, then score
separately.
4. Measure the depth and thickness of any
distinct layers
Download a copy of the VESS score chart 5. Break up the soil with your hands into
from sruc.ac.uk aggregates and give a score by matching
what you see to the VESS chart, available
from the link on the left.Field penetration resistance is an
indicator of the soil compaction status. Kit contents checklist:
Compaction occurs when large pores Penetrometer
are packed closer together through
tillage or traffic with heavy equipment,
particularly on wet soils.
It is measured in the field using a
penetrometer pushed through the soil What to do…….
profile at two depth increments (surface
0 – 15 cm and subsurface 15 – 45 cm). 1. Apply slow even pressure so the
penetrometer advances into the
soil at a rate less than 4 cm per
The level of soil moisture can greatly affect the ease the probe second.
penetrates the soil, and therefore the measured values. It is 2. Record the highest pressure
recommended that penetration readings be taken when the reading measured for each of the
soil is friable and near field capacity. If soil conditions are not two depths
ideal, it is important to note conditions at the time so that
proper interpretation of the reading can be made. 3. If you detect a hard layer, make a
note of the depth – this is
important for future
Effects of compaction on soil structure management decisions.
Air 4. Repeat the process at each of the
Air sub-sampling station (see soil
Water Water sampling for chemical analysis)
Solids Solids
Root growth decreases linearly with
increasing penetration resistance,
until stopping above 300 psi
Growth of mycorrhizal fungal hyphae
and mobility of other beneficial soil
organisms may be severely
restricted in compacted soils
High Soil volume Low
Low Bulk density High Compaction reduces crop growth,
More and Fewer and increases weed pressure and makes
Pore space crops more susceptible to pathogens
larger smaller
Low Soil strength HighWhy are earthworms important? Kit contents checklist:
Earthworms: Spade
Help break down organic matter Large tray or mat
Mix materials in the soil profile Container or pot for
Alleviate compaction
Help form soil aggregates
temporarily storing
Develop soil pores and channels which help earthworms
drainage aeration and root growth. Bottle of water
Why count earthworms?
Earthworms are excellent indicators of soil What to do…….
health as they tend to be both easily visible and
sensitive to management being affected by Steps for counting earthworms at each
changes in pH, waterlogging, compaction, tillage, location
crop rotation and organic matter management. 1. Dig a soil pit (20 cm x 20 cm x 20 cm)
There are three different groups of earthworm and place soil in the large tray or on a
mat. You can use the VESS block or
0 cm
one collected alongside.
Epigeic species: surface
2. Sort through the soil by hand putting
dwellers living in the leaf
each whole earthworm into the pot
litter. They are brownish red
3. Make a note of:
in colour and small, generally
1. Total number of earthworms in
2 to 6 cm long
the sample
2. The number of adults and
Endogeic species: shallow juveniles
burrowing species living in 3. The number of each type of
horizontal burrows in the adult worm present
topsoil (between 5 to 40 cm 4. Return all of the earthworms to the pit
deep). These worms are pale 5. Repeat steps 1 to 4 for at least three
in colour, can be up to 18 cm pits. For a detailed study of
long earthworms at least 10 pits are
needed
Anectic species: vertical
burrowing species that can be What to look for
found up to 4m below the soil
Adult earthworms differ from juveniles
surface. Adults are usually
in that they have a saddle…..
between 15 and 45 cm long
and are a reddish- brown Tail Head
colour with darker heads
Saddle
20 cm
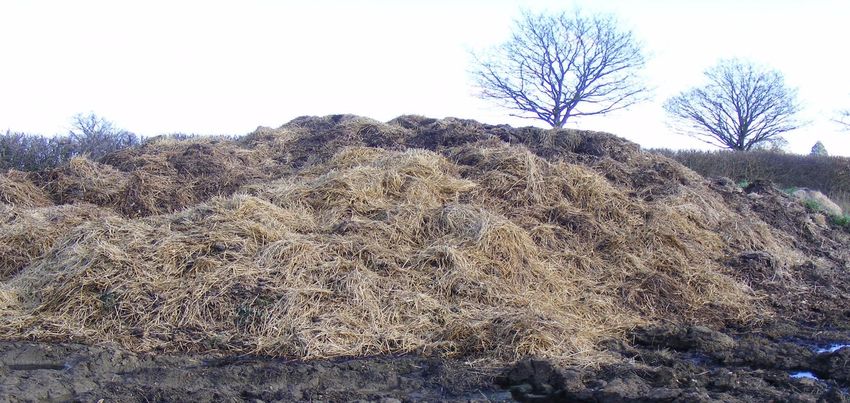
Further information can be found on the AHDB how to count earthworms leafletOrganic matter:
Plays a vital role in soil structure, improving soil aeration, water retention and drainage
Consists of both living and dead plant and animal tissue providing a fertile and healthy environment
for the development of healthy plants
Has many negative charges which improves the cation exchange capacity of the soil. This enables
the soil to hold on to nutrients which makes available to the crop and prevents them from leaching
deep into the subsoil
Organic matter content is often provided by soil analysis laboratories along with major and minor
nutrient contents and is a measure of carbon-containing material.
Physical benefits
Enhances aggregate stability, improving water infiltration The organic matter content of
and soil aeration, reducing runoff agricultural topsoil is usually in the
range of 1–6%
Improves water holding capacity
Reduces the stickiness of clay soils making them easier
to till Organic matter contains a large
Reduces surface crusting, facilitating seedbed amount of carbon-based
preparation compounds. The largest
component of organic matter is
dead matter. In soils, dead matter
Chemical benefits makes up roughly 85% of the
organic matter.
Increases soil CEC or its ability to hold onto and supply
essential nutrients such as calcium, magnesium and
potassium Organic matter includes dead
matter, living microbes, and living
Improves buffering capacity, the ability of a soil to resist parts of plants (e.g. roots).
pH change
Accelerates decomposition of soil minerals, making the
nutrients in the minerals available for plant uptake
Compounds like sugars, starches,
and proteins are relatively easy to
Biological benefits break down, and do not take as
much time. Fungi and bacteria in
the soil can break down these
Provides food for the living organisms in the soil compounds making the energy
Enhances soil microbial biodiversity and activity that can they provide readily available.
help in the suppression of diseases and pests However, some compounds like
cellulose can take much longer to
Enhances pore space through the actions of soil
be broken down, on the order of
microorganisms. Helping to increase infiltration and
10 to 1,000 years.
reduce runoffSoil pH is a measure of how acidic the soil is and is an important indicator of soil health. It affects
crop yields, crop suitability, plant nutrient availability and soil micro-organism activity which
influence key soil processes.
4 5 6 7 8 9 10
pH Truog, E. (1946) Soi l Science Soc. Am. Proc. 11, 305-308
The availability of some plant nutrients is greatly affected by soil
pH. The “ideal” soil pH is close to neutral, and neutral soils are The pH scale goes from 0 to
considered to fall within a range from a slightly acidic pH of 6.5 14 (with a neutral pH
to slightly alkaline pH of 7.5. Most plant nutrients are optimally represented by 7.0). Most
agricultural soils have pH
available to plants within this pH range, and is generally very
values between 5.5 and 7.5
compatible to plant root growth.
If pH is too high, nutrients If the pH is too low, The pH scale is logarithmic;
such as phosphorus, iron, calcium, magnesium, a pH of 5 is ten times more
manganese, copper and phosphorus, potassium acidic than a pH of 6 and
boron become unavailable and molybdenum become 100 times more than pH7
to the crop. unavailable to the crop
A soil pH that is too high or too low may also
Soils with high clay and
cause a decline in microbial activity, decrease
organic matter content are
in crop yield, and a deterioration of soil health. more able to resist a drop
or rise in pH (have a greater
buffering capacity) than
Soil pH can be managed by measures such as applying the sandy soils
proper amount of nitrogen fertiliser, liming, and cropping
practices that improve soil organic matter and overall soil
health.
Increasing organic matter content of the soil can improve soil
buffering capacity to limit changes in pH.Crops do not grow properly if nutrients are not present at the right time of the season, in sufficient
quantities and in balance with one another. When plants do not grow well they are more susceptible
to disease, loss of yield, and poor crop quality which leads to reduced economic returns.
Excessive nutrient application may also create problems that lead to poor plant growth or to
environmental degradation. These concerns have resulted in more emphasis on better management
of N and P as their excessive use contributes to surface and groundwater degradation and to
greenhouse gas emissions.
Soil nutrient analyses are based solely on chemical extraction and are used to recommend the type
and quantity of nutrients to add through amendments, as well as whether soil pH needs to be
adjusted for improved nutrient availability.
Alongside measuring soil acidity (pH) the standard soil analysis undertaken by a laboratory estimates
the plant-available concentrations of the major nutrients, phosphorus (P), potassium (K) and
magnesium (Mg).
Plant nutrients are essential for
crop development if:
• The plant cannot complete its
Uptake of plant nutrients life-cycle without it
• The function cannot be
replaced by another chemical
Each nutrient is taken up in an “ionic” or • Directly involved in growth and
charged form reproduction
Knowing the form the plant absorbs
nutrients helps understanding what controls Macronutrients are elements
which plants require in relatively
the cycling and movement in the soil large amounts
Understanding nutrient and mobility are Micronutrients are those plants
require in much smaller amounts
useful in diagnosing nutrient deficiencies
Plants require ten different
macronutrients (calcium, carbon,
Mg+2 - hydrogen, oxygen, nitrogen,
H2PO4 phosphorus, potassium, chlorine,
SO4-2 sulphur and magnesium) and six
HPO4-2 micronutrients (iron, manganese,
+ zinc, copper, boron and
NH4 molybdenum)
+
K
- Soil analysis in the laboratory uses
NO3 Ca+2 chemical extractants to provide an
estimate of the amount of available
under field conditionsHow using cover crops and reducing inversion tillage
improved the soil and increased productivity
Challenges:
• Reduce losses of top soil due to wind erosion
• Improve soil biology and minimise loss of nutrition
Farm facts
Motivation for change: Farm name: Cambridge Farm
• Loss of top soil year on year due to wind erosion Growers Ltd
• Promoting, balancing and feeding soil biology & improving Grower: Charles Shropshire
the soil available nutrition Ha: 4000ha
• Belief that long term use of cover crops can reduce the Rotation: Lettuce, Wheat, Maize,
amount of artificial fertilisers used Celery/ Beetroot, Maize, Wheat,
Onions/ Potato
Location: Cambridgeshire
Actions taken:
• Treated each field separately on the basis of the outcomes
of soil analysis “We see cover cropping as a
• Started planning rotation timings between crops, working ‘need to do’ not a ‘nice to do’.
out what we could establish and grow Soil is such an important part
• Cover crops drilled between every crop - a ‘no bare soil of our farm and we need to
policy’- even if the gap is only weeks not months invest in its restoration and
• Attended events to better understand what species to use regeneration.
in the cover crop, and for what benefit – not just for the
soil but for the next crop
We have had to start viewing
• Stopped the blanket policy of cultivate everything, reducing
cover crops as cash crops as
the amount of land that is ploughed each year, a mindset
they add significant financial
change for the whole team benefit to the farms
longevity”Outcomes CFGL have been using a programme of cover crops and reduced tillage for 2 years, starting small to understand the operation that is required and the costs involved. Since then they have been assessing soil health to monitor the improvement to their soil but the benefits to crop quality and yields have been testimony to the programme they have followed. Since starting we have seen: A reduction in soil loss from wind erosion across our fields, which is fantastic An improvement in the friability of the soil Better establishment of arable crops A clear increase in the number of earthworms at all stages of maturity That even after costing in the production of cover crops, there is a reduction in cultivation costs, as well as reduction in the carbon footprint We are pleased with the outcome of the programme as we were told it can take more than five years to see significant changes in soil characteristics and we are already seeing improvements They have also learnt that: Timing is important. Cover crops drilled too late will struggle to establish and this must be factored in when choosing what cover crop to grow and the ability to irrigate if needed. It is important to research what species to use in the seed mixes and undertake both small and large trials to monitor the benefits as some species will help unlock vital nutrients in the soil, others will encourage mycorrhizal fungi keeping the soil alive – especially over winter.
Further information:
AHDB: Great soils
AHDB: Testing soil health
Visual Evaluation of Soil Structure
Earthworm identification guide
Think soils
Soil texture calculator
Video: LEAF The importance of soil at Greenseed
Simply sustainable soils
FAO: Soil assessment
You can also read