Spatio-Temporal Insights into Recent Electricity Outages in the U.S.: Drivers, Trends, and Impacts
←
→
Page content transcription
If your browser does not render page correctly, please read the page content below
Spatio-Temporal Insights into Recent Electricity
   Outages in the U.S.: Drivers, Trends, and Impacts
                                          Maeshal Hijazi∗ and Payman Dehghanian†
                                      Department of Electrical and Computer Engineering
                                             The George Washington University
                                                   Washington, DC, USA.
                                              {∗ mahijazi, † payman}@gwu.edu

   Abstract—Electrification is known as the greatest engineering         a variety of stakeholders to help enhance the reliability and
achievement in the 20st century, as its drives our daily lives           resilience of the electric power systems against power outages
and the operation of mission-critical systems and services. Any          in general and extreme weather events in particular.
disruption in the electric power delivery infrastructure could im-
pose catastrophic economical, social, environmental, and political          Reference [4] proposed a two-stage restoration scheme to
consequences. Even though there are concerted efforts to mitigate        facilitate the distribution system restoration following the high-
or predict the power outages that may lead to larger-scale               impact low-probability (HILP) seismic disasters. Furthermore,
blackouts, the data made available by the U.S. Department of             [5] introduced an advanced model predictive control (MPC)
Energy (DOE) during 2015-2022 on electric emergency incidents            based scheme to control the distributed energy resources
and disturbances in the U.S. indicate that there is an increase
in frequency and duration of power outages across the country.           (DERs), minimize the impact of transients and disruptions,
In this paper, we discuss a user-friendly visualization tool, a          speed up the response and recovery of particular system
power grid outage dashboard, that sheds some lights on the               functions, and maintain an acceptable operational reliability.
patterns behind, regional vulnerability, and impacts of these            In [6], a multi-objective mixed integer linear programming
outages. The developed dashboard helps in decision-making on             optimization problem was formulated to minimize the amount
the future allocation of funds and reinforcement investments to
tackle the power outages in an effort to build a more reliable           of load curtailments and generation operation costs when a
power system. Several examples indicate the importance of                power system is impacted by a hurricane while adhering to
finding better forecasting and mitigation techniques for power           system operational and technical constraints.
system outages driven by some particular events and in different            With the increased frequency of power outages, their pre-
geographical regions across the U.S.                                     diction has attracted some research attention as emerging tech-
  Index Terms—interrupted customers, NERC regions, outage                nologies became abundantly available such as high-resolution
causes, outage impacts, outage trends, power outages.                    measurements from phasor measurement units (PMUs) and the
                                                                         growing developments in data-driven online optimization and
                       I. I NTRODUCTION
                                                                         machine learning (ML) techniques. For instance, [7] proposed
   Electric power systems worldwide are being revolutionized             a framework that predicts power outages based on the current
by the growing digitalization and penetration of new tech-               weather conditions using graph neural networks (GNNs). In
nologies such as wide-area monitoring systems (WAMS) and                 addition, [8] utilized a satellite-based Visible Infrared Imag-
a variety of renewable energy resources (e.g., solar and wind)           ing Radiometer Suite (VIIRS) night light data product as a
with complex control procedures [1]. While such investments              surrogate for the power delivery to predict hurricane-induced
on grid modernization are primarily targetted to improve the             power outages in areas having limited access to historical data
power grid situational awareness, operational efficiency, and            records. Also, [9] proposed a data-driven model to predict
the reliability of the electric service delivery to end-use con-         the number of distribution network users that may experience
sumers, we have been observing an increase in the frequency              power outages when a typhoon passes by.
and duration of electricity outages in the U.S., in some cases              With all the abundant research efforts and developments
resulting in catastrophic blackouts. While the increased com-            to mitigate and predict power outages, the U.S. Department
plexity of the system operation and control, random equipment            of Energy’s (DOE) Electric Disturbance Events Annual Sum-
failures, protective relay’s miss-operations, and now-and-then           maries (OE-417) [10] have evidenced an increase in the
cyber adversaries are all contributing to power outages, the             frequency of power outages. Reference [11] indicated that
climate change-driven severe weather events (e.g., hurricanes,           the frequency of large blackouts in the U.S. is not decreasing
storms, and extreme temperature) are found to be the major               from 1998 to 2006. Reference [12] provided a comprehensive
driver of the electricity outages in the U.S. [2], [3]. The              analyses of large-scale power outages in the U.S. from 2002
recurrent power outages and blackouts in recent years calls              to 2019, where it discussed the power outage data in different
for new solutions, tool, and decision-making platforms for               states across the U.S. In this study, we report and discuss our
                                                                         recent developments in building a power outage dashboard that
  This work was supported by the Government of the Kingdom of Saudi
Arabia and in part by the U.S. National Science Foundation (NSF) under   presents and visualizes the spatio-temporal trends in power
Grants RISE-2022505, RISE-2220626, and ECCS-2114100.                     outages across the U.S. and demonstrates the causes and the

978-1-6654-9921-7/22/$31.00 ©2022 IEEE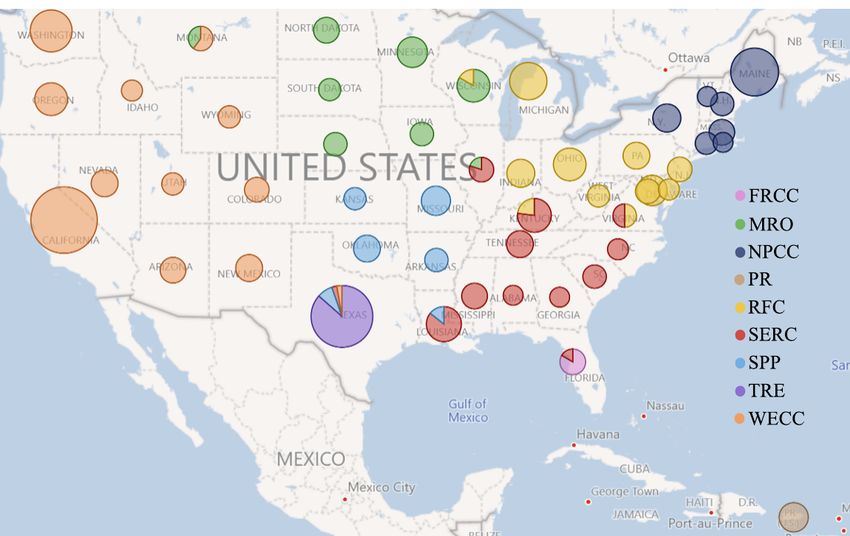
main drivers behind the power outages. Furthermore, in the • Assumed that the RF NERC region entry in the dataset
developed dashboard, the number of affected customers as is the same as that of the Reliability First Corporation
well as the amount of power outage with the corresponding (RFC) and that for SPP RE is the same as the one for
spatial and temporal characteristics under various types of Southwest Power Pool (SPP).
outage-inducing events are visualized. The proposed dash-
III. C AUSES , T RENDS , AND I MPACTS OF THE R ECORDED
board will help grid planners and decision-makers understand
P OWER O UTAGES IN THE U.S.
the regional vulnerabilities to power outages, and facilitate
making informed decisions on future investments and grid A. Causes
reinforcements for structural resilience. After pre-processing and filtering the recorded data as
The rest of this paper is organized as follows: Section II described in Section II-A, we here shed some lights on the
introduces the sources of the data and the data filtering and pre- causes and the primary drivers behind these power outages.
processing approach implemented in the developed dashboard. The studied events were recorded from 2015 to 2022, the
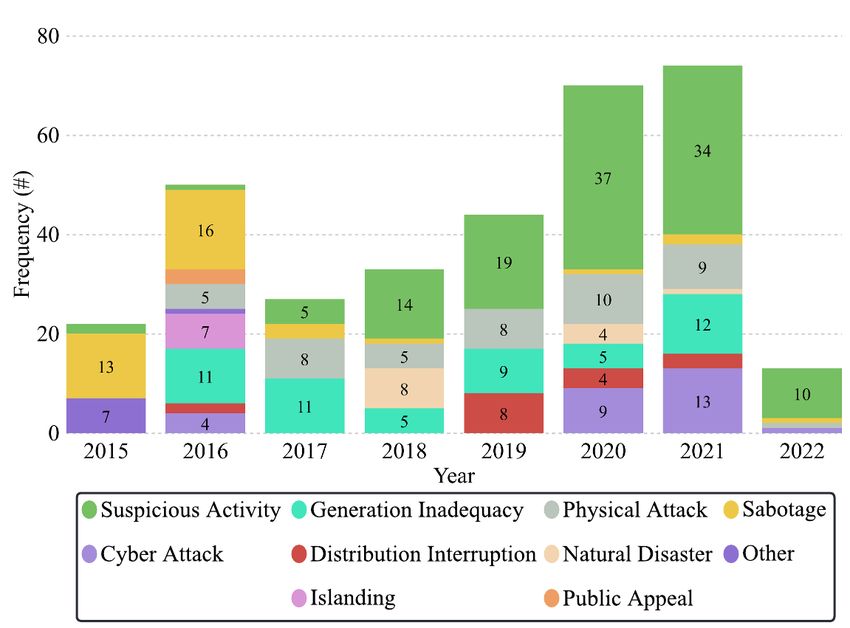
Section III discusses the spatio-temporal trends, causes, and statistics on which are shown in Fig. 1. This figure also
impacts of the U.S. power outages during 2015-2022, and illustrates the percentage frequency of each event happened
Section IV summarizes the research findings. through the years. Clearly, one can see that around 50% of
the power outages lately are due to sever weather events
II. DOE’ S E LECTRIC D ISTURBANCE E VENTS DATABASE such as thunderstorms, heat waves, or cold waves all driven
To enhance the public availability of data for research and by climate change. It is also worth noting that 17% of the
developments, the U.S. DOE requires electric utility compa- total power outages are due to system operation mistakes, i.e.,
nies to report any type of power outages within their regional human error, 14% are due to vandalism, and 10% are due to
territory, specifically named “form OE-417” report [10], [11]. transmission interruptions. Comparing these observations with
In this study, we focus only on the time interval from 2015 those reported in [11], one can clearly notice a significant
to 2022 as the DOE transformed the way data is captured in increase in frequency of all the major power outage drivers.
2015. The available dataset focuses on the time, month, and Severe Weather
0.7%
the date the power outage happened and restored, the affected 2.18% System Operations
5.02% Vandalism
states and the North American Electric Reliability Corporation
Transmission Interruption
(NERC) regions, the event type, the amount of power outages
9.34% Suspicious Activity
(demand loss), the number of customers affected, and any alert Generation Inadequacy
criteria indicated. Focusing on 2015-2022 interval, a total of 47.2% Physical Attack
2,430 events are analyzed in this study. Sabotage
13.37% Cyber Attack
A. Data Pre-processing and Filtering Distribution Interruption
Natural Disaster
To build the power grid outage visualization dashboard, the Other
downloaded data from the DOE dataset must be filtered and 16.38% Islanding
pre-processed. The pre-processing was done using Python 3.10 Public Appeal
and the visualization was accomplished using Microsoft Power Fig. 1. Frequency (in %) and types of outage-inducing events in the U.S. /
BI platform [13]. The following steps are conducted: recorded during 2015 to 2022.
• The sever weather events include those driven by win- B. Trends
ter temperatures, wind, thunderstorms as well as those Despite the abundant literature focused on development of
resulted from severe weather and a natural disaster. tools and mechanisms to mitigate and predict power system
• The physical attack events cover the actual physical outages, Fig. 2 of the developed power outage dashboard
attacks, the actual physical evens, the suspected physical shows an increasing trend in the total frequency of power
attacks, and the potential physical attack events. outages in each year from 2015 to 2021. This can be seen
• The sabotage events include the ones with and without in some specific events such as sever weather, system opera-
operation actions. tions, vandalism, and transmission interruptions. Additionally,
• Removed any extra spaces originally existing in the since 2019 (post COVID), the number of outage events is
dataset that could lead to miss-counting or miss- observed on the rise significantly. Furthermore, Fig. 3 shows a
classification of power outages. closer look at less-frequent outage events, where it highlights
• Created a separate outage entry for power outages in that there is an increasing trend recorded for the suspicious
the dataset that are attributed to multiple event types. activities, a decreasing trend is found for sabotage events,
The number of affected customers and the amount of and a stable trend is observed for those event driven by
demand loss were accordingly assumed to be equally power generation adequacy and physical attacks. Figure 4 from
shared between all newly-generated outage events. the proposed power outage dashboard illustrates the monthly
• Created a separate outage entry per NERC region [14] power outages occurred from 2015 to 2022. It indicates that
for power outages that are recorded in multiple NERC re- the months with most recorded power outages are February,
gions. The number of affected customers and the amount September, and July. This could be expected as these months
of demand loss were accordingly assumed to be equally are known for their extreme hot and cold weather realizations
shared between all newly-generated outage events. such as the blackout and outage events that happened in the
state of Texas due to the cold storm in February 2021.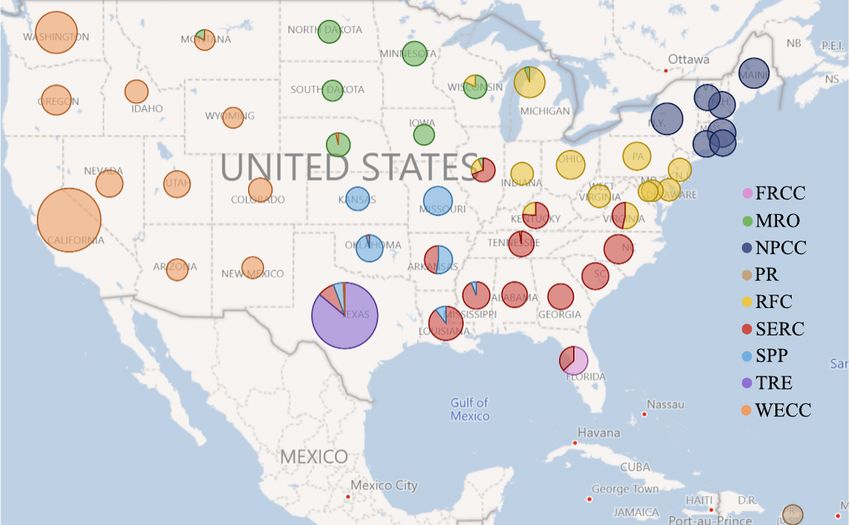
Fig. 4. The monthly frequency of power outages recorded from 2015 to 2022.
Fig. 2. The yearly frequency of power outages recorded from 2015 to 2022.
5.76%1.4%
7.49%
26.79% WECC
SERC
9.38% NPCC
RFC
TRE
SPP
MRO
13.74%
FRCC
20% PR
15.06%
/
Fig. 5. Frequency (in %) of power outages for each NERC region recorded
during 2015 to 2022.
a better performance with decreasing trends of power
outages through the years.
Fig. 3. The yearly power outages attributed to less-frequent events recorded • Since 2019 (Post COVID), the frequency of power out-
from 2015 to 2022. ages at Midwest Reliability Organization (MRO) region
has increased significantly.
C. Impacts
Since each NERC region is composed of several U.S.
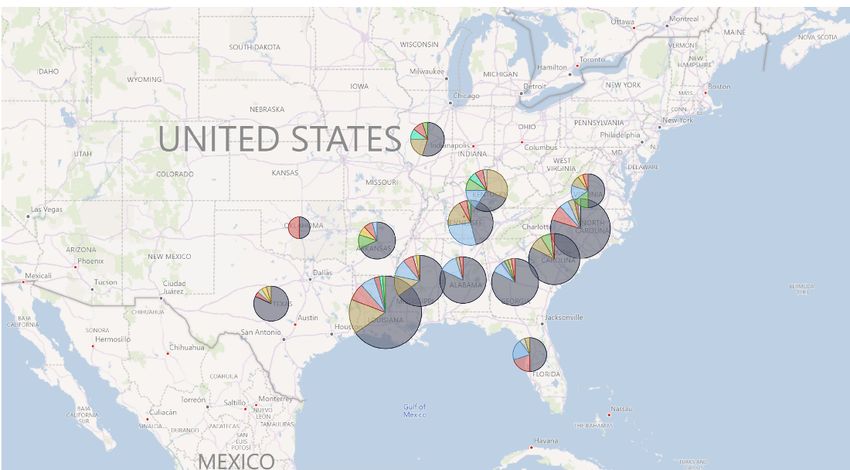
While knowledge on the main underlying drivers and trends states, Fig. 7a from the developed power outage dashboard
behind the recorded power outages in the past is useful, illustrates the U.S. map with circles on each state, the ra-
additional insights could be grained when the location of the dius size of which corresponding to the frequency of power
outages and impacts they leave to the society are quantified and outages. Furthermore, the circle’s colors correspond to the
studied. Figure 5 from the developed power outage dashboard NERC region in which the outage event occurred. The figure
illustrates the percentage frequency of power outages recorded demonstrates that the states with most recorded outages during
in each region within the NERC territory during 2015 to the analyzed interval are Texas, California, and Washington
2022. It indicates that most power outages occurred at the with 265, 252, 130 recorded outages, respectively. In addition,
Western Electricity Coordinating Council (WECC), followed Table I captured from the developed power outage dashboard
by the Southeastern Electric Reliability Council (SERC) and shows the frequency of power outages per U.S. state and
Northeast Power Coordinating Council (NPCC), respectively. NERC region, where most outage events are found to have
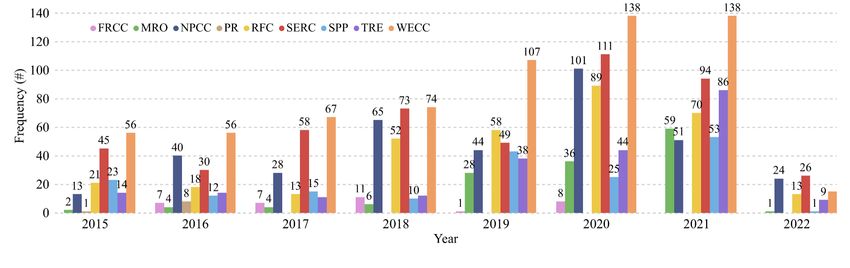
In addition, Fig 6 from the developed power outage dashboard been occurred in WECC, SERC, and NPCC regions with 651,
shows the total amount of power outages recorded per NERC 486, and 366 recorded outages, respectively. To visualize how
region annually from 2015 to 2022. Some key findings from each of the major outage-inducing events have affected the
Fig 6 are highlighted in the following: U.S. states and the NERC regions, Figures 7b, 7c, and 7d
• On average, WECC, RFC, Texas Reliability Entity (TRE) captured from the developed power outage dashboard show the
and SERC regions demonstrate an increasing trend in the U.S. map for power outages per U.S. state and NERC region
realized power outages. for the following events: severe weather, system operation, and
• On average, Florida Reliability Coordinating Council vandalism, respectively. Figure 7b indicates the most affected
(FRCC), SPP, and Puerto Rico (PR) regions are attributed states during severe weather events from 2015 to 2022 have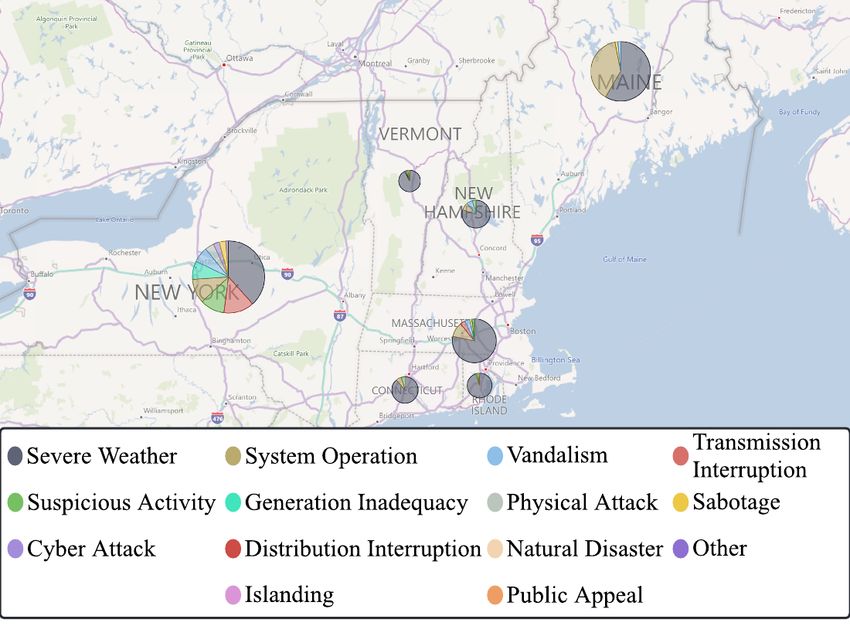
Fig. 6. The total number of power outages per NERC region recorded during 2015 to 2022.

                                   (a) All events                                                  (b) Severe weather

                                (c) System operation                                                 (d) Vandalism
Fig. 7. Power outages across the U.S. per state and NERC region for the events recorded during 2015 to 2022.

been Texas, California, and North Carolina with 134, 72, and                 respectively. This implies that this event type highly impacts
47 recorded events, respectively. Additionally, some states                  the WECC region and its served communities, calling for
were not affected by such events including Montana, Utah,                    the development and deployment of effective mitigation and
Puerto Rico, and New Mexico. The most affected NERC                          prediction techniques and strategies.
regions by severe weather events seem to be SERC and NPCC.
                                                                                In order to visualize the underlying drivers behind the
Regarding Fig. 7c, one can notice that the most affected
                                                                             power outages in the most-affected NERC regions, Fig. 8
states by the system operation events are California, Texas,
                                                                             captured from the developed power outage dashboard shows
and Maine with 41, 37, and 25 recorded events, respectively.
                                                                             the U.S. map for power outages per U.S. state and event type
Interesting observation is that all states in the U.S. were
                                                                             recorded during 2015-2022 for most-affected NERC regions
affected by this type of event. WECC and RFC regions are
                                                                             (i.e, WECC, SERC, and NPCC). Figure 8a indicates that
found to be the most affected regions by the system operation
                                                                             WECC region is heavily affected by the three outage events:
events. Figure 7d shows that the most affected states by
                                                                             system operations, vandalism, and transmission interruptions.
vandalism events are California, Washington, and Utah all
                                                                             Unlike the other NERC regions, the severe weather event is not
from the WECC region with 55, 30, and 28 recorded events,
                                                                             the main contributor to power outages in the WECC region.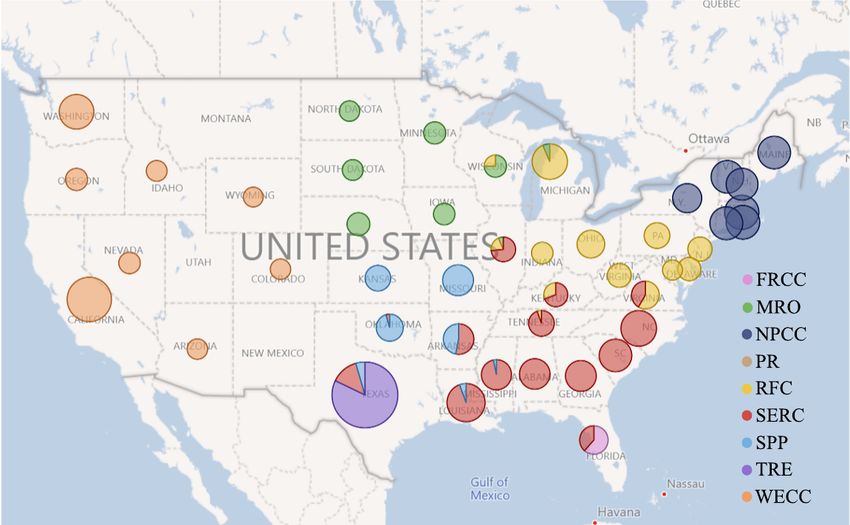
TABLE I
F REQUENCY OF P OWER O UTAGES P ER U.S. S TATE AND NERC R EGION
                 R ECORDED DURING 2015 TO 2022

                                                                                                  (a) WECC

                                                                                                  (b) SERC

According to Fig 8a, California and Washington are the states
that were impacted the most by these event categories. On the
other hand, the SERC and NPCC regions were highly affected
by the severe weather event as shown in Fig. 8b and Fig. 8c,
as mentioned earlier. As shown in these figures, most states
in the SERC and NPCC regions are affected mainly by severe
weather events; some states are also affected by other types
of events, such as Kentucky and Tennessee from the SERC                                           (c) NPCC
region and New York from the NPCC region.                         Fig. 8. Power outages per U.S. state and event type recorded during 2015 to
                                                                  2022 for most affected NERC regions.
   There is a need to minimize power outages due to their
tendency to cause a great deal of environmental damages and
economical losses in the society. For instance, the number           Another measure of how severe a power outage was is
of customers affected is a measure of how influential a           the amount of demand loss. Therefore, the developed power
power outage was. Figure 9 captured from the developed            outage dashboard presents a treemap on the amount of demand
power outage dashboard presents a treemap for the number          loss (in MW) per month and event type during 2015 to 2022
of affected customers per months and event type during 2015       as shown in Fig. 10. It shows that the maximum amount of
to 2022. Clearly, many customers were affected in the months      demand loss has been recorded in the months of January,
of August, September, and February. Even though February is       October, and August. Note that while imposing the most
attributed the most number of outages as compared to other        significant power outage, two of these three months were not
months, as indicated in Fig 4, those outages did not affect       among the months with most number of affected customers.
customers as much as the ones happened in the months of           Also, one can conclude from Fig. 9 and Fig. 10 that the months
September and August. Moreover, the main driver of these          of November and December are those typically found with the
outages for most of the months is the severe weather.             least number of affected customers and amount of demand
                                                                  loss, which is in line with the observations made in Fig. 4.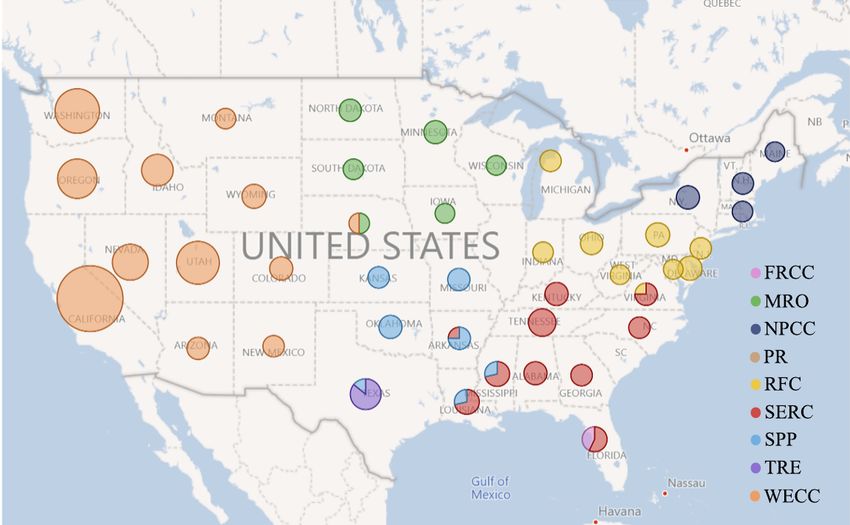
August February June March May December
Sy… Severe Weather 7M
Tr…
April
Severe Weather 10M Severe Weather 10M
…
Severe Weather 17M … October July
September …
Severe Wea… Severe We…
Severe Weather 5M
Tr… Di… Sy… T…
January
November
System … Transmission I…
T… Syste…
…
Severe Weather 12M T… Severe Weather 10M Severe Weather 6M System Op… Severe Weather 4M Tra… Severe Weather 3M
/
Fig. 9. Treemap for the number of affected customers due to power outages per month and event type from 2015 to 2022.
January October June September July
…
Severe Weat…
…
Severe Weather 48K Transmission I…
Other 42K Transmiss… Severe Weather … Syste…
August February
Tra… Seve…
Natural… Physic… Syste…
March May D… …
Islanding… S… T…
Transmis… Sev…
Vandalism 15K
Trans… April S… S…
Severe Weather 183K Severe Weather 35K Suspi… Severe Weather 34K Sys… T… … Syste… S…
/
Fig. 10. Treemap for the amount of demand loss (in MW) due to power outages per month and event type from 2015 to 2022.
IV. C ONCLUSION [3] A. Hanchey, A. Schnall, T. Bayleyegn, S. Jiva, A. Khan, V. Siegel,
R. Funk, and E. Svendsen, “Notes from the field: deaths related to
In this paper, we presented a developed dashboard for a bet- hurricane ida reported by media—nine states, aug. 29–sep. 9, 2021,”
Morbidity and Mortality Weekly Rep., vol. 70, no. 39, p. 1385, 2021.
ter understanding of the U.S. power outages recorded during [4] Z. Yang, P. Dehghanian, and M. Nazemi, “Seismic-resilient electric
2015 to 2022. Using the DOE’s electric emergency incidents power distribution systems: Harnessing the mobility of power sources,”
and disturbances dataset, the original data was filtered, pre- IEEE Tran. on Ind. Appl., vol. 56, no. 3, pp. 2304–2313, 2020.
[5] S. Wang, P. Dehghanian, M. Alhazmi, and M. Nazemi, “Advanced
processed, and inserted in the developed visualization tool. The control solutions for enhanced resilience of modern power-electronic-
yearly records on power outages from 2015 to 2022 indicated interfaced distribution systems,” Journal of Modern Power Systems and
that (1) the frequency of power outages has been increasing, Clean Energy, vol. 7, no. 4, pp. 716–730, 2019.
[6] M. Abdelmalak and M. Benidris, “A markov decision process to enhance
(2) the most frequent power outages were found to occur in power system operation resilience during hurricanes,” in 2021 IEEE
February, August, and July, (3) the main causes behind the Power & Energy Society General Meeting, pp. 01–05, IEEE, 2021.
recorded power outages were due to severe weather, system [7] D. Owerko, F. Gama, and A. Ribeiro, “Predicting power outages using
graph neural networks,” in 2018 IEEE Global Conference on Signal and
operations, and vandalism events, (4) WECC, SERC, and Information Processing (GlobalSIP), pp. 743–747, IEEE, 2018.
NPCC regions were the most affected NERC regions by power [8] J. P. Montoya-Rincon, S. Azad, R. Pokhrel, M. Ghandehari, M. P. Jensen,
outages, (5) unlike other NERC regions which were mainly and J. E. Gonzalez, “On the use of satellite nightlights for power outages
prediction,” IEEE Access, vol. 10, pp. 16729–16739, 2022.
impacted by the severe weather event, WECC was mainly [9] H. Hou, J. Yu, H. Geng, L. Zhu, M. Li, Y. Huang, and X. Li,
affected by system operation, vandalism, and transmission “Data-driven prediction for the number of distribution network users
interruptions events, (6) some of the most affected U.S. states experiencing typhoon power outages,” IET Generation, Transmission &
Distribution, vol. 14, no. 24, pp. 5844–5850, 2020.
by the power outages were California, Texas, Washington, [10] D. of Energy, “Electric disturbance events (oe-417) annual summaries.”
North Carolina, and Maine. Lastly, the severe weather was https://www.oe.netl.doe.gov/OE417 annual summary.aspx.
found responsible for the highest number of affected customers [11] P. Hines, J. Apt, and S. Talukdar, “Trends in the history of large
blackouts in the united states,” in 2008 IEEE Power and Energy Society
and amount of demand loss from 2015 to 2022. The developed General Meeting-Conversion and Delivery of Electrical Energy in the
dashboard will improve the decision-making process on future 21st Century, pp. 1–8, IEEE, 2008.
allocations of funds and investments to increase the reliability [12] A. Ankit, Z. Liu, S. B. Miles, and Y. Choe, “Us resilience to large-scale
power outages in 2002–2019,” Journal of Safety Science and Resilience,
of the power gird in response to power outages. vol. 3, no. 2, pp. 128–135, 2022.
[13] D. Iseminger, “What is power bi desktop?.” https://docs.microsoft.com/
en-us/power-bi/fundamentals/desktop-what-is-desktop, 09 2021.
R EFERENCES [14] N. A. E. R. Corporation, “Regional entities.” https://www.nerc.com/
AboutNERC/keyplayers/Pages/default.aspx.
[1] S. R. Sinsel, R. L. Riemke, and V. H. Hoffmann, “Challenges and
solution technologies for the integration of variable renewable energy
sources—a review,” Renewable Energy, vol. 145, pp. 2271–2285, 2020.
[2] G. Zhang, H. Zhong, Z. Tan, T. Cheng, Q. Xia, and C. Kang, “Texas
electric power crisis of 2021 warns of a new blackout mechanism,”
CSEE Journal of Power and Energy Syst., vol. 8, no. 1, pp. 1–9, 2022.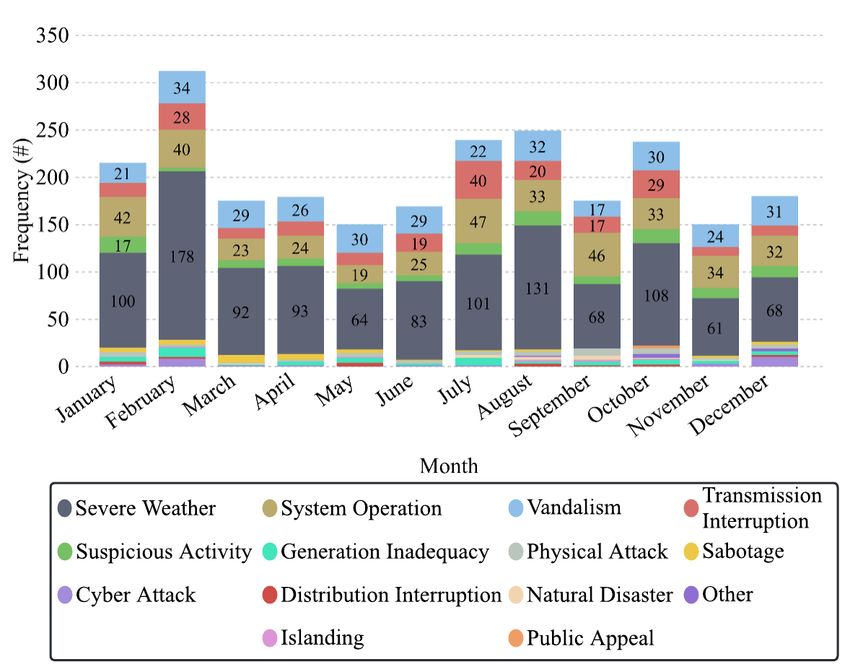
You can also read